XRP Price Analysis: Where’s XRP Going Next After Latest Rejection at the 100-Day MA?
XRP is trading at $1.37 as May nears its end, having reversed all gains from what briefly appeared to be the most promising technical setup of the corrective cycle. The breakout above the 100-day moving average on the USDT chart has failed to hold, and a lower high has formed on the BTC pair. The levels that looked like support last week are now the targets bulls need to reclaim to return to their starting point.
USDT Pair Analysis
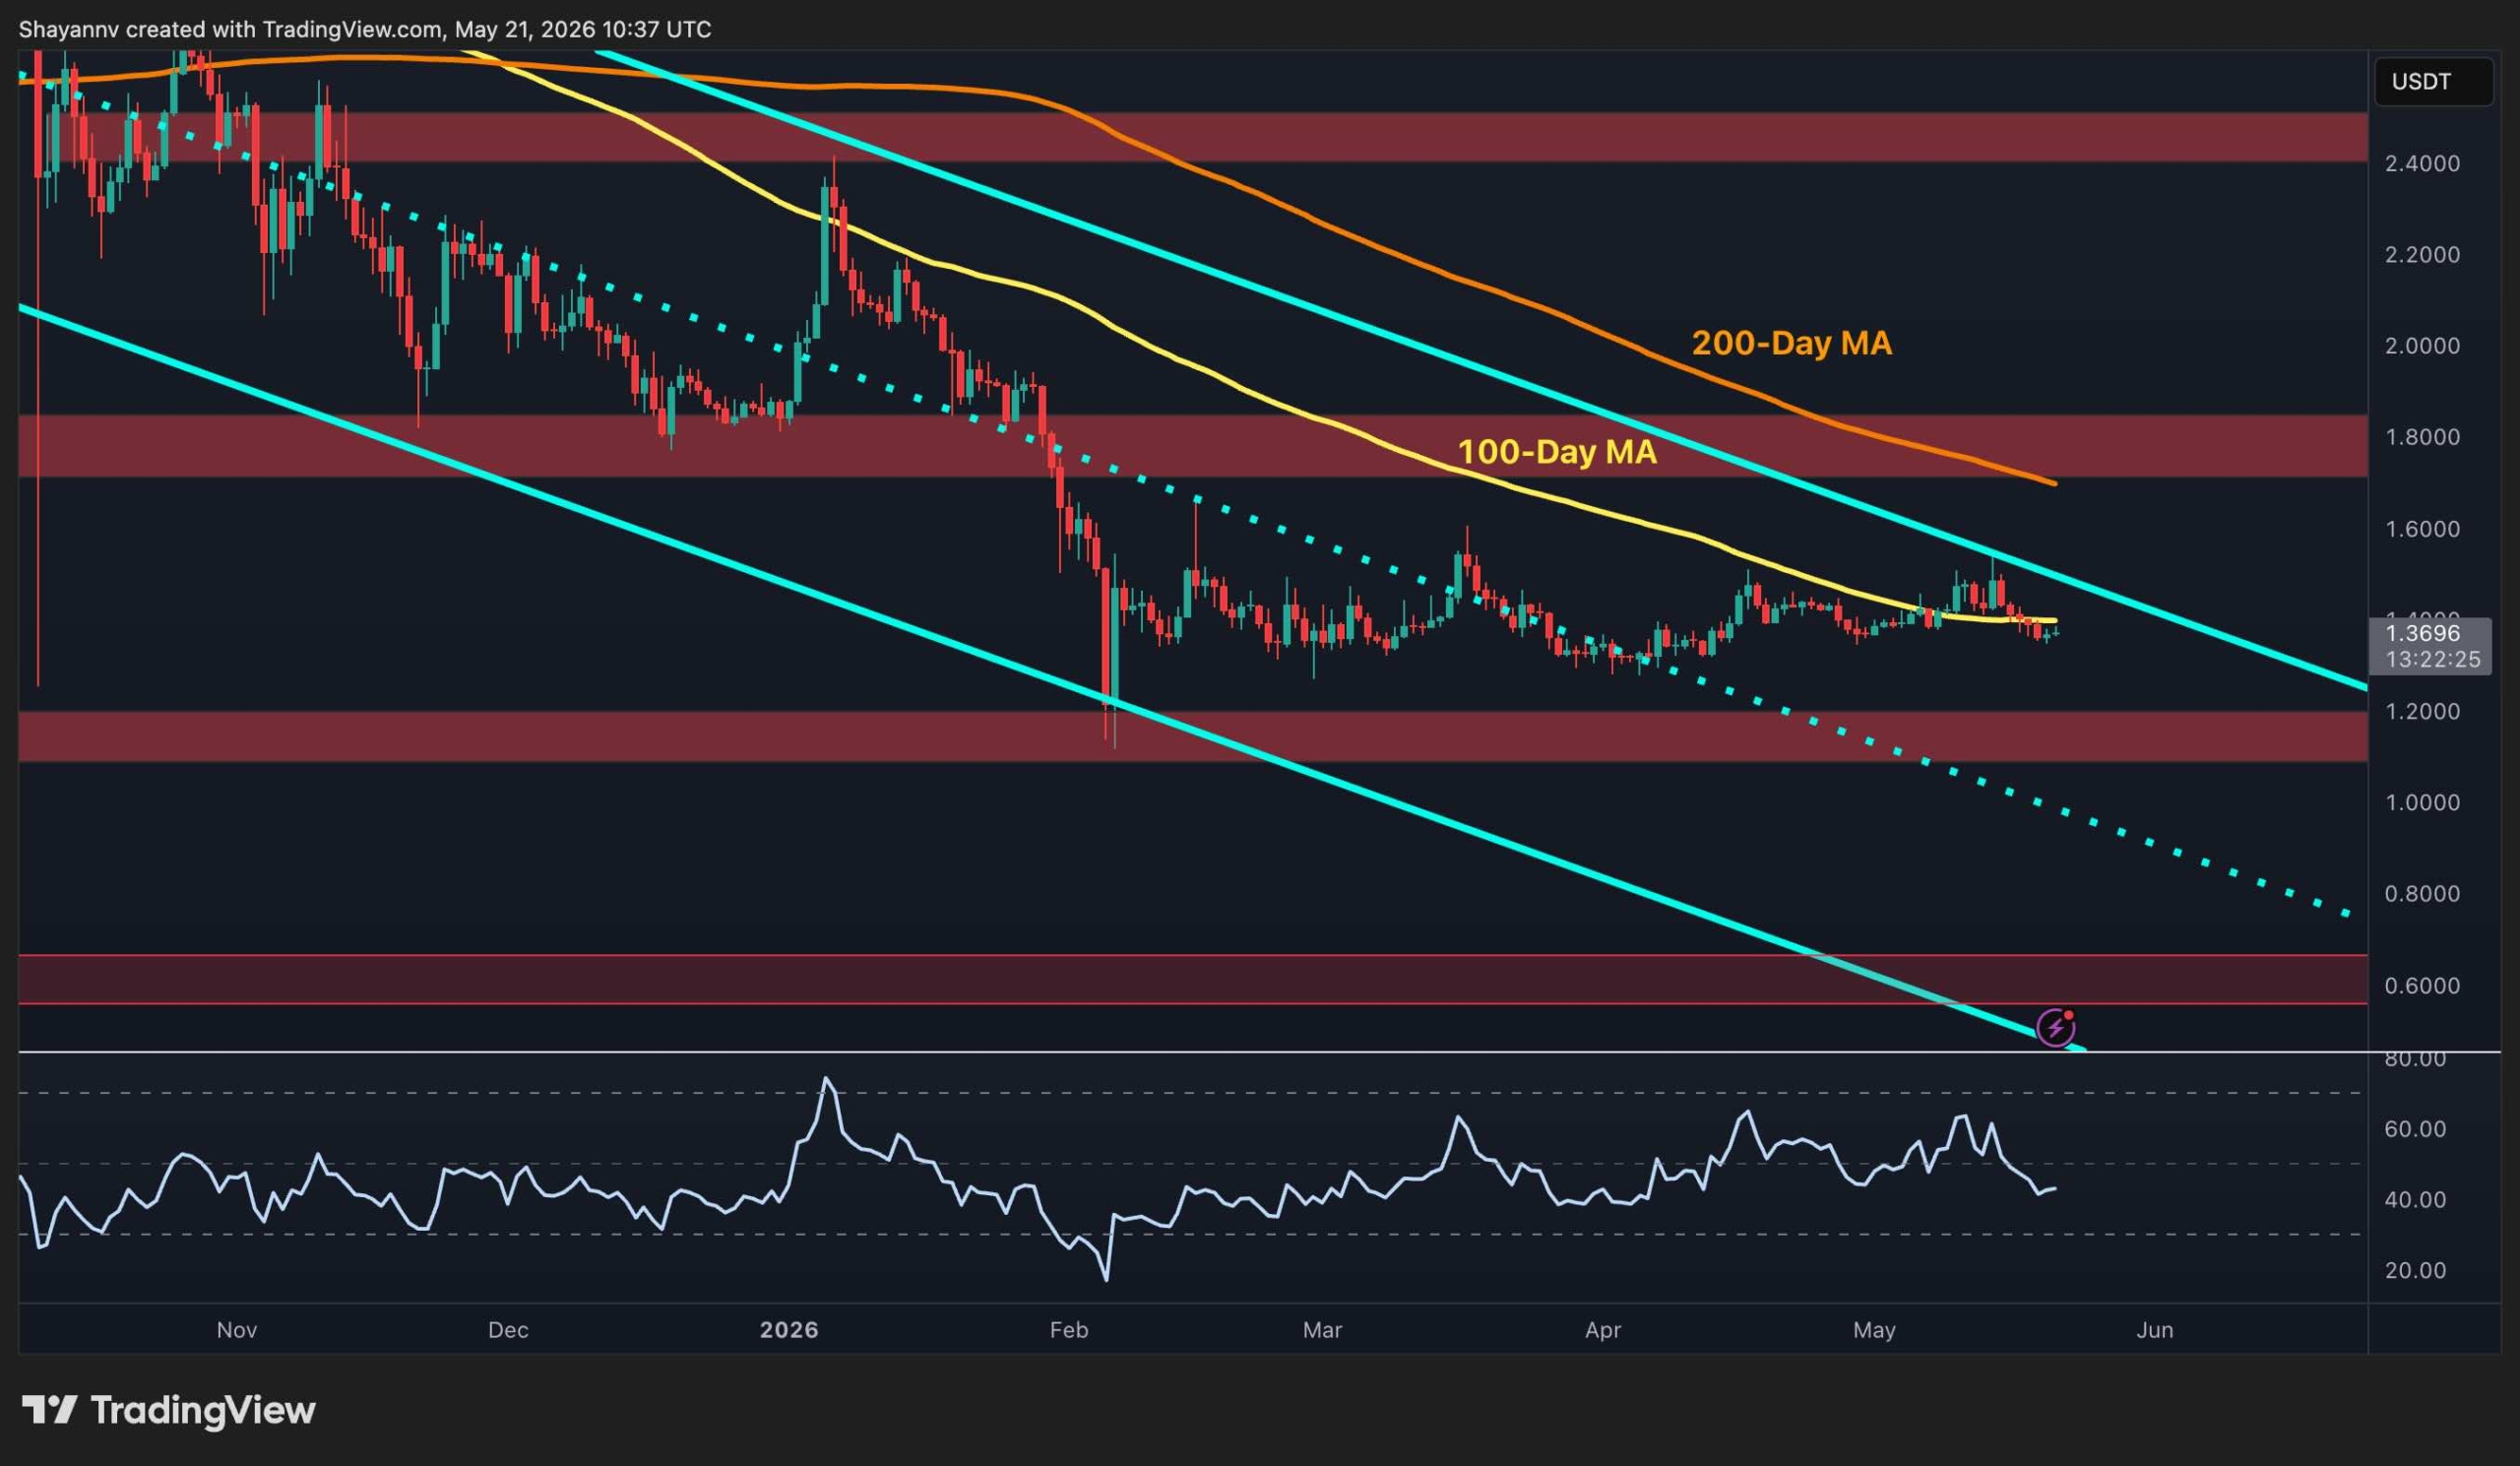
The USDT pair’s daily timeframe setup appeared compelling last week. The asset was testing the upper boundary of the long-term descending channel and holding above the 100-day moving average at approximately $1.45, with the Relative Strength Index (RSI) climbing toward 65.
However, this move has played out as a textbook rejection. XRP failed to close a single candle above the channel, and the subsequent sell-off has brought the price back to $1.37. The 100-day moving average, which was considered dynamic support just days ago, is now nearby overhead resistance at $1.40, just below the descending channel ceiling.
The RSI has fallen from 65 back to the 40s, eliminating the momentum that made the setup optimistic. The $1.20 demand zone below should now be monitored as a potential floor, while a recovery above $1.45 and the 100-day moving average remains the minimum requirement to rebuild any constructive case. Yet, with the broader altcoin market declining, the path of least resistance points toward another test of support rather than another attempt at resistance.
BTC Pair Analysis
The brief breakout above 1,800 sats that appeared on the BTC pair last week has proven to be a fakeout. XRP/BTC has slipped back to around 1,770 sats, creating a lower high at approximately 1,800-1,900 sats. The RSI, which had recovered from an extreme low of roughly 25 to above 50 while demonstrating a bullish divergence, has also faded back toward 40. The relief bounce is losing energy before it accomplishes anything structurally meaningful.
The failed reclaim of 1,800 sats is the defining development on this pair. It confirms that the oversold bounce was corrective rather than structural, and that the broader downtrend in the ratio remains intact. The 100-day moving average at approximately 1,900 sats and the 200-day moving average at approximately 2,100 sats continue to decline well above, offering no nearby reference for a recovery.
Below, the lower channel boundary near 1,550 sats and the 1,500 sat horizontal support band remain the next downside targets if the current level gives way. With altcoin sentiment deteriorating across the board, there is little in the near-term macro picture to suggest that pressure is about to ease.
Leave a Reply