Bitcoin Faces Intense Selling Pressure After Breaching Key Support Levels
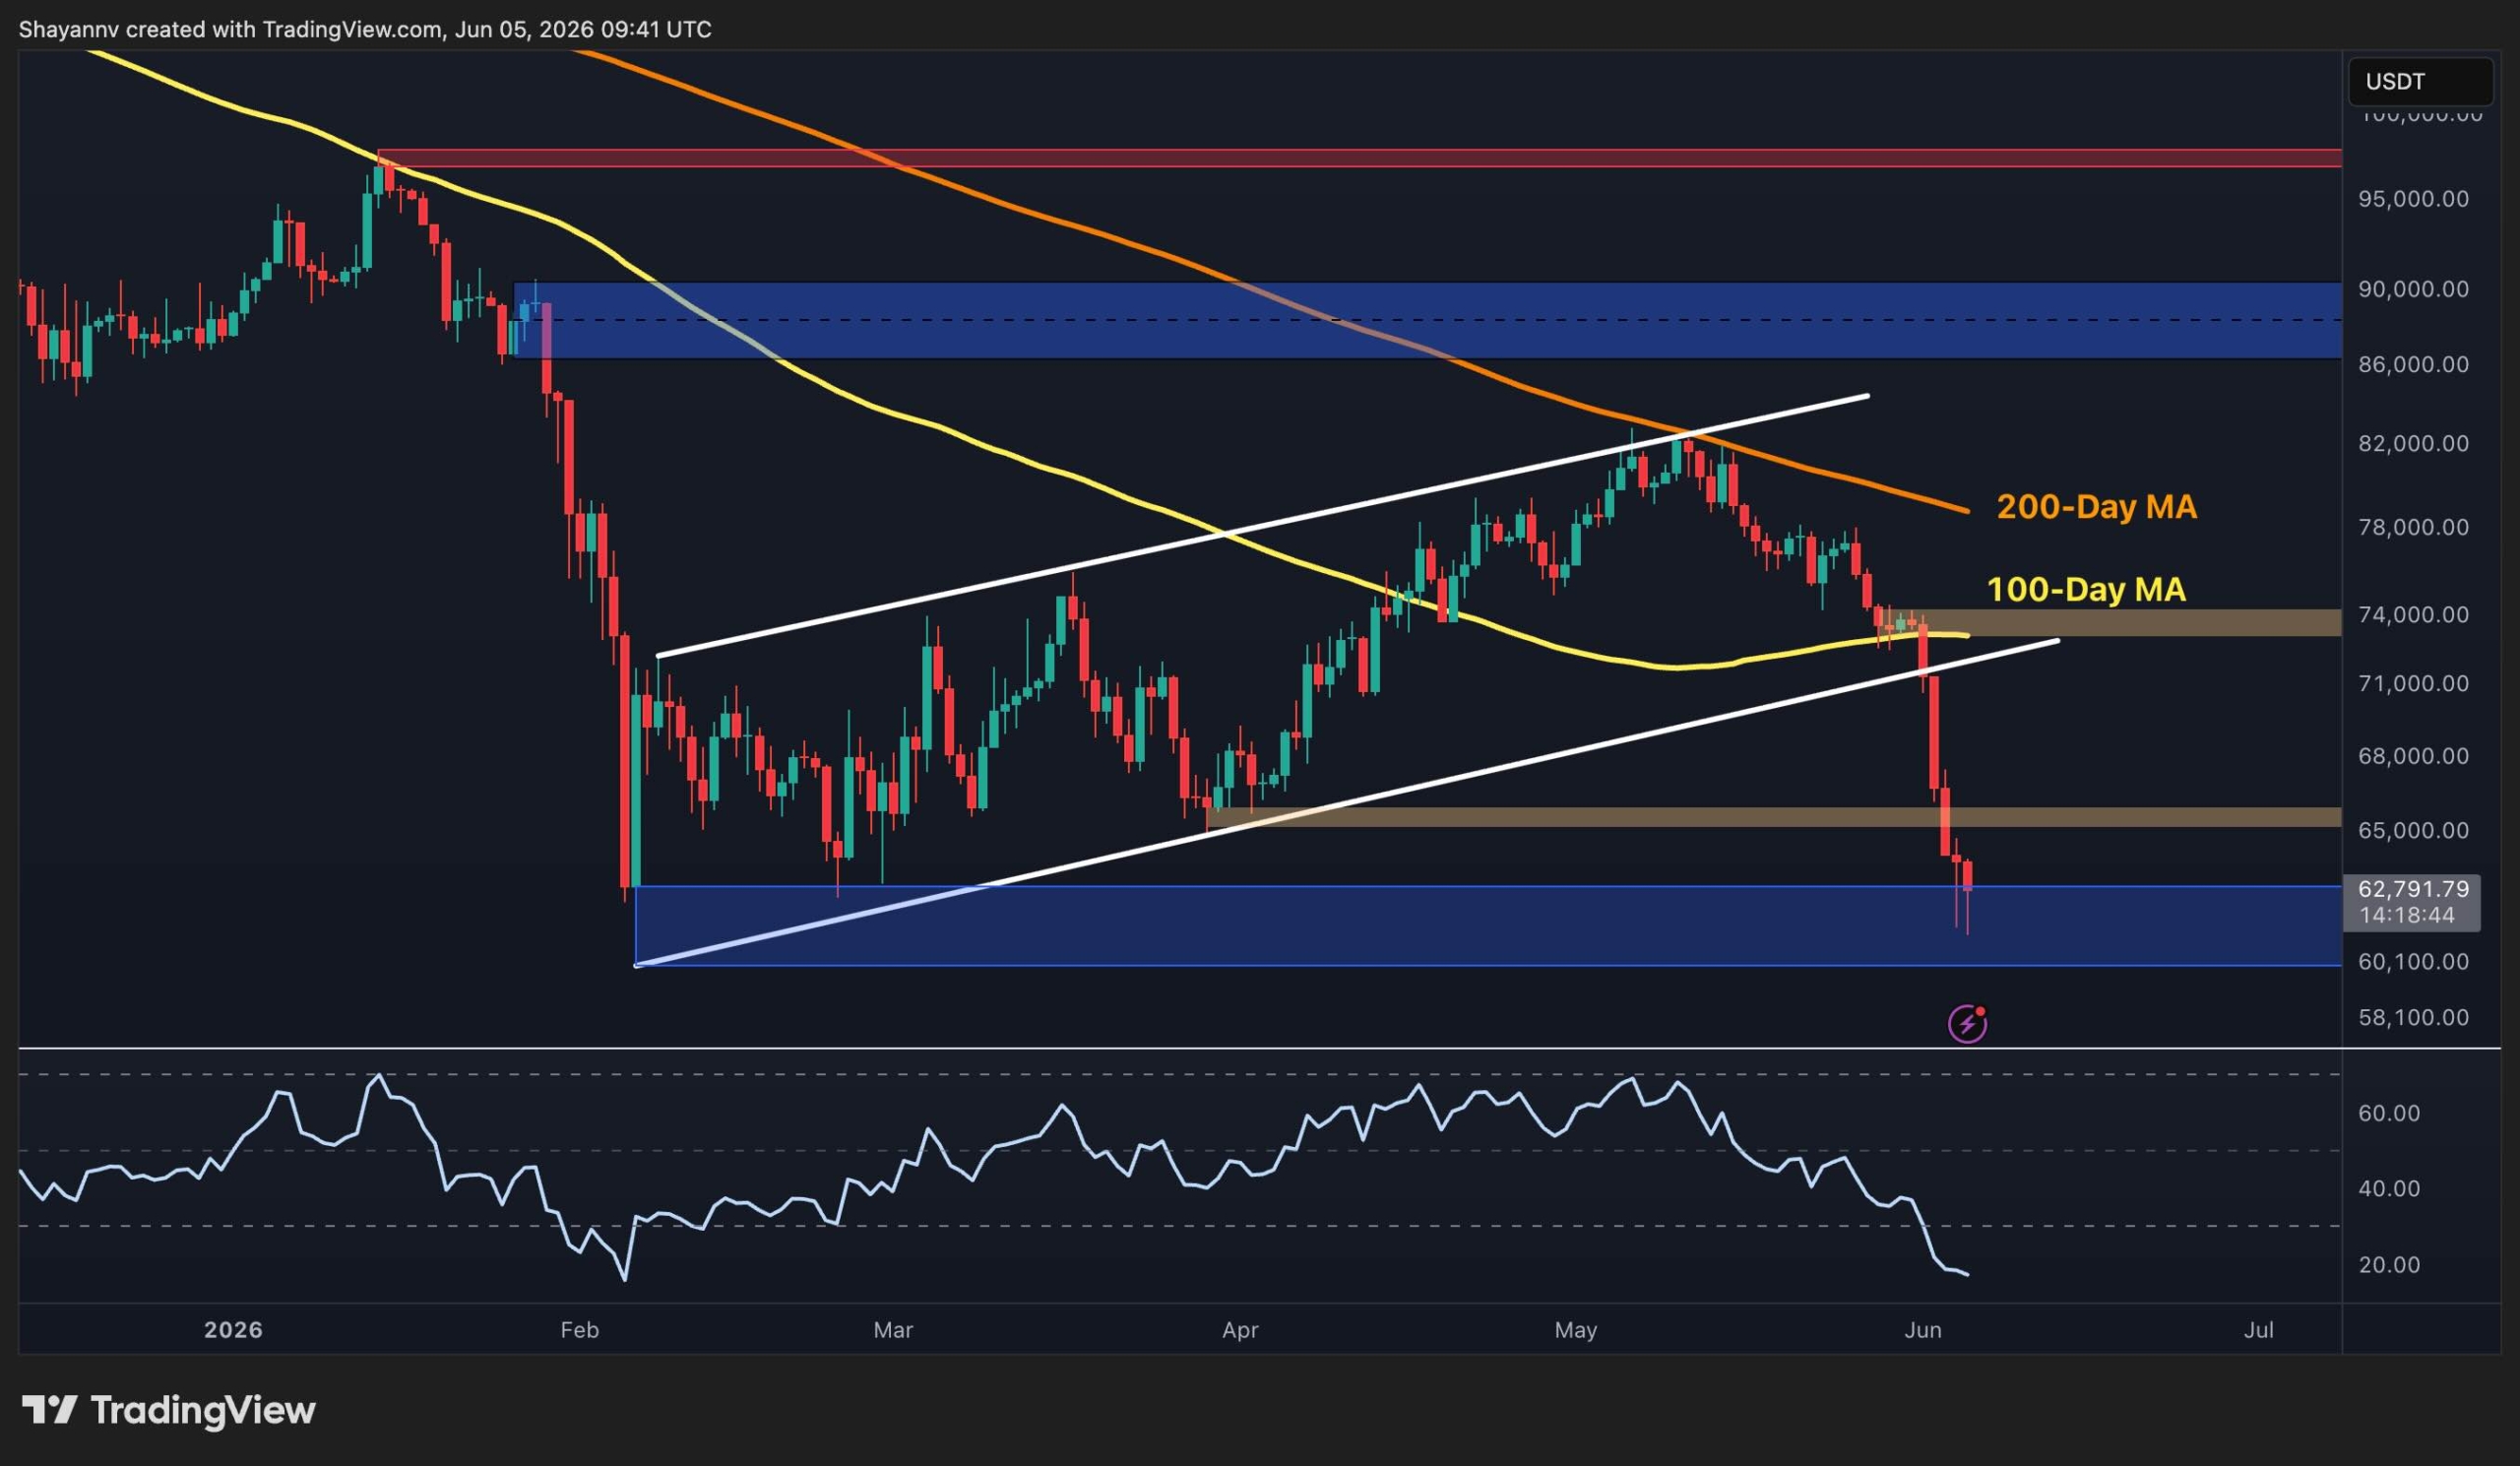
Bitcoin is currently experiencing significant selling pressure, having rapidly fallen below multiple critical support levels. A recent rejection from the descending 200-day moving average triggered a sharp sell-off, invalidating the prior rising channel and pushing BTC back towards a major demand zone around $60,000. Concurrently, on-chain data indicates that market participants are increasingly realizing losses, signaling a deterioration in investor sentiment.
Bearish Breakdown Confirmed
On the daily chart, Bitcoin has confirmed a substantial bearish breakdown after dropping below both its ascending channel and the 100-day moving average, which had been situated near $74,000. This channel had previously supported the cryptocurrency’s recovery from February lows, but its recent violation suggests that buyers have lost control of the intermediate trend.
The rejection occurred near the confluence of the channel’s upper boundary and the descending 200-day moving average, around the $82,000 mark. Since then, BTC has undergone an aggressive decline, slicing through the $74,000 support area and the significant low of $65,000 from late May with minimal resistance.
The price is now testing a major support block at $60,000, a level that previously served as a strong rebound area following the February capitulation. This zone represents the last significant line of defense for bulls before the market potentially opens the door to substantially lower levels.
Severity of Breakdown Evident on Shorter Timeframes
The 4-hour chart underscores the severity of the recent breakdown. Following an extended period of consolidation near the $74,000 region, BTC failed to reclaim this level and subsequently broke below the lower boundary of the daily ascending channel that had supported price action for months.
As the breakdown accelerated, the $65,000 support area also gave way, driving the price directly into the $60,000-$62,000 demand region. This area is currently acting as a floor, preventing further downside and has already attracted some buying interest.
An important observation comes from the Relative Strength Index (RSI), which has formed a mild bullish divergence under extremely oversold conditions while the price has established fresh local lows. Although this signal is still in its early stages, it suggests that bearish momentum may be weakening in the short term and could support a temporary rebound towards the $65,000 resistance zone.
However, from a structural perspective, the market continues to print lower highs and lower lows. As long as BTC remains below the broken support levels at $65,000 and $74,000, any recovery is likely to be viewed as a corrective move rather than the commencement of a new uptrend.
On-Chain Data Signals Widespread Losses
The Adjusted Spent Output Profit Ratio (aSOPR), a metric that measures whether coins moved on-chain are being sold at a profit or loss, is providing a significant signal regarding investor behavior.
The chart indicates that the 30-day Exponential Moving Average (EMA) of aSOPR has fallen below the critical 1.0 threshold. Historically, readings above 1 signify that market participants are realizing profits on average, while values below 1 suggest that coins are being spent at a loss.
The recent drop below 1 coincides with Bitcoin’s decline towards the $60,000 area and reflects growing capitulation among holders. This shift suggests that a larger proportion of investors are now exiting positions at a loss, a behavior commonly associated with bearish market phases and periods of weak confidence.
While persistent readings below 1 often accompany downtrends, they can also signal the later stages of a corrective phase as weaker hands exit the market. Therefore, traders should closely monitor whether aSOPR can reclaim the 1.0 level. A recovery above that threshold would indicate renewed profitability across the network and could support broader market stabilization.
For now, both price action and on-chain data continue to favor sellers, with the $60,000 support region remaining the key battleground that will likely determine Bitcoin’s next major directional move.
Leave a Reply