XRP Begins June With Steepest Decline in Three Months
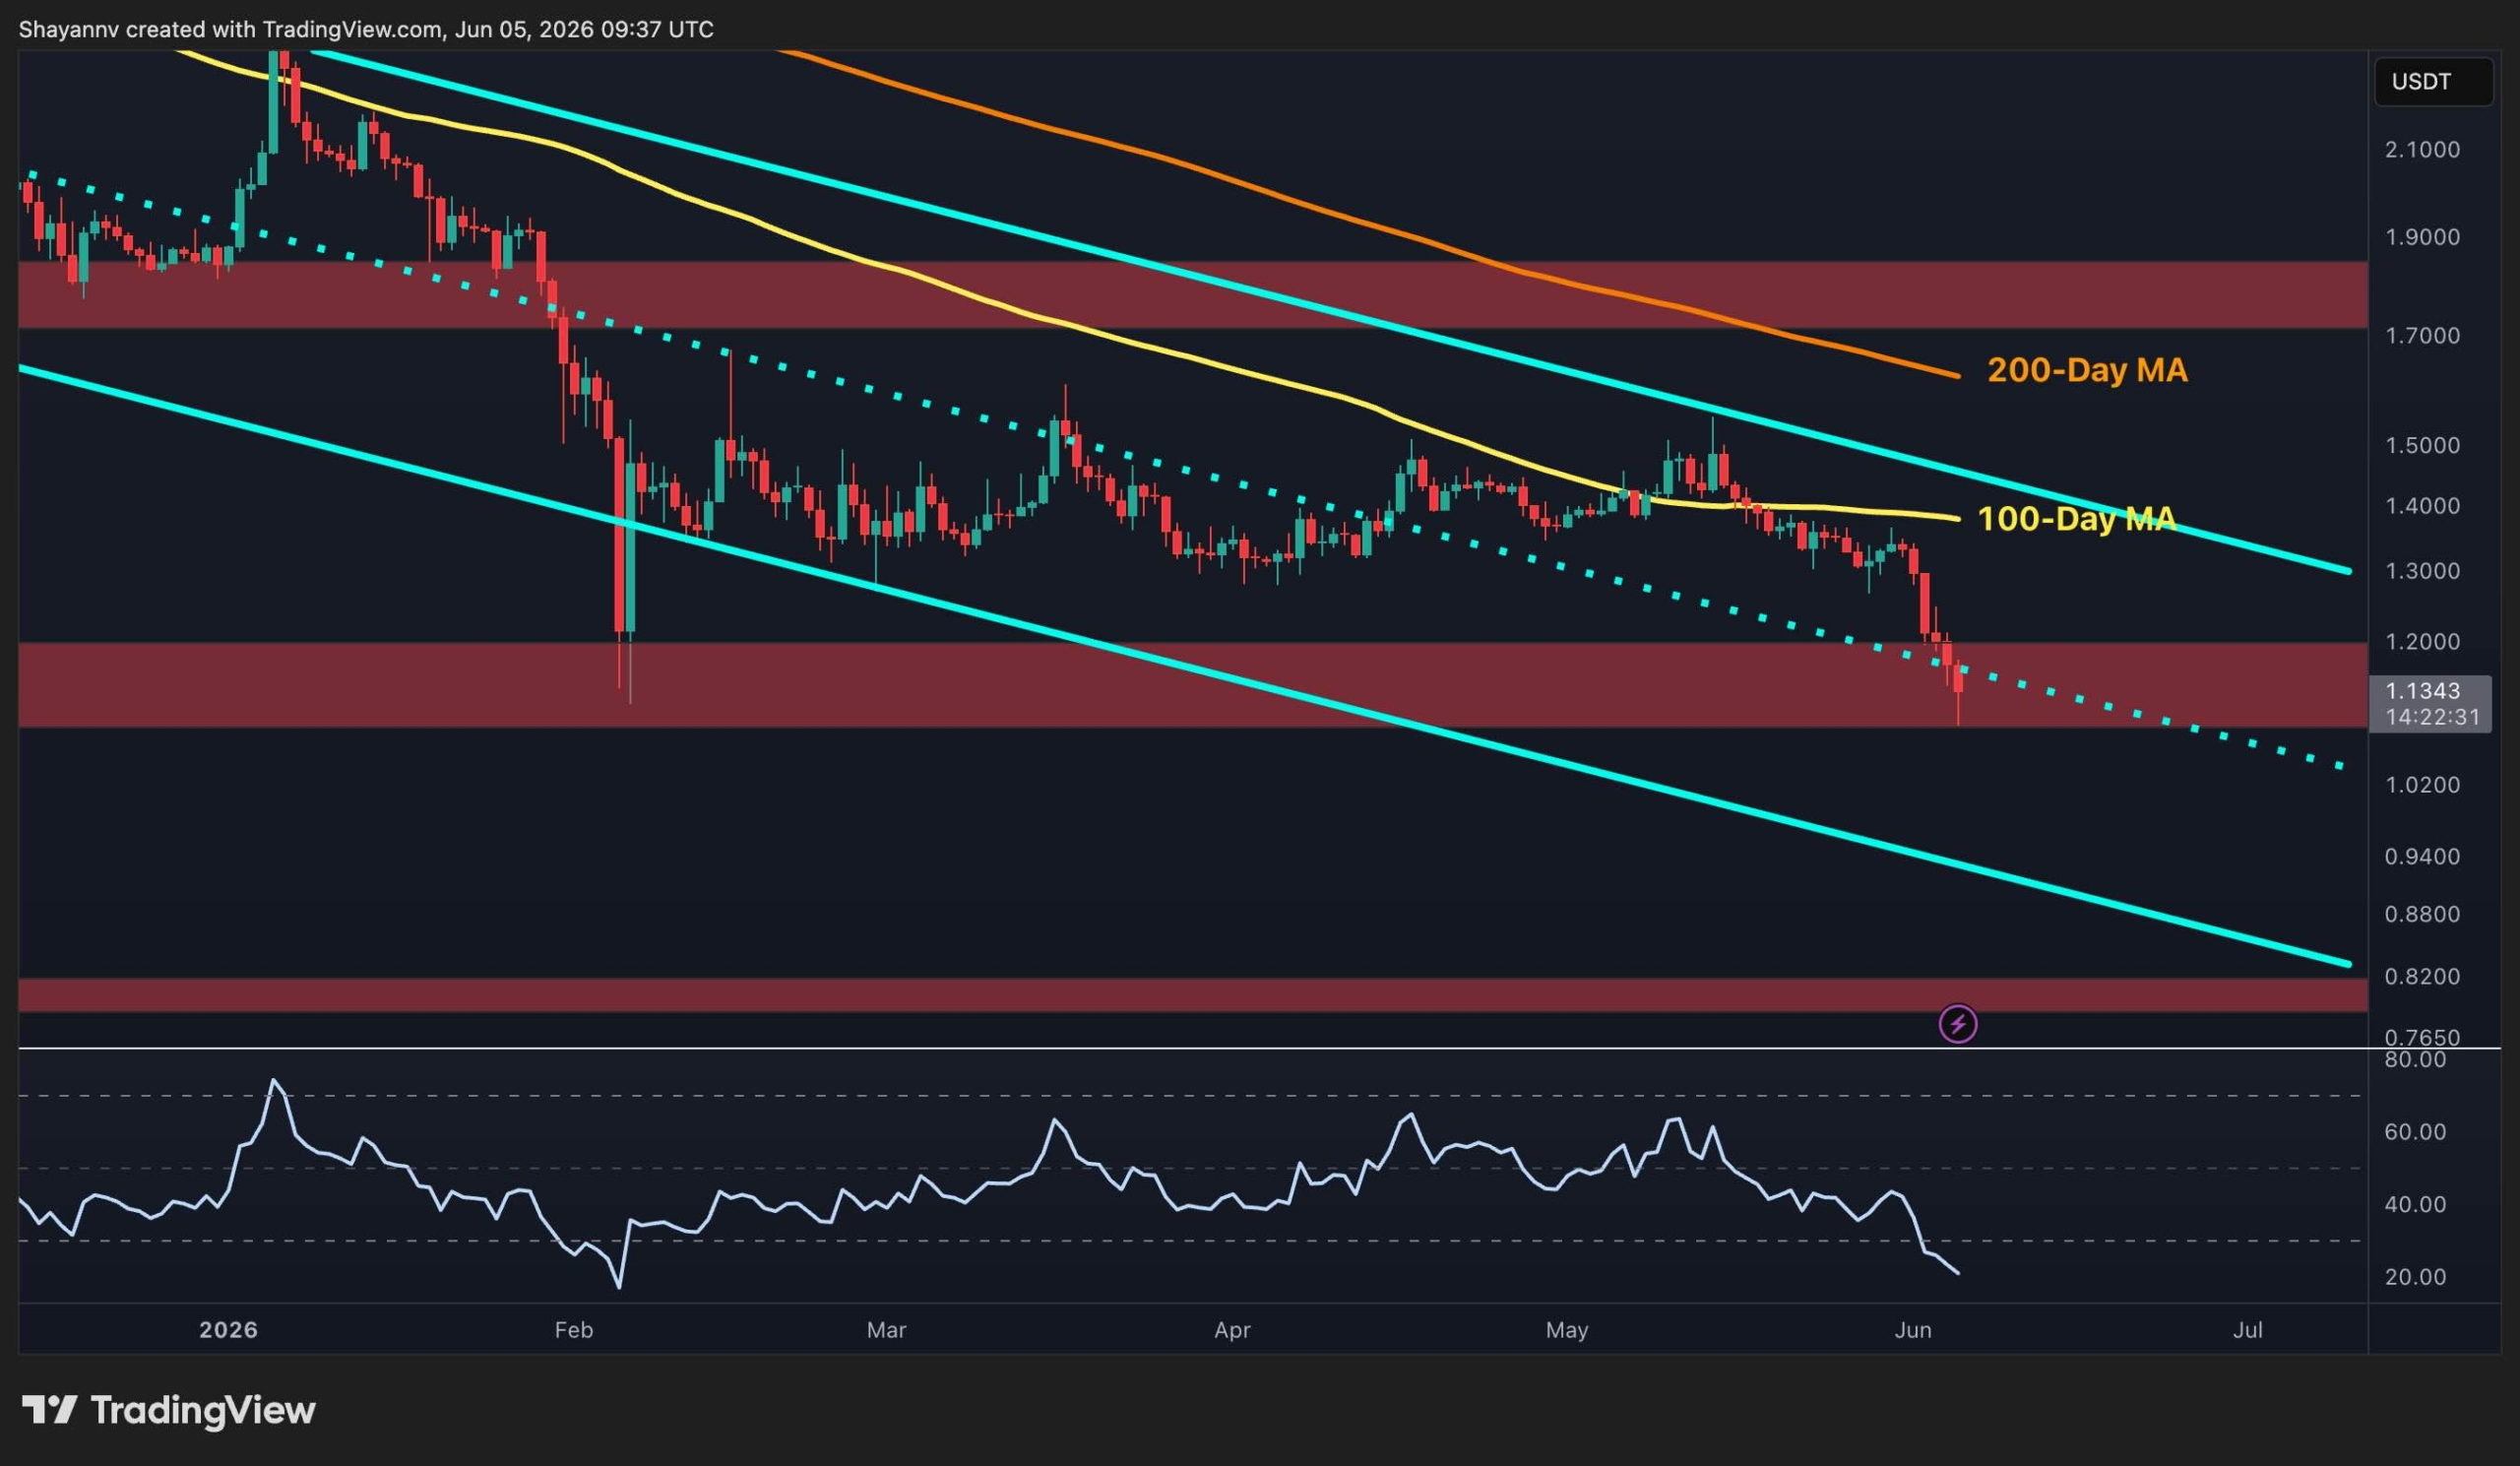
XRP has opened June with its most significant price drop in the past three months, as the critical $1.20 support level, which had acted as a firm floor for months, is now being breached. The cryptocurrency is currently trading at $1.11. The Relative Strength Index (RSI) is also registering its lowest point since the capitulation seen in February, with the next significant support level appearing to be approximately $0.30 lower. Analysts suggest this is not merely a pullback from resistance but rather a breakdown of XRP’s last line of defense.
On the USDT chart, the $1.20 support band, which proved resilient during the February market crash and had remained untouched since, is now on the verge of collapse. The RSI has similarly plummeted to around 20-25, nearing the oversold territory observed during the February capitulation low. This reading alone is noteworthy, as historically, RSI levels at this extreme have preceded at least a sharp relief bounce, even within a broader downtrend.
However, an oversold RSI does not automatically signal that a bottom has been established. The $1.20 level is now likely to transition into resistance. For the current breakdown to be considered reversed rather than merely paused, any subsequent bounce would need to reclaim this level on a sustained closing basis.
Below the current trading price, the next key structural reference point is the $0.80 demand zone. This area also aligns with the lower boundary of a descending channel, presenting a significant confluence of support, albeit at a considerably lower valuation. With the 100-day moving average at $1.35 and the 200-day moving average at $1.60 now both acting as substantial overhead resistance, the USDT-paired chart shows XRP facing considerable selling pressure above and limited structural support below.
XRP/BTC Pair Shows Greater Resilience
In contrast, the BTC pair is presenting a more robust picture. XRP/BTC is currently trading at 1,800 satoshis, holding above recent lows of 1,740 satoshis. The RSI, which had surged to 70 at the end of May, suggesting a potential shift in momentum, has since retreated to 50. This indicates that the brief period of strength has not translated into sustained buying pressure.
The price is trading below the short-term resistance of 1,850 satoshis, having been rejected at this level once again. The declining 100-day moving average, situated around 1,900 satoshis, is acting as immediate dynamic overhead resistance. The fact that the XRP/BTC ratio has held its ground while the USDT pair has weakened suggests that XRP’s dollar-denominated weakness is partly attributable to broader altcoin selling pressure rather than a specific deterioration of XRP’s standing against Bitcoin.
A confirmed close below 1,740 satoshis on the BTC pair, especially if it occurs concurrently with continued weakness in the USDT pair, would signify a definitive breakdown across both pairings. Such a scenario would expose the 1,500 satoshis area as the next significant level of support.
Leave a Reply