Author: Admin_Up

  • ‏هیاهو و زک پس از اعلام توافق صلح منفجر شدند، بیت‌کوین به اوج ۱۲ روزه رسید: رصد بازار

    ‏هیاهو و زک پس از اعلام توافق صلح منفجر شدند، بیت‌کوین به اوج ۱۲ روزه رسید: رصد بازار

    ‏بیت‌کوین به ۶۶ هزار دلار رسید؛ بازار ارزهای دیجیتال پس از اعلام توافق ایران و آمریکا جان گرفت

    پس از یک آخر هفته نسبتاً آرام، قیمت بیت‌کوین شامگاه یکشنبه برای اولین بار در حدود دو هفته گذشته به ۶۶ هزار دلار رسید. این افزایش پس از آن رخ داد که دونالد ترامپ، رئیس‌جمهور آمریکا، اعلام کرد توافق با ایران اساساً نهایی شده است.

    ارزش کل بازار ارزهای دیجیتال در طول روز بیش از ۵۰ میلیارد دلار افزایش یافته و از ۲.۳۳۰ تریلیون دلار عبور کرده است، در حالی که بسیاری از آلت‌کوین‌ها نیز رشد قابل توجهی را تجربه کرده‌اند.

    بیت‌کوین در ابتدای ماه ژوئن شاهد سقوطی شدید بود و از ۷۳ هزار دلار به پایین‌ترین سطح چند ماهه خود یعنی ۵۹,۱۰۰ دلار سقوط کرد، اما در نهایت توانست حمایتی پیدا کرده و روند بهبود تدریجی خود را آغاز کند. هفته بعد تا حدودی مثبت‌تر بود و بیت‌کوین چندین بار تا نزدیکی ۶۴ هزار دلار افزایش یافت، اما در هر تلاش برای عبور از این سطح با مقاومت روبرو شد.

    این ناکامی‌ها که عمدتاً ناشی از عوامل کلان اقتصادی مانند حملات جدید در خاورمیانه بود، منجر به افت قیمت تا ۶۱ هزار دلار شد. با این حال، این سطح حمایتی حفظ شد و بیت‌کوین به سمت مرز بالایی کانال جانبی خود بازگشت.

    آخر هفته گذشته بسیار کند بود، هرچند ترامپ روز شنبه وعده داد که آمریکا و ایران روز یکشنبه توافق دائمی را اعلام خواهند کرد، اما در همان روز حملات بیشتری از سوی اسرائیل علیه لبنان صورت گرفت. با این حال، شامگاه یکشنبه، اعلامیه مورد انتظار منتشر شد و ترامپ در پلتفرم Truth Social اعلام کرد که توافق اساساً نهایی شده است.

    بیت‌کوین بلافاصله با افزایش قیمت واکنش نشان داد و صبح امروز برای اولین بار از سوم ژوئن به ۶۶ هزار دلار رسید. از آن زمان تاکنون چند صد دلار از ارزش خود را از دست داده است، اما همچنان ۲ درصد در روز افزایش داشته است. ارزش بازار آن به ۱.۳۱۵ تریلیون دلار رسیده و تسلط آن بر آلت‌کوین‌ها همچنان بالای ۵۶.۵ درصد است.

    رشد آلت‌کوین‌ها

    بیشتر آلت‌کوین‌های با سرمایه بالا امروز در محدوده سبز قرار دارند. اتریوم پس از افزایش ۲.۵ درصدی، سطح ۱,۷۰۰ دلار را دوباره به دست آورد. BNB نزدیک به ۶۲۰ دلار است، در حالی که XRP از ۱.۱۸ دلار فراتر رفته است. SOL به خوبی بالای ۷۰ دلار قرار دارد و ADA با ۶ درصد افزایش مواجه شده است.

    HYPE تقریباً ۱۰ درصد افزایش یافته و ZEC بیشترین رشد را در میان ۱۰۰ آلت‌کوین برتر داشته است. این کوین حریم خصوصی ۱۶ درصد افزایش یافته و نزدیک به ۵۰۰ دلار معامله می‌شود. WLD نیز با افزایش ۱۵ درصدی به ۰.۵۹ دلار رسیده است. NEAR و JUP نیز به جمع دارندگان سود دو رقمی پیوسته‌اند.

    ارزش کل بازار تمام دارایی‌های رمزارزی در حال حاضر بیش از ۵۰ میلیارد دلار در طول روز افزایش یافته و به ۲.۳۳۰ تریلیون دلار رسیده است.

  • ‏رشد ریپل (XRP) امروز: دلایل و چشم‌انداز آینده

    ‏رشد ریپل (XRP) امروز: دلایل و چشم‌انداز آینده

    ‏بازار ارزهای دیجیتال از زمان اعلامیه مهم دونالد ترامپ، رئیس‌جمهور آمریکا، در شامگاه یکشنبه، سبز شده است، اما برخی دارایی‌ها نسبت به سایرین افزایش قابل توجه‌تری را تجربه کرده‌اند.

    ریپل (XRP) در صدر افزایش‌ها

    توکن پرداخت برون‌مرزی ریپل (XRP) در میان این دارایی‌ها قرار دارد و در مقیاس روزانه بیش از ۳ درصد افزایش ارزش داشته است که بیشتر از افزایش ۲.۵ درصدی اتریوم (ETH) و جهش ۱.۹ درصدی بیت‌کوین (BTC) است.

    دلایل افزایش قیمت XRP

    دلیل آشکارتر احیای XRP در امروز، اعلام توافق توسط ترامپ در روز گذشته است. همانطور که گزارش شده است، رئیس‌جمهور آمریکا همچنین مجوز بازگشایی بدون عوارض تنگه هرمز و برداشته شدن محاصره دریایی ایالات متحده را صادر کرده است. انتظار می‌رود این توافقنامه تا پایان هفته امضا شود، زیرا گزارش‌ها از پاکستان و هند با اظهارات ترامپ همسو بوده‌اند. اخبار صلح همواره در بازارهای پرریسک ارزهای دیجیتال، به ویژه برای آلت‌کوین‌های بزرگ، مورد استقبال قرار می‌گیرد.

    عوامل پنهان در افزایش XRP

    با این حال، ممکن است دلایل بیشتری در پس افزایش‌های خاص XRP وجود داشته باشد. برای شروع، صندوق‌های قابل معامله در بورس (ETF) که عملکرد آن را دنبال می‌کنند، همچنان برخلاف روند کلی ETFها عمل می‌کنند. این صندوق‌ها بیش از ۱۰ میلیون دلار در هفته کاری گذشته جذب کرده‌اند که در تضاد کامل با خروج خالص ۱۵ میلیون دلاری از ETFهای ETH و بیش از ۳۰۰ میلیون دلار خروجی از صندوق‌های بیت‌کوین است.

    تغییر روند در کره جنوبی

    به طور جداگانه، گزارشی از CryptoQuant نشان‌دهنده تغییر روند نسبتاً شگفت‌انگیزی بود. بزرگترین صرافی ارز دیجیتال کره جنوبی، Upbit، به پلتفرم معاملاتی با بالاترین تمرکز فعالیت کیف پول واریز XRP تبدیل شده است. تحلیلگران CQ تشخیص دادند که “بازگشت XRP توسط ساختار جریان تقسیم‌شده هدایت می‌شود.”

    پیش‌بینی تحلیلگران

    علی مارتینز، تحلیلگر محبوب، اخیراً خاطرنشان کرد که شاخص TD Sequential پس از بازیابی دارایی به بالای ۱.۱۰ دلار، سیگنال خرید را برای XRP نشان داده است. او در پستی بعدی افزود که شکستن مثلث متقارن فعلی دارایی می‌تواند منجر به حرکت ۱۴ درصدی دیگر شود. تحلیلگر دیگر، CW، دو خط مقاومت مهم بعدی را در صورت ادامه روند صعودی توکن ترسیم کرد. اولین مورد، دیوار فروش در ۱.۲۵ دلار و سپس ۱.۴۰ دلار است که در آنجا تجمع قابل توجهی از موقعیت‌های فروش کوتاه وجود دارد.

    هشدار CRYPTOWZRD

    CRYPTOWZRD هشدار داد که XRP علی‌رغم روند صعودی اواخر یکشنبه، به طور نامشخصی بسته شده است. بر اساس تحلیل آن‌ها، XRP باید سطح ۱.۱۸ دلار را به طور قاطع بازپس گیرد تا بتواند رشد بیشتری را ارائه دهد. شایان ذکر است که توکن پرداخت برون‌مرزی در حال حاضر در حال آزمایش این سطح است.

    [تصویر نمودار فنی روزانه XRP با متن: XRP به طور نامشخصی بسته شد و نمودار درون‌روزی آن در یک محدوده معامله می‌شود. بالای ۱.۱۸۰۰ دلار، موقعیت خرید ارائه می‌دهد، اما رد شدن در این مقاومت، موقعیت فروش را ارائه می‌دهد. حرکت زیر ۱.۱۰۰۰ دلار، کاهش بیشتری را ارائه می‌دهد.]
    — CRYPTOWZRD (@cryptoWZRD_) June 15, 2026

  • Crypto Markets: 3 Key Movers This Week

    Crypto Markets: 3 Key Movers This Week

    Markets Brace for Key Economic Data and Fed Decision Amid Peace Deal Hopes

    Cryptocurrency markets saw modest gains over the weekend and continued their upward trend on Monday, raising questions about the sustainability of this momentum throughout the week.

    Meanwhile, a significant peace deal involving Iran has been announced, with Pakistan confirming the agreement, U.S. leaders and Iranian media endorsing it, and Qatar offering its backing, according to The Kobeissi Letter. This development coincides with U.S. stock futures trading in positive territory and a notable decline in oil prices. The question on many minds is whether this week will finally see a definitive resolution to the ongoing tensions.

    President Trump announced on Truth Social late Sunday, “The deal with the Islamic Republic of Iran is now complete. Congratulations to all!” He further stated, “I hereby fully authorize the toll-free opening of the Strait of Hormuz, and, simultaneously herewith, authorize the immediate removal of the United States Naval blockade.”

    In response to these developments, oil prices have plummeted to their lowest levels since before the conflict began. West Texas Intermediate (WTI) crude dropped 4% to $80 per barrel, while Brent Crude fell 3.4% to $84 per barrel.

    The economic calendar for the week ahead is packed with significant data releases. Monday will feature May’s Industrial Production figures, followed by May Housing Starts on Tuesday. Wednesday is set to release the month’s Retail Sales report.

    However, all eyes will be on the Federal Reserve’s interest rate decision and Kevin Warsh’s inaugural meeting as Fed Chair on Wednesday. Economists remain divided on how Warsh will navigate interest-rate policy.

    “It all puts Warsh in a difficult position,” Joseph Brusuelas, chief economist at RSM, commented to MarketWatch. “He campaigned for the job with a promise of rate cuts, which the executive branch has called for. But the recent rise in prices and the broadening out of inflation make any rate cuts difficult. It’s this quandary that will define the start of the Warsh era at the Fed.”

    Key Events This Week:

    • Monday: May Industrial Production data
    • Tuesday: May Housing Starts data
    • Wednesday: May Retail Sales data
    • Wednesday: Fed Interest Rate Decision and Kevin Warsh’s First Meeting as Fed Chair
    • Thursday: June Philly Fed Manufacturing Index

    According to the CME Fed Watch tool, there is currently a 96.6% probability that interest rates will remain unchanged this week. Thursday will also see the release of June’s Philly Fed Manufacturing Index, while U.S. markets will be closed on Friday for the Juneteenth federal holiday.

    Digital assets are experiencing a rare green Monday in Asia, with markets collectively gaining 1.3% following the news of the Middle East peace deal.

    Bitcoin has climbed 1.6% to reclaim the $65,500 mark, its highest level in 11 days. The cryptocurrency faces resistance just above $67,000, which will be the next target for sustained upward momentum.

    Ether has seen a 2.3% increase but remains relatively weak, trading just above $1,700. The psychological barrier of $2,000 represents a significant hurdle for the asset to overcome. Altcoins have largely followed the positive trend, with notable gains observed in Hyperliquid, Zcash, and Cardano.

  • DOGECOIN REBOUNDS: Bigger Gains Ahead?

    DOGECOIN REBOUNDS: Bigger Gains Ahead?

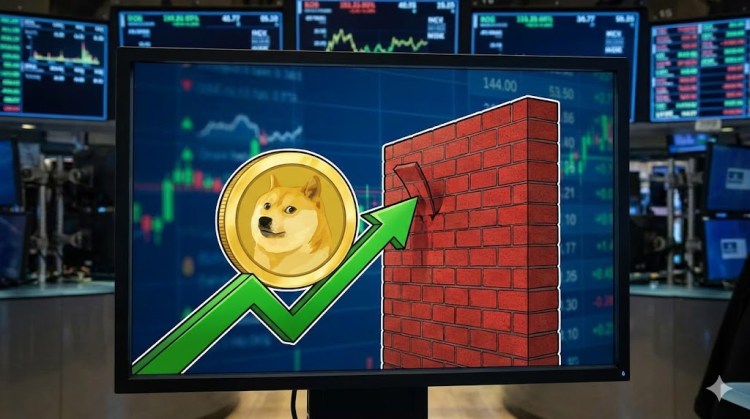
    Dogecoin Sees Renewed Momentum, Eyes Potential Rally Above $0.09

    Dogecoin (DOGE) has initiated a fresh upward movement from the $0.0850 zone against the US Dollar, with current indicators suggesting potential for a larger rally. The cryptocurrency is now encountering resistance near the $0.090 mark.

    Dogecoin Price Analysis

    DOGE has staged a notable ascent, surpassing the $0.0850 and $0.0880 resistance levels. The digital asset is currently trading above the $0.0870 level and its 100-hourly simple moving average. A bullish trend line, with support identified at $0.0870 on the hourly chart of the DOGE/USD pair, is also forming. Analysts suggest that the price could continue its upward trajectory if it maintains its position above $0.0850.

    The cryptocurrency’s price found solid footing above the $0.0850 zone, mirroring recent gains seen in Bitcoin and Ethereum. DOGE’s advance saw it break through the $0.0865 and $0.0870 resistance points, posting gains of over 2% and testing the $0.0890 area. This surge also saw the price move beyond the 38.2% Fibonacci retracement level of the recent decline from a swing high of $0.0920 to a low of $0.0855.

    Upside Potential and Hurdles

    With Dogecoin trading above the $0.0870 level and the 100-hourly SMA, sustained bullish activity could prompt further increases. Immediate upside resistance is situated around the $0.0890 level and the 50% Fibonacci retracement mark of the aforementioned downward move. The first significant hurdle for bulls is anticipated near the $0.0905 level, followed by major resistance at $0.0920. A decisive close above $0.0920 could propel DOGE towards the $0.0950 resistance, with further gains potentially targeting the $0.10 level. The next key target for optimistic traders could be $0.1050.

    Potential for Decline

    Conversely, if Dogecoin’s price falters to break above the $0.090 threshold, a downward correction could ensue. Initial support on the downside is observed at the $0.0870 level, with the next significant support located at $0.0855. The primary support zone remains at $0.0850. A breach below this $0.0850 support could trigger further declines, potentially pushing the price towards the $0.0820 level or even $0.080 in the short term.

    Technical Indicators

    The hourly MACD for DOGE/USD is currently showing a loss of momentum within the bullish zone. The hourly RSI for DOGE/USD is positioned above the 50 level.

    Major Support Levels: $0.0870, $0.0855
    Major Resistance Levels: $0.090, $0.10

  • XRP Poised for Significant Upside Surge

    XRP Poised for Significant Upside Surge

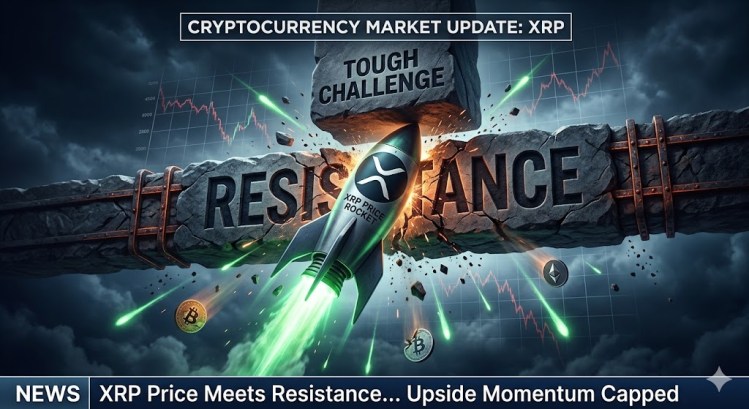
    XRP Price Eyes Further Gains Above $1.20 as Momentum Builds

    XRP has begun a steady ascent, surpassing the $1.1650 mark. The cryptocurrency is currently consolidating its gains and appears poised for further upward movement, potentially targeting levels above $1.20.

    XRP Price Aims for Fresh Increase

    Following a pattern seen in Bitcoin and Ethereum, XRP initiated a fresh upward trajectory, breaking through the $1.1450 and $1.150 thresholds. The digital asset then accelerated, achieving a decisive move above the $1.1680 resistance level. Bulls pushed the price towards the $1.1880 zone, establishing a high of $1.1926. XRP has since entered a consolidation phase, trading above the 23.6% Fibonacci retracement level of its recent climb from a swing low of $1.0879 to the $1.1926 peak.

    Currently, XRP is trading above $1.180 and the 100-hourly Simple Moving Average. A bullish trend line has formed on the hourly chart of the XRP/USD pair, with support identified at $0.140. Should XRP experience another upward surge, it may encounter resistance near the $1.1920 level. The first significant resistance lies around $1.1950, a break above which could propel the price to test the $1.20 zone. A clear breach of the $1.20 resistance could see XRP advance towards the $1.2150 resistance, with further gains potentially pushing it towards $1.2220. The next major hurdle for buyers is anticipated near $1.2250.

    Downside Correction?

    Conversely, if XRP fails to overcome the $1.20 resistance zone, a fresh decline could be initiated. Initial support on the downside is observed near the $1.1680 level. The subsequent major support is situated around $1.1550. A downside break and a close below $1.1550 could lead to a continued decline towards $1.1400, the trend line, and the 50% Fibonacci retracement level of the move from $1.0879 to $1.1926. Further down, the next significant support is located near the $1.1280 zone, below which the price could extend its losses towards $1.1120. The primary support level is seen at $1.080.

    Technical Indicators

    • Hourly MACD: The MACD for XRP/USD is currently gaining momentum in the bullish territory.
    • Hourly RSI (Relative Strength Index): The RSI for XRP/USD is trading above the 50 level.

    Major Support Levels: $1.1680 and $1.1400
    Major Resistance Levels: $1.1920 and $1.2000

  • SpaceX IPO: Ripple’s XRP Price Outlook

    SpaceX IPO: Ripple’s XRP Price Outlook

    SpaceX’s historic IPO, the largest in history, has debuted on Wall Street with a staggering $1.77 trillion valuation, having raised $75 billion. The offering also proved to be a significant draw for retail investors, attracting over $100 billion in orders. This monumental financial event prompts the question of how it might impact popular altcoins, particularly those favored by retail investors.

    Impact on XRP

    When considering XRP, the connection to this massive financial event is more complex than with Bitcoin, according to ChatGPT. The AI suggests the outlook may be less optimistic than some investors anticipate. While SpaceX has publicly acknowledged a substantial Bitcoin exposure, there is no clear indication that it holds XRP, utilizes the XRP Ledger, or plans to integrate Ripple’s payment technology.

    Consequently, XRP’s price trajectory is expected to be more influenced by broader market dynamics than by SpaceX’s IPO or stock performance. ChatGPT warns that the short-term outlook for Ripple’s token is leaning bearish, as such a large listing can drain liquidity from speculative markets, especially when retail investors are heavily involved.

    “XRP remains a high-beta crypto asset,” the AI noted, “and when traders require cash to participate in a massive IPO, altcoins are often among the first positions to be reduced.”

    Gemini echoed this sentiment, identifying a “liquidity vacuum” as an immediate threat to the cross-border token. The exchange added that even XRP’s dedicated retail community faces a challenge when a “generational tech narrative like SpaceX emerges.”

    Long-Term Potential

    However, Gemini also pointed to a potential long-term benefit for XRP, drawing a parallel to Bitcoin’s narrative. The “wealth effect” generated by the IPO could prove highly advantageous for XRP in the long run. As the initial excitement and capital raise of $75 billion subside, a significant amount of new wealth will have been generated for early private investors. This capital often flows “down the risk curve,” potentially benefiting high-cap altcoins that can offer “asymmetric returns.”

    ChatGPT also highlighted a positive aspect, stating the IPO is not “purely negative” for XRP. If SpaceX’s stock performs strongly and the broader market enters a risk-on phase, XRP could see gains alongside other large-cap cryptocurrencies.

    XRP’s Independent Bull Case

    Beyond the SpaceX IPO, XRP possesses its own independent bullish case. The company behind XRP is actively expanding its presence in payments, stablecoins, tokenization, and institutional infrastructure.

    “If the market begins rewarding real-world utility again,” the analysis suggests, “XRP could still outperform many speculative tokens, even if it is not directly linked to SpaceX.”

  • XRP Funds Outperform Crypto ETF Downtrend

    XRP Funds Outperform Crypto ETF Downtrend

    XRP Funds Outperform Crypto ETF Market Amidst Broader Downturn

    In a market where most cryptocurrency exchange-traded funds are experiencing significant losses, spot XRP funds have consistently bucked the trend, attracting substantial new capital. This resilience stands in contrast to the underlying asset, XRP, which continues to trade below key support levels, though it has managed to remain above the crucial $1.00 psychological mark.

    Data compiled by SoSoValue reveals that XRP-tracking financial vehicles saw inflows of $7.44 million on Tuesday, followed by $1.19 million on Wednesday and $2.04 million on Friday. While Monday and Thursday registered no reported flows, the week concluded with over $10 million in net inflows. Notably, not a single day saw outflows, extending a positive streak that began on June 3, when the funds experienced a net outflow of $5.34 million.

    Consequently, cumulative net inflows for spot XRP ETFs have reached an all-time high exceeding $1.44 billion. While these figures do not match the peak enthusiasm seen following the funds’ launch last November, they represent a significant achievement in a challenging environment for other ETFs.

    In stark contrast, spot Bitcoin ETFs have endured a five-week losing streak, with investors withdrawing $315 million in the past week alone. Ethereum funds have faced a similar situation, with nearly $15 million pulled out despite a strong Monday performance. Even Solana ETFs have been in negative territory for two consecutive weeks.

    While spot HYPE funds have maintained a positive inflow streak, their $5.87 million in net inflows this past week fell short of XRP’s performance.

    Ripple’s native token, XRP, experienced a sharp decline to $1.05 on June 4-5 during a broader market crash. It came perilously close to falling below $1.00 for the first time in nearly two years but managed to hold the level. As of press time, XRP has recovered to $1.15.

    However, analysts remain cautious about the token’s immediate future. Ali Martinez recently projected potential price bottoms for Bitcoin, Ethereum, and XRP, suggesting that XRP could fall to a new low between $0.70 and $0.90.

    Despite these bearish forecasts, such a potential dip could present a significant buying opportunity. Both Martinez and EGRAG CRYPTO anticipate a substantial rebound, with projections pointing towards new peaks of $7.00-$8.00 or even higher.

  • Crypto Giants Face Setback Amid Trump’s Condemnation of Israel’s Actions

    Crypto Giants Face Setback Amid Trump’s Condemnation of Israel’s Actions

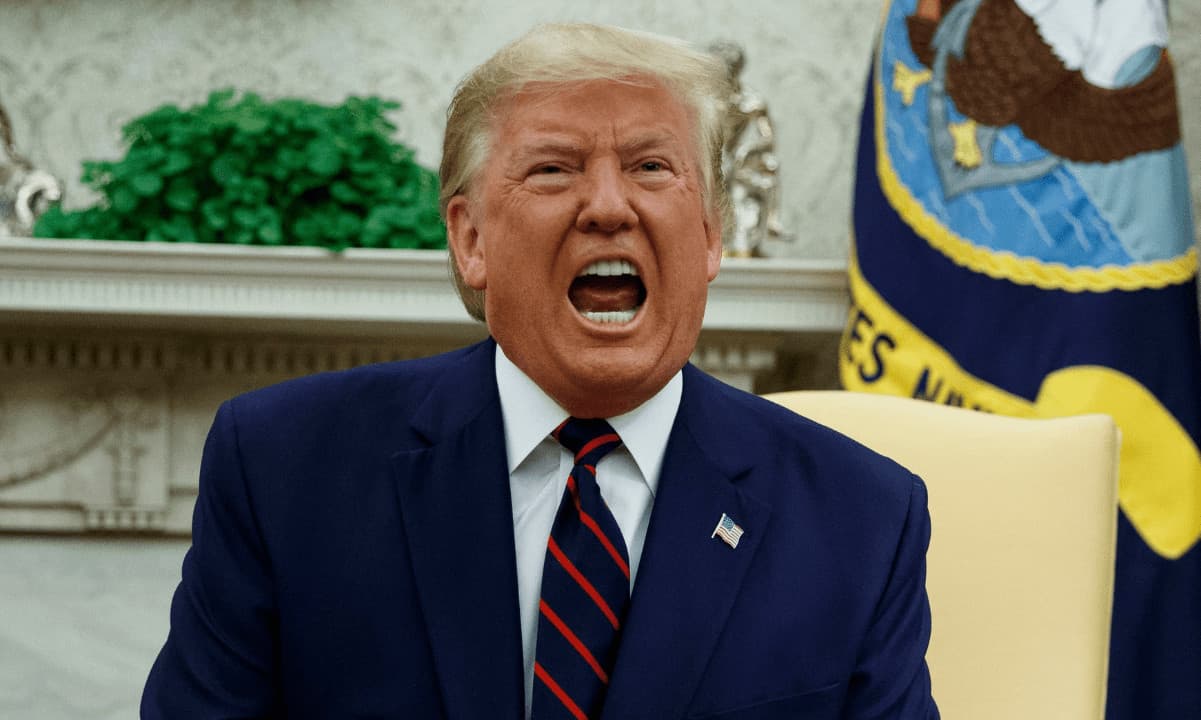
    Trump Criticizes Israeli Attacks, Citing Iran Deal Hopes

    U.S. President Donald Trump issued sharp criticism of Israel’s latest actions, which occurred on the same day he had anticipated the announcement of a permanent deal with Iran.

    The Israeli government, led by Benjamin Netanyahu, conducted a new series of strikes on Beirut’s southern suburbs earlier today. These actions could potentially jeopardize the Iran deal, which was already considered precarious.

    “This morning’s attack on Beirut should not have happened, particularly on a special day when we are so close to a Peace Deal with Iran,” Trump stated in a message on Truth Social. “Israel has the right to defend itself against threats, but the attack it was responding to was very small and meaningless, nobody was hurt, injured, or killed, and should not disrupt this important process.”

    Lebanon’s civil defense reported at least three fatalities and seven injuries resulting from the attacks, according to Al Jazeera.

    Trump reiterated his previous day’s assertion that the United States and Iran were expected to announce a deal later today, a prospect that had already been met with skepticism by some Iranian authorities.

    In his latest post, he also called for de-escalation from all parties, including Israel and Hezbollah, suggesting this could usher in “the beginning of a long and beautiful peace.”

    Cryptocurrency Markets React to Geopolitical Developments

    Major cryptocurrencies experienced modest gains over the preceding day, potentially fueled by optimism surrounding the anticipated permanent peace deal and the expected opening of the Strait of Hormuz. However, the recent Israeli attacks and Trump’s subsequent condemnation have stalled this progress.

    Bitcoin (BTC) fell below $64,000 in recent minutes, after reaching a high of $64,800 earlier today. Ethereum (ETH) is down more than 1%, while XRP has declined by 2% to $1.13, following another rejection at the $1.15 mark.

    With the trading day not yet concluded, further volatility is anticipated later today or, more likely, tomorrow morning with the opening of futures and traditional markets. President Trump is also scheduled to travel to France for a G7 meeting.

  • XRP Shows Seller Exhaustion, Eyes Recovery

    XRP Shows Seller Exhaustion, Eyes Recovery

    XRP Shows Signs of Seller Exhaustion, Poised for Potential Recovery

    XRP is currently trading near a critical support level, exhibiting early indications of stabilization. While the broader market trend remains under pressure, recent price movements and momentum indicators suggest that selling pressure may be waning, opening the door for a more substantial recovery in the near future.

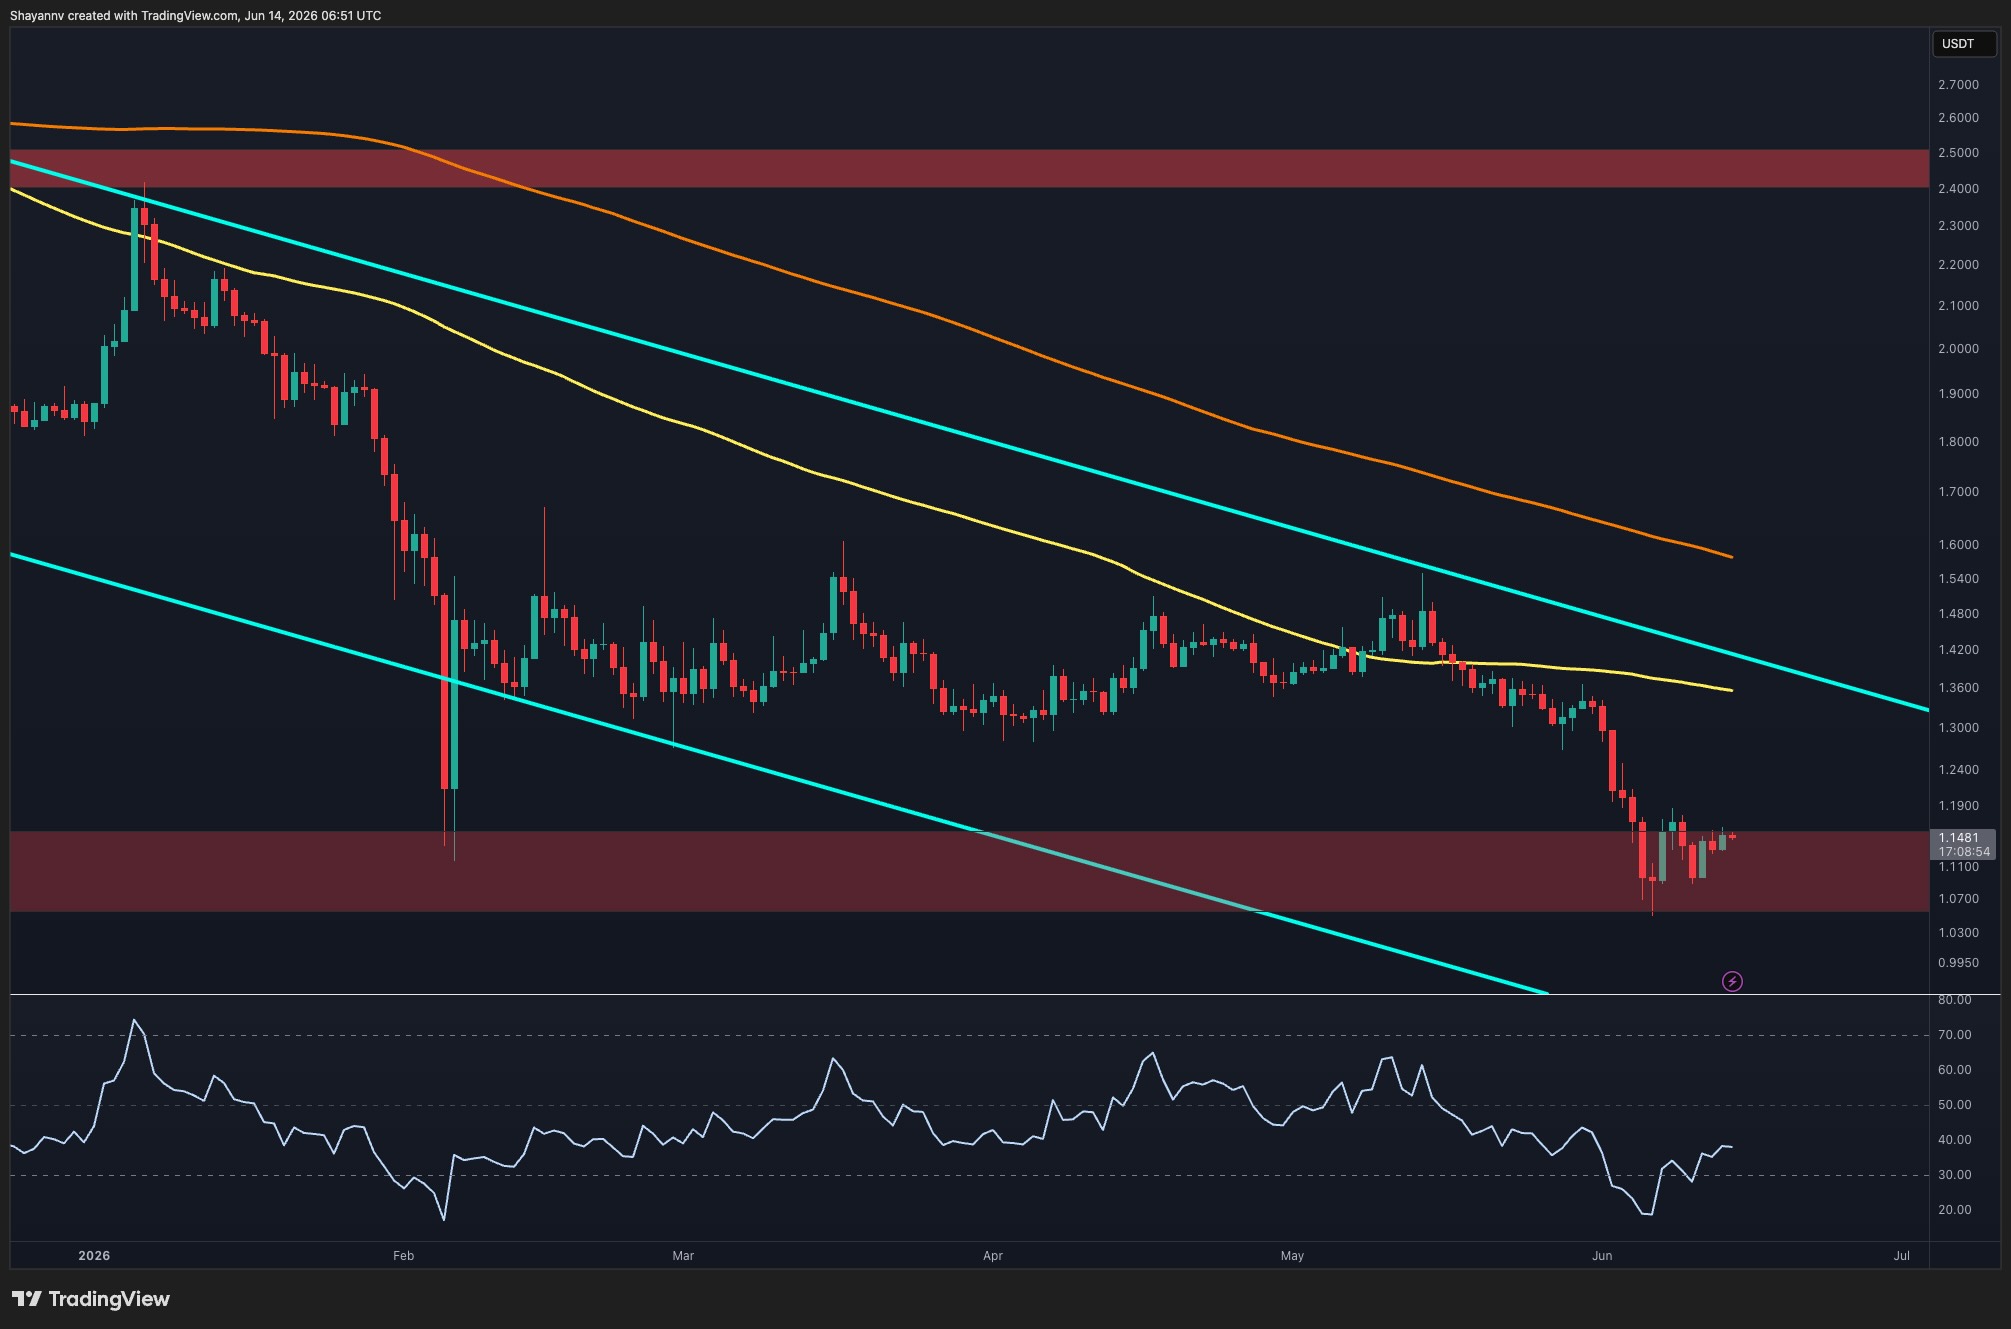
    On the daily chart, XRP has consolidated above a key support zone situated between $1.05 and $1.15. This consolidation follows the asset finding demand near the lower boundary of its descending channel.

    A significant development has been the emergence of bullish divergence between XRP’s price and the Relative Strength Index (RSI). As XRP revisited the $1.05 support area, the RSI registered a higher low. This suggests a weakening of downward momentum, even as the price remained near its recent lows. Such divergences are often observed at potential turning points and can signal a fading of selling pressure.

    For bullish investors, the immediate hurdle remains the resistance presented by the descending channel, which currently aligns with a cluster of moving averages between $1.35 and $1.55. A sustained move into this region would likely improve market sentiment and could indicate a broader trend reversal. Until then, XRP is considered to be in a corrective phase within its prevailing downtrend.

    Short-Term Momentum Builds

    The 4-hour chart reveals XRP gradually constructing a recovery pattern from the $1.05 support zone. The asset has been charting higher lows while respecting an ascending trendline, pointing to improving short-term momentum.

    Immediate resistance is observed in the $1.18 to $1.21 range, which corresponds with the 0.5 Fibonacci retracement level. A successful breach of this resistance could pave the way for XRP to advance towards the 0.618 Fibonacci retracement level at $1.25.

    Beyond this, the primary resistance area lies between $1.27 and $1.30, encompassing the 0.702 and 0.786 Fibonacci levels. This zone previously served as significant support and could now act as a formidable barrier to the ongoing recovery.

    As long as XRP maintains its position above the rising trendline and the $1.05 support zone, the short-term outlook favors continued upward attempts. However, a decisive reclamation of the $1.21 to $1.30 region is necessary to confirm a broader bullish reversal. The daily RSI divergence lends credence to this recovery scenario, indicating a gradual shift in momentum towards buyers.

  • Tether Briefly Surpasses Ethereum by Market Cap

    Tether Briefly Surpasses Ethereum by Market Cap

    Tether’s USDT Briefly Surpasses Ethereum in Market Capitalization

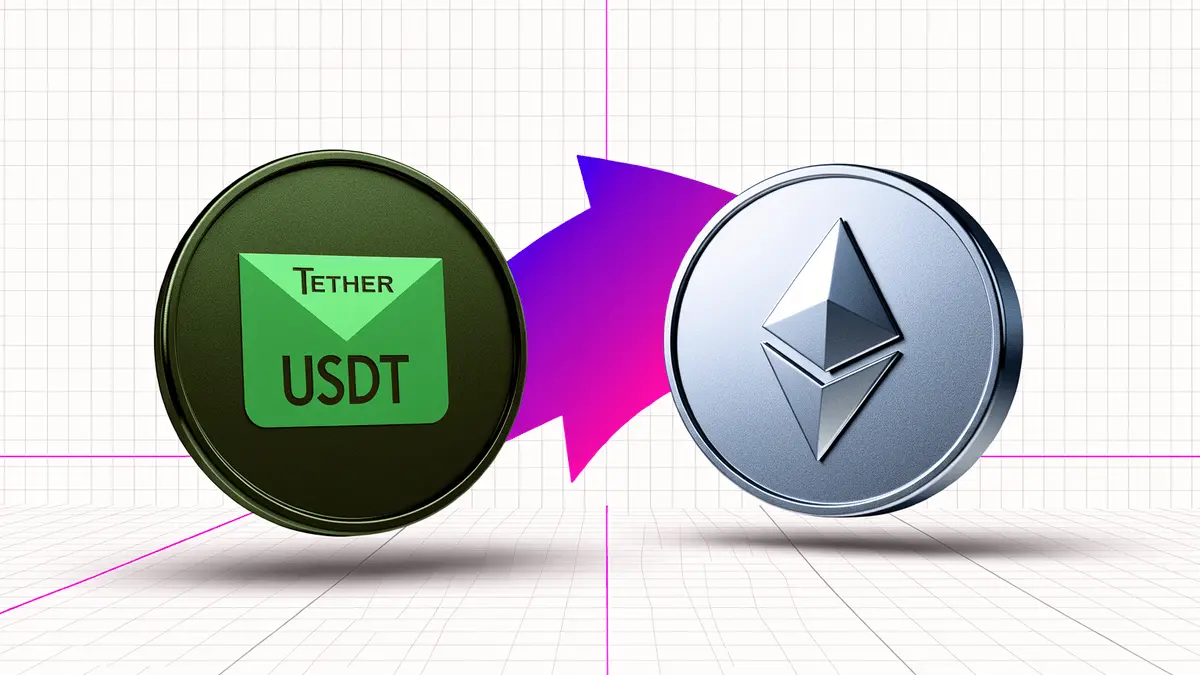
    For a few hours earlier this week, Tether’s USDT stablecoin briefly held a higher market capitalization than Ethereum, marking the first such occurrence in eight years. Data from multiple tracking platforms indicated that both assets were valued within the $183 billion to $188 billion range during this crossover period. One snapshot showed USDT at $187 billion against Ethereum’s $186 billion, a difference of less than $1 billion.

    The shift was short-lived, with Ethereum reclaiming its second-place position once its price stabilized. The underlying factors that led to the crossover – a steady expansion of USDT’s supply coupled with sustained weakness in ETH’s price – did not disappear with the reversal in rankings.

    This was not a supply shock on Ethereum’s part. What compressed ETH’s market cap was its price, while USDT’s expansion was driven by new issuances. Tether’s own fourth-quarter 2025 attestation revealed USDT at a record $187.3 billion, having added $12.4 billion in a single quarter even as the broader cryptocurrency market experienced significant downturns.

    By early 2026, USDT’s market cap had surged from $144.2 billion to $184 billion over twelve months, representing 28% growth. Concurrently, Ethereum’s dollar valuation moved in the opposite direction.

    In the three weeks leading up to the crossover, more than $7 billion exited the stablecoin sector, while the total cryptocurrency market cap shed $400 billion. Ethereum’s total value locked (TVL) in decentralized finance (DeFi) fell to approximately $36 billion. This movement suggests traders were not abandoning stablecoins but rather parking liquidity while divesting from more volatile assets.

    USDT currently holds a 59% share of the total stablecoin market, with USDT and USDC combined accounting for 82%. This indicates Tether’s significant influence within this market dynamic.

    Analyst Sees Potential for Further Stablecoin Dominance

    Mike McGlone, a senior commodity strategist at Bloomberg Intelligence, has been observing this trend for an extended period. In October 2020, McGlone noted that USDT, then valued at $16 billion against Ethereum’s $43 billion, was “on pace to match the market capitalization of Ethereum in a bit less than a year.” He described this as part of an “inexorable trend” toward stablecoins gaining mainstream traction.

    McGlone’s updated analysis suggests a more ambitious trajectory. He anticipates “the flippening to continue,” with Tether’s market cap surpassing Ethereum in 2026 and “eventually Bitcoin.” In an extreme scenario he outlines, if Bitcoin were to fall to $10,000, USDT, which would need to grow sevenfold from its current levels, could potentially challenge Bitcoin for the top spot.

    While this extreme scenario is not endorsed, dismissing it entirely due to its perceived extremity could lead to overlooking significant market shifts, similar to how the USDT-Ethereum crossover was initially underestimated.

    Outlook for Second Place Remains Uncertain

    As of the latest data, Ethereum has regained its second position in market capitalization rankings, but the margin is not substantial. For Ethereum to secure its second-place standing, it would require a sustained and meaningful price recovery, or Tether USDT’s issuance would need to plateau.

    Neither outcome is guaranteed. While structural advancements in Ethereum’s technology stack, including developments in ZK-proof scaling, offer a long-term bullish counterpoint, these catalysts operate on a different timeline than the near-term price weakness that facilitated the recent crossover.

    Tether’s supply trajectory shows no immediate signs of slowing. The stablecoin added $12.4 billion in a single quarter during a market downturn. In a neutral or risk-on environment, this pace could accelerate. Given that USDT maintains a $1 peg, its market capitalization is directly tied to its circulating supply. Consequently, every newly minted USDT represents a direct increment to its market cap, unaffected by the price volatility that influences Ethereum’s ranking.