Author: Admin_Up

  • XRP Liquidity on Exchanges Hits Lowest Point Since 2020

    XRP Liquidity on Exchanges Hits Lowest Point Since 2020

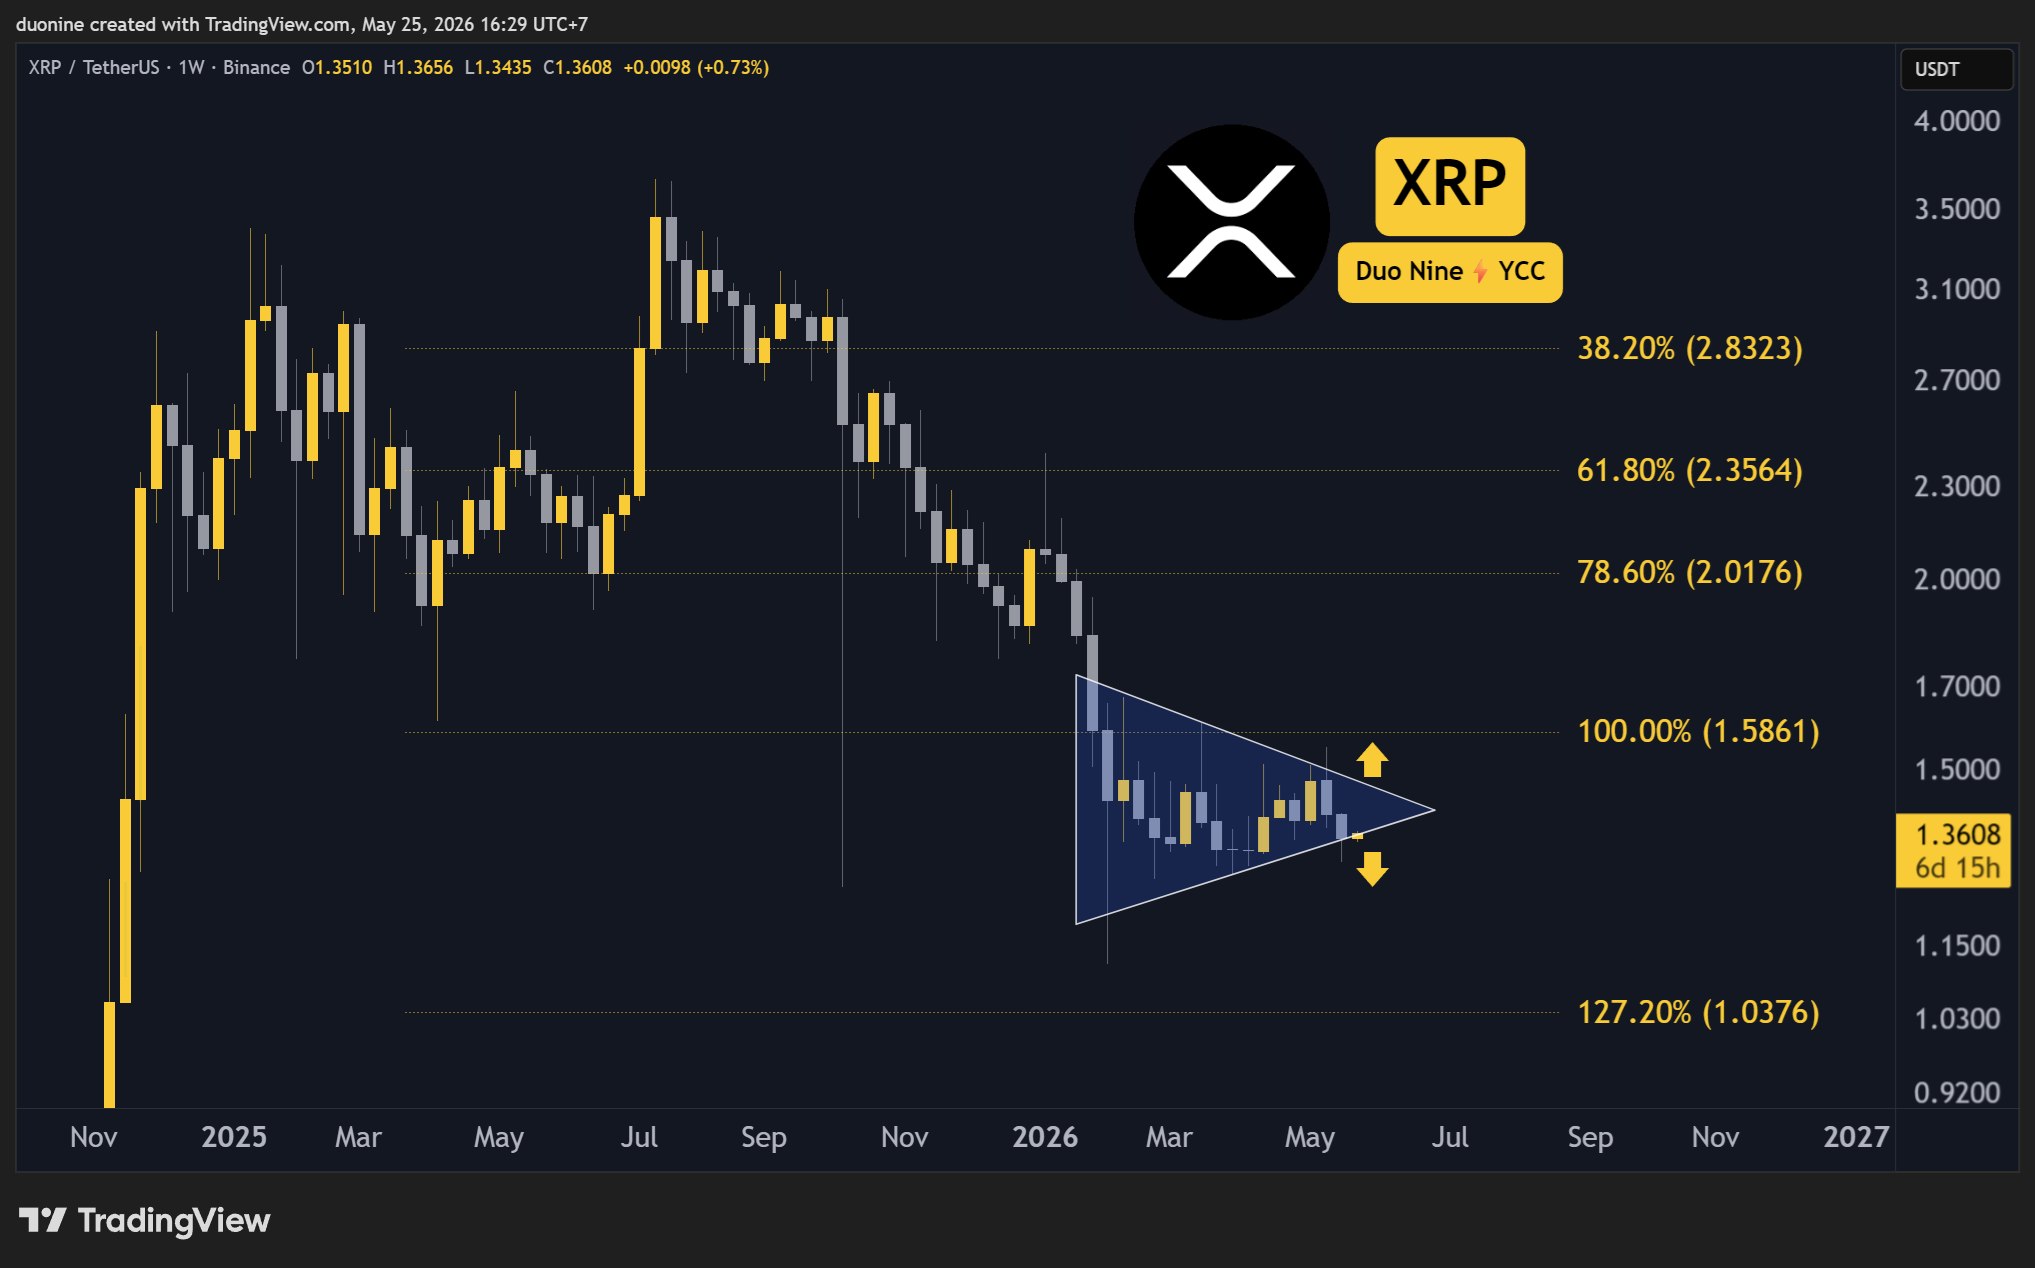
    XRP Price Outlook: Exchange Liquidity Lowest Since 2020

    XRP’s price is signaling potential volatility as the exchange liquidity index for XRP has fallen to its lowest level since 2020, indicating a significant structural shift.

    Market Dynamics

    The tightening supply of XRP is evident in declining exchange reserves and increased holdings by large investors, raising concerns about a potential liquidity crisis. This development coincides with a drop in XRP spot volume on Binance following recent market downturns. The price of XRP has fallen to $1.35, representing a 2% decrease this week.

    The combination of thin liquidity and the ongoing discussion surrounding a potential Exchange Traded Fund (ETF) creates conditions that could lead to significant price fluctuations.

    Technical Analysis

    XRP is currently consolidating below its recent high of $1.50, struggling to maintain its position within the upper range of its weekly trading band. Support levels are clustered around $1.31, which marks the lower boundary of the seven-day trading range.

    Momentum indicators are mixed. The 0.5% daily price drop is mirrored by stagnation in futures activity and at the exchange level. These factors have been highlighted as contributing to market instability in recent weeks, and data from Binance confirms that this pattern is intensifying.

    Potential Scenarios

    Three potential scenarios could unfold in the near term:

    • Bull Case: Increased speculation regarding ETF approval could drive XRP to retest $1.50. DeepSeek’s AI model projects a price target of $5 by late 2025 if institutional adoption accelerates.
    • Base Case: Consolidation continues within the $1.30-$1.40 range as the market awaits a catalyst, such as the Clarity Act.
    • Bear Case: Deteriorating liquidity could accelerate, widening spreads and potentially pushing the price towards the $1.31 support level.

    The ETF flow dynamic remains a key factor to monitor in the coming months.

    Infrastructure Solutions

    XRP’s low liquidity highlights a broader structural issue affecting multiple assets. Fragmented liquidity across different blockchain networks contributes to the price distortions currently observed in XRP. For traders, the underlying infrastructure becomes a crucial aspect of their investment strategy.

    LiquidChain ($LIQUID) is a Layer 3 infrastructure project designed to address this issue. Its Unified Liquidity Layer integrates liquidity from Bitcoin, Ethereum, and Solana into a single execution environment.

    With LiquidChain, developers can deploy applications once and access all three ecosystems simultaneously. Its Single-Step Execution and Verifiable Settlement features aim to eliminate the multi-step bridging processes that contribute to liquidity fragmentation.

    The LiquidChain presale has surpassed $800,000, with the current price of $0.01463 per $LIQUID. Capital is increasingly flowing into on-chain infrastructure projects as the $1 million milestone approaches.

  • ‏سه نکته کلیدی در مورد قیمت ریپل (XRP) این هفته: تحلیل

    ‏سه نکته کلیدی در مورد قیمت ریپل (XRP) این هفته: تحلیل

    ‏XRP در تلاش برای بازپس‌گیری حمایت ۱٫۴ دلاری است. آیا موفق خواهد شد؟

    سطوح حمایت کلیدی: ۱٫۲ دلار، ۱ دلار
    سطوح مقاومت کلیدی: ۱٫۴ دلار، ۱٫۶ دلار، ۲ دلار

    بازگشت قیمت و تلاش برای بازیابی حمایت

    در یک تحول جالب، قیمت XRP به محض خروج از الگوی پرچم آبی، مسیر خود را تغییر داد و اکنون در تلاش است تا حمایت ۱٫۴ دلاری را دوباره به دست آورد. اگر این تلاش موفقیت‌آمیز باشد، یک بازگشت صعودی خواهد بود.

    در حالی که نبرد بین خریداران و فروشندگان ادامه دارد، XRP موفق شده است روند نزولی را، حداقل به طور موقت، متوقف کند. قیمت همچنین یک کف بالاتر را تشکیل داده است که نشانه مثبت دیگری است.

    تحلیل روند قیمت

    افت از ۱٫۶ دلار به ۱٫۳ دلار بسیار شدید بود و هیچ تسکینی به همراه نداشت. فروشندگان بسیار تهاجمی بودند، اما اکنون به نظر می‌رسد خسته شده‌اند. از زمانی که قیمت به ۱٫۳ دلار رسید، حجم فروش ناپدید شد و خریداران در حال بازگشت هستند.

    به همین دلیل، قیمت اکنون در موقعیت خوبی برای جبران بخشی از زیان‌های اخیر قرار دارد. این می‌تواند بیشتر تقویت شود اگر خریداران ۱٫۴ دلار را به عنوان حمایت بازیابی کنند، که می‌تواند یک پایه قوی برای آزمایش مجدد مقاومت بعدی در ۱٫۶ دلار فراهم کند.

    شاخص قدرت نسبی (RSI) و چشم‌انداز بازار

    شاخص قدرت نسبی (RSI) در نمودار ۴ ساعته به کف رسیده و در حال ثبت سقف‌ها و کف‌های بالاتر است. حتی میانگین متحرک RSI نیز در حال افزایش است. اگر گاوها بتوانند این فشار و حجم را حفظ کنند، احتمالاً RSI بالای ۵۰ باقی خواهد ماند و حتی به سمت ۷۰ هدف‌گذاری خواهد کرد، که نشان‌دهنده یک روند صعودی قوی است.

    اگر چند روز اول این هفته با رنگ سبز بسته شود، این ارز دیجیتال شانس واقعی برای شکست از الگوی پرچم با هدف کلیدی ۱٫۶ دلار برای رالی خود دارد.

  • Whale Dumps $9 Million in HYPE, More Sales Expected

    Whale Dumps $9 Million in HYPE, More Sales Expected

    HYPE’s price has experienced a significant surge over the past week, increasing by 40% and reaching a new all-time high above $64.

    Profit-Taking Slows Rally

    The rally appears to have slowed in the last 24 hours, with some investors opting to take profits rather than pursue further gains. HYPE climbed from below $40 to over $64 in the past few weeks, marking the most impressive rally in the crypto market during that period. This surge added billions of dollars to Hyperliquid’s total market capitalization and was driven by increased trading volume and substantial interest.

    Whale Activity Signals Shift

    As anticipated, the rally has begun to slow as some investors seek to realize profits. The on-chain analytics account Lookonchain identified a wallet that sold 151,574 HYPE, valued at $9.25 million, a few hours ago. The trader has also placed limit sell orders for an additional 170,000 HYPE, worth approximately $10.6 million, at prices between $63.45 and $70.55.

    Market Position and ETF Performance

    At the time of this report, HYPE is the 11th-largest cryptocurrency project by total market capitalization, estimated at around $15 billion. The altcoin is undoubtedly the best-performing large-cap crypto this week, and its price surge has brought it close to surpassing Dogecoin for the 10th position.

    HYPE-based spot exchange-traded funds are also experiencing a surge in assets under management, contrasting with a generally declining market. While Bitcoin ETFs saw over a billion dollars in AUM outflows, HYPE attracted more than $70 million, according to CryptoPotato.

  • ‏مقاومت، جهش دوج‌کوین را تهدید می‌کند.

    ‏مقاومت، جهش دوج‌کوین را تهدید می‌کند.

    آغاز موج بازیابی دوج‌کوین
    دوج‌کوین (Dogecoin) موج بازیابی خود را در برابر دلار آمریکا از بالای منطقه ۰٫۱۰ دلاری آغاز کرد.

    در حال حاضر، دوج با موانعی در نزدیکی ۰٫۱۰۵۰ دلار مواجه است و ممکن است برای ادامه روند صعودی خود با مشکل روبرو شود.

    تحلیل قیمت

    قیمت دوج‌کوین از ۰٫۱۰ دلار بازیابی شده و از ۰٫۱۰۲۰ دلار فراتر رفته است. قیمت در حال حاضر زیر سطح ۰٫۱۰۳۵ دلار و میانگین متحرک ساده ۱۰۰ ساعته معامله می‌شود. یک خط روند نزولی با مقاومت در ۰٫۱۰۳۰ دلار در نمودار ساعتی جفت DOGE/USD (منبع داده: Kraken) در حال شکل‌گیری است. اگر قیمت بالای ۰٫۱۰ دلار باقی بماند، می‌تواند به حرکت صعودی خود ادامه دهد.

    مقاومت قیمت دوج‌کوین

    قیمت دوج‌کوین، همانند بیت‌کوین و اتریوم، موج بازیابی خود را از منطقه ۰٫۱۰ دلاری آغاز کرد. دوج از سطوح مقاومتی ۰٫۱۰۱۵ و ۰٫۱۰۲۰ دلار عبور کرد. یک حرکت صعودی مناسب بالای سطح ۵۰٪ فیبوناچی اصلاحی از حرکت نزولی از سقف ۰٫۱۰۶۶ دلاری تا کف ۰٫۰۹۶۸ دلاری مشاهده شد. با این حال، قیمت در نزدیکی ۰٫۱۰۴۵ دلار با مشکل مواجه شد. همچنین یک خط روند نزولی با مقاومت در ۰٫۱۰۳۰ دلار در نمودار ساعتی جفت DOGE/USD در حال شکل‌گیری است. قیمت دوج‌کوین در حال حاضر زیر سطح ۰٫۱۰۳۵ دلار و میانگین متحرک ساده ۱۰۰ ساعته معامله می‌شود.

    سطوح مقاومت و حمایت

    اگر موج بازیابی دیگری رخ دهد، مقاومت فوری در سمت صعودی در نزدیکی سطح ۰٫۱۰۳۰ دلار قرار دارد. اولین مقاومت اصلی برای صعودی‌ها می‌تواند در نزدیکی سطح ۰٫۱۰۴۲ دلار یا سطح ۷۶٫۴٪ فیبوناچی اصلاحی از حرکت نزولی از سقف ۰٫۱۰۶۶ دلاری تا کف ۰٫۰۹۶۸ دلاری باشد. مقاومت اصلی بعدی در نزدیکی سطح ۰٫۱۰۵۰ دلار قرار دارد. بسته شدن قیمت بالای مقاومت ۰٫۱۰۵۰ دلار ممکن است قیمت را به سمت مقاومت ۰٫۱۰۸۵ دلار سوق دهد. هرگونه افزایش بیشتر ممکن است قیمت را به سمت سطح ۰٫۱۱۲۰ دلار هدایت کند. توقف اصلی بعدی برای صعودی‌ها ممکن است ۰٫۱۱۵۰ دلار باشد.

    احتمال کاهش بیشتر قیمت دوج‌کوین

    اگر قیمت دوج نتواند از سطح ۰٫۱۰۵۰ دلار فراتر رود، ممکن است به حرکت نزولی خود ادامه دهد. حمایت اولیه در سمت نزولی در نزدیکی سطح ۰٫۱۰۵ دلار قرار دارد. حمایت اصلی بعدی در نزدیکی سطح ۰٫۱۰ دلار است. حمایت اصلی در ۰٫۰۹۸۰ دلار قرار دارد. اگر قیمت از حمایت ۰٫۰۹۸۰ دلار عبور کند، ممکن است کاهش بیشتری را تجربه کند. در این صورت، قیمت ممکن است در کوتاه مدت به سمت سطح ۰٫۰۹۶۵۰ دلار یا حتی ۰٫۰۹۵۰ دلار کاهش یابد.

    شاخص‌های فنی

    • MACD ساعتی: MACD برای DOGE/USD در حال حاضر در منطقه صعودی در حال افزایش است.
    • RSI ساعتی (شاخص قدرت نسبی): RSI برای DOGE/USD در حال حاضر بالای سطح ۵۰ قرار دارد.

    سطوح حمایت و مقاومت اصلی

    • سطوح حمایت اصلی: ۰٫۱۰۵ دلار و ۰٫۱۰۰۰ دلار
    • سطوح مقاومت اصلی: ۰٫۱۰۵۰ دلار و ۰٫۱۱۲۰ دلار
  • ‏نهنگ هایپرلیکوید ۹ میلیون دلار HYPE فروختند و هنوز تمام نشده است.

    ‏نهنگ هایپرلیکوید ۹ میلیون دلار HYPE فروختند و هنوز تمام نشده است.

    ‏قیمت ارز دیجیتال HYPE در هفته گذشته به شدت افزایش یافت و با جهشی ۴۰ درصدی در هفت روز گذشته، به بالاترین حد خود یعنی بیش از ۶۴ دلار رسید.

    کاهش سرعت رشد

    به نظر می‌رسد این افزایش قیمت در ۲۴ ساعت گذشته کند شده است و برخی از سرمایه‌گذاران به جای دنبال کردن سود بیشتر، در حال برداشت سود هستند.

    افزایش چشمگیر قیمت

    HYPE در چند هفته گذشته از زیر ۴۰ دلار به بالای ۶۴ دلار افزایش یافت و به این ترتیب، چشمگیرترین افزایش قیمت را در میان ارزهای دیجیتال در این مدت به ثبت رساند. این حرکت، میلیاردها دلار به ارزش کل بازار Hyperliquid افزود و ناشی از افزایش حجم معاملات و علاقه گسترده به این ارز بود.

    برداشت سود توسط سرمایه‌گذاران

    همانطور که تا حدودی انتظار می‌رفت، این افزایش قیمت سرانجام کمی کند شده است، زیرا برخی از سرمایه‌گذاران به دنبال برداشت سود هستند.

    فروش‌های بزرگ

    حساب تحلیلگر محبوب درون زنجیره‌ای Lookonchain، یک کیف پول را شناسایی کرد که ۱۵۱,۵۷۴ واحد HYPE (به ارزش ۹.۲۵ میلیون دلار) را چند ساعت پیش فروخته است. این معامله‌گر همچنین سفارش‌های فروش محدود دیگری برای ۱۷۰,۰۰۰ واحد HYPE به ارزش حدود ۱۰.۶ میلیون دلار بین قیمت‌های ۶۳.۴۵ تا ۷۰.۵۵ دلار ثبت کرده است.

    جایگاه در بازار

    در زمان نگارش این خبر، HYPE یازدهمین پروژه بزرگ ارز دیجیتال از نظر ارزش کل بازار (حدود ۱۵ میلیارد دلار) است. این آلت‌کوین بدون شک بهترین عملکرد را در میان ارزهای دیجیتال با سرمایه بالا در این هفته داشته است و افزایش قیمت آن، این ارز را به جایگاه دهم، نزدیک به Dogecoin رسانده است.

    افزایش سرمایه در صندوق‌های ETF

    صندوق‌های قابل معامله در بورس (ETF) مبتنی بر HYPE نیز در میان بازاری که در حال کاهش است، در حال افزایش دارایی‌های تحت مدیریت خود هستند. در حالی که ETFهای بیت‌کوین بیش از یک میلیارد دلار از دارایی‌های خود را از دست دادند، HYPE بیش از ۷۰ میلیون دلار جذب کرد، همانطور که CryptoPotato گزارش داده است.

  • XRP Holds Support, Eyes Next Rally

    XRP Holds Support, Eyes Next Rally

    XRP Price Consolidates After Correction

    The price of XRP has begun a downward correction from the $1.3750 zone. Currently consolidating, the cryptocurrency could attempt another increase if it remains above $1.3280.

    Technical Analysis

    XRP initiated a downside correction after failing to sustain its position above $1.3720. The price is now trading above $1.350 and the 100-hourly Simple Moving Average. A bearish trend line is forming, with resistance at $1.3650 on the hourly chart of the XRP/USD pair, according to data from Kraken. The pair could initiate a fresh increase if it settles above $1.3750.

    Support Levels

    XRP experienced a notable upward movement, surpassing $1.3250 and $1.3280, outperforming both Bitcoin and Ethereum. The price gained momentum, breaking above the $1.370 resistance. A high of $1.3741 was reached before a downside correction began. The price subsequently fell below $1.3450 and $1.3420, dipping below the 50% Fibonacci retracement level of the upward move from the $1.3001 swing low to the $1.3741 high. Currently, the price is trading above $1.350 and the 100-hourly Simple Moving Average.

    Resistance Levels

    If the price resumes its upward trajectory, it may encounter resistance near the $1.3650 level, coinciding with a bearish trend line on the hourly chart. The primary resistance level is near $1.3740, with a potential rise to test $1.3880 if surpassed. Further gains could lead to a test of the $1.40 resistance, with the next major hurdle for bulls potentially near $1.450.

    Potential Downside

    If XRP fails to break through the $1.3740 resistance zone, a fresh decline could occur. Initial support on the downside is near $1.3370. The next significant support levels are near $1.3280 and the 61.8% Fibonacci retracement level of the upward move from the $1.3001 swing low to the $1.3741 high. A break and close below $1.3280 could lead to a further decline towards $1.3175, with the next major support zone near $1.3120. Further losses could see a test of $1.30.

    Technical Indicators

    The Hourly MACD for XRP/USD is gaining momentum in the bullish zone. The Hourly RSI (Relative Strength Index) for XRP/USD is currently above the 50 level.

    Major Support Levels: $1.3370 and $1.3280.

    Major Resistance Levels: $1.3650 and $1.3740.

  • Dogecoin Rally Stalls at Resistance

    Dogecoin Rally Stalls at Resistance

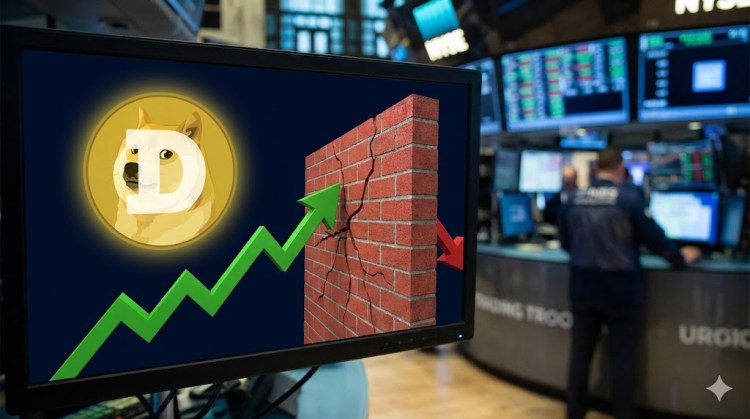
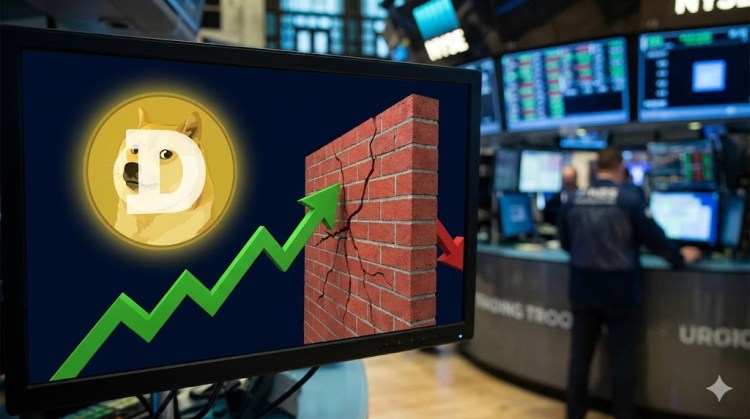
    Dogecoin (DOGE) has initiated a recovery, surpassing the $0.10 mark against the US Dollar. However, the cryptocurrency is now encountering resistance near $0.1050 and may face challenges in sustaining further gains.

    Price Analysis

    DOGE began its recovery from $0.10, climbing above $0.1020. The price is currently trading below $0.1035 and the 100-hourly simple moving average. A bearish trend line is forming, with resistance at $0.1030 on the hourly chart of the DOGE/USD pair, according to data from Kraken. The price could continue its upward movement if it remains above $0.10.

    Resistance Levels

    Dogecoin’s price, mirroring movements in Bitcoin and Ethereum, initiated a recovery from the $0.10 zone. DOGE surpassed resistance levels at $0.1015 and $0.1020. A notable upward move occurred above the 50% Fibonacci retracement level, calculated from the decline between the $0.1066 swing high and the $0.0968 low. However, the price struggled near $0.1045. A bearish trend line is also forming, with resistance at $0.1030 on the hourly chart of the DOGE/USD pair.

    Currently, Dogecoin is trading below $0.1035 and the 100-hourly simple moving average. Immediate resistance on the upside is near $0.1030. The first significant resistance for bulls could be near $0.1042, coinciding with the 76.4% Fibonacci retracement level of the downward move from the $0.1066 swing high to the $0.0968 low. The next major resistance is near $0.1050. A close above $0.1050 could potentially push the price towards the $0.1085 resistance level. Further gains might lead to a test of the $0.1120 level, with $0.1150 as the next potential target for bulls.

    Potential Downturn

    If DOGE fails to break above $0.1050, a continued decline is possible. Initial support on the downside is near $0.1005, followed by the $0.10 level. The primary support level is at $0.0980. A break below $0.0980 could trigger a further price decrease, potentially leading to a drop towards $0.09650 or even $0.0950 in the short term.

    Technical Indicators

    The hourly Moving Average Convergence Divergence (MACD) for DOGE/USD is currently gaining bullish momentum. The hourly Relative Strength Index (RSI) for DOGE/USD is above the 50 level.

    Major support levels are at $0.1005 and $0.1000. Major resistance levels are at $0.1050 and $0.1120.

  • Bitcoin ETFs See $1.25B Outflow Amid Surging Chip ETF Interest

    Bitcoin ETFs See $1.25B Outflow Amid Surging Chip ETF Interest

    Last week, crypto-related exchange-traded funds experienced significant outflows, while a memory chip ETF rapidly gained assets, becoming one of the fastest-growing funds in history.

    Crypto ETF Outflows

    Bitcoin’s price saw minimal gains during the period, increasing by only 0.6%. Many altcoins mirrored this performance, with a few exceptions, such as Hyperliquid’s HYPE, which surged approximately 40%.

    From May 18 to May 22, spot Bitcoin ETFs recorded net outflows of $1.257 billion, according to data from Farside Investors. This indicates a shift in investor sentiment. Ethereum-based ETFs also faced challenges, with net outflows of around $216 million during the same period. This pullback suggests investors may be taking profits, reducing risk, or reallocating capital to other sectors.

    However, not all crypto-related ETFs suffered. Spot SOL ETFs attracted slightly over $15 million in net inflows, while spot XRP ETFs brought in $22 million. HYPE funds saw even stronger demand, attracting $72.38 million in net inflows, which correlated with the token’s price increase.

    These fund flows suggest that while Bitcoin and Ethereum faced selling pressure, investors are still investing in the broader crypto market, focusing on select altcoins.

    Memory Chip ETF’s Rapid Growth

    The Memory ETF, trading under the ticker DRAM, has become the fastest-growing exchange-traded fund in history. Launched on April 2, it accumulated over $6.5 billion in assets within just 27 trading sessions. This surpassed the previous record held by the BlackRock IBIT Bitcoin ETF, which took 30 trading sessions to reach the same level.

    Since its launch, DRAM has surged by over 84% and surpassed $10 billion in assets within 30 trading sessions. This has also positioned it among the top 10 US ETFs by year-to-date inflows out of more than 5,000 listed funds.

    The DRAM ETF’s rapid growth demonstrates increasing investor interest in memory chips. It is now among the top 20 most traded ETFs by volume, indicating that the memory chip and AI infrastructure trade is gaining significant momentum on Wall Street.

  • ‏قیمت XRP کفِ مهم را حفظ کرد، بازار منتظر حرکت بزرگ بعدی است.

    ‏قیمت XRP کفِ مهم را حفظ کرد، بازار منتظر حرکت بزرگ بعدی است.

    ‏قیمت XRP از منطقه ۱٫۳۷۵۰ دلار وارد اصلاح نزولی شد. در حال حاضر، قیمت در حال تثبیت است و اگر بالای منطقه ۱٫۳۲۸۰ دلار باقی بماند، ممکن است به افزایش دیگری دست یابد. قیمت XRP پس از ناتوانی در حفظ موقعیت بالای منطقه ۱٫۳۷۲۰ دلار، وارد اصلاح نزولی شد. در حال حاضر، قیمت بالای ۱٫۳۵۰ دلار و میانگین متحرک ساده ۱۰۰ ساعته معامله می‌شود. یک خط روند نزولی با مقاومت در ۱٫۳۶۵۰ دلار در نمودار ساعتی جفت ارز XRP/USD (منبع داده از Kraken) در حال شکل‌گیری است. اگر این جفت ارز بالای ۱٫۳۷۵۰ دلار تثبیت شود، می‌تواند افزایش جدیدی را آغاز کند.

    حفظ حمایت توسط قیمت XRP

    قیمت XRP یک حرکت صعودی مناسب را بالای ۱٫۳۲۵۰ و ۱٫۳۲۸۰ دلار آغاز کرد و عملکرد بهتری نسبت به بیت‌کوین و اتریوم داشت. قیمت برای یک حرکت واضح بالای مقاومت ۱٫۳۷۰ دلار سرعت گرفت. یک سقف در ۱٫۳۷۴۱ دلار شکل گرفت و قیمت وارد اصلاح نزولی شد. حرکتی زیر ۱٫۳۴۵۰ و ۱٫۳۴۲۰ دلار مشاهده شد. قیمت زیر سطح ۵۰٪ فیبوناچی اصلاحی حرکت صعودی از کف ۱٫۳۰۰۱ دلار تا سقف ۱٫۳۷۴۱ دلار کاهش یافت. در حال حاضر، قیمت بالای ۱٫۳۵۰ دلار و میانگین متحرک ساده ۱۰۰ ساعته معامله می‌شود. اگر یک حرکت صعودی جدید وجود داشته باشد، قیمت ممکن است با مقاومت نزدیک به سطح ۱٫۳۶۵۰ دلار مواجه شود. همچنین یک خط روند نزولی با مقاومت در ۱٫۳۶۵۰ دلار در نمودار ساعتی جفت ارز XRP/USD در حال شکل‌گیری است. اولین مقاومت اصلی نزدیک به سطح ۱٫۳۷۴۰ دلار است که با عبور از آن، قیمت می‌تواند افزایش یابد و ۱٫۳۸۸۰ دلار را آزمایش کند. یک حرکت واضح بالای مقاومت ۱٫۳۸۸۰ دلار ممکن است قیمت را به سمت مقاومت ۱٫۴۰ دلار سوق دهد. هرگونه افزایش بیشتر ممکن است قیمت را به سمت مقاومت ۱٫۴۲۰ دلار هدایت کند. مانع اصلی بعدی برای صعودی‌ها ممکن است نزدیک به ۱٫۴۵۰ دلار باشد.

    گسترش نزولی؟

    اگر XRP نتواند منطقه مقاومت ۱٫۳۷۴۰ دلار را پاک کند، می‌تواند یک کاهش جدید را آغاز کند. حمایت اولیه در سمت نزولی نزدیک به سطح ۱٫۳۳۷۰ دلار است. حمایت اصلی بعدی نزدیک به سطح ۱٫۳۲۸۰ دلار و سطح ۶۱٫۸٪ فیبوناچی اصلاحی حرکت صعودی از کف ۱٫۳۰۰۱ دلار تا سقف ۱٫۳۷۴۱ دلار است. اگر یک شکست نزولی و بسته شدن زیر سطح ۱٫۳۲۸۰ دلار وجود داشته باشد، قیمت ممکن است به کاهش خود به سمت ۱٫۳۱۷۵ دلار ادامه دهد. حمایت اصلی بعدی نزدیک به منطقه ۱٫۳۱۲۰ دلار قرار دارد که با عبور از آن، قیمت می‌تواند به سمت پایین‌تر و به سمت ۱٫۳۰۵۰ دلار ادامه دهد. هرگونه ضرر بیشتر ممکن است آزمایش ۱٫۳۰ دلار را به دنبال داشته باشد.

    شاخص‌های فنی

    • MACD ساعتی: MACD برای XRP/USD در حال حاضر در منطقه صعودی سرعت می‌گیرد.
    • RSI ساعتی (شاخص قدرت نسبی): RSI برای XRP/USD در حال حاضر بالای سطح ۵۰ قرار دارد.

    سطوح حمایت و مقاومت اصلی

    • سطوح حمایت اصلی: ۱٫۳۳۷۰ و ۱٫۳۲۸۰ دلار.
    • سطوح مقاومت اصلی: ۱٫۳۶۵۰ و ۱٫۳۷۴۰ دلار.
  • Ethereum Price Gains Bullish Momentum

    Ethereum Price Gains Bullish Momentum

    Ethereum Price Correction

    Ethereum’s price has begun a downward correction from $2,150. To resume its upward trajectory, ETH must surpass resistance levels at $2,120 and $2,150. The cryptocurrency has retreated below the $2,125 zone and is currently trading above $2,100 and the 100-hourly Simple Moving Average.

    A bearish trend line is forming, with resistance at $2,110 on the hourly chart of ETH/USD, according to data from Kraken. The pair could continue to decline if it remains below the $2,150 zone.

    Support Levels Hold

    Ethereum failed to maintain its position above the $2,145 zone, mirroring Bitcoin’s decline. The price of ETH subsequently fell below the $2,120 and $2,110 levels. Bears pushed the price below the 38.2% Fibonacci retracement level, calculated from the upward movement between the $2,001 swing low and the $2,147 high. However, bulls have been active near the $2,065 level.

    The hourly chart of ETH/USD also shows a bearish trend line forming, with resistance at $2,110. Ethereum is currently trading above $2,100 and the 100-hourly Simple Moving Average. If bulls maintain their activity above $2,065, the price may attempt another increase.

    Immediate resistance is observed near $2,110, with the first key resistance near $2,140. The next significant resistance level is near $2,150. A decisive move above the $2,150 resistance could potentially drive the price towards the $2,220 resistance level. A break above $2,220 might lead to further gains in the coming days, potentially pushing Ether towards the $2,250 resistance zone or even $2,320 in the near term.

    Potential for Further Decline

    If Ethereum fails to overcome the $2,110 resistance, a fresh decline could be initiated. Initial support on the downside is near the $2,075 level. The first major support is situated near the $2,055 zone, coinciding with the 61.8% Fibonacci retracement level of the upward move from the $2,001 swing low to the $2,147 high. A clear break below the $2,055 support could push the price towards the $2,020 support level. Further losses might lead to a test of the $2,000 region, with the main support potentially at $1,940.

    Technical Indicators

    The Hourly MACD for ETH/USD is gaining bullish momentum. The Hourly RSI for ETH/USD is currently above the 50 zone.

    Major Support Level: $2,055
    Major Resistance Level: $2,150