Category: Uncategorized

  • Equity Perpetual Futures Volume Grows on Crypto Exchanges, Amidst Concentrated Tech Asset Trading and Uncertainty

    Equity Perpetual Futures Volume Grows on Crypto Exchanges, Amidst Concentrated Tech Asset Trading and Uncertainty

    The volume of equity perpetual futures traded on major digital asset exchanges reached approximately $250 billion in July, a seventeenfold increase from roughly $15 billion in April. However, this rapid expansion is heavily concentrated in a few specific technology and semiconductor-related assets, and whether this activity will spread across a broader range of equity perpetual contracts remains uncertain.

    According to analytics firm CryptoQuant, the growth has transformed crypto exchanges into round-the-clock venues for contracts linked to traditional equities. These products allow continuous trading of equity-linked assets, offering an alternative to conventional market hours and appealing to crypto-native capital seeking exposure to traditional financial instruments. Rather than focusing solely on cryptocurrencies like BTC and Ether, exchanges are diversifying their offerings.

    Market Dynamics and Growth

    Binance remains the dominant platform in this market, handling an estimated $193 billion in equity perpetual futures volume in July, which accounted for about 76% of the total market. Other exchanges like Bitfer, Bybit, and Gate also saw significant activity, though at a considerable distance from Binance.

    CryptoQuant identified Gate as the fastest-growing venue during July, with its equity perpetual futures volume increasing by approximately 308% compared to June. Bybit experienced a 176% rise, while Binance saw a 59% increase in the same period. Gate has recorded consecutive monthly growth in this sector since May.

    Concentration and Future Development

    Despite the overall surge in trading volume, the market remains narrowly focused on a select group of assets. SanDisk, SK Hynix, Micron, and the leveraged semiconductor ETF SOXL are central to what analysts describe as the AI-memory complex. This concentration is particularly pronounced on Gate, where SanDisk and SK Hynix together comprised 53% of the exchange’s total equity perpetual futures volume in July.

    The products provide exposure to traditional assets while leveraging the continuous trading structure characteristic of crypto markets. However, the report from CryptoQuant highlights a market that has expanded rapidly but remains concentrated across a narrow range of assets. Whether this activity will eventually spread across a broader spectrum of equity perpetual contracts remains uncertain and will depend on how the market evolves beyond its current focus.

    The implications of this trend are significant for financial market participants, crypto traders, and fintech observers. While the growth signals a potential evolution in digital asset markets and the diversification of exchange offerings, the inherent concentration risk and the uncertainty surrounding future market development warrant careful consideration.

    Why This Matters

    The materials describe a narrow update: The volume of equity perpetual futures traded on cryptocurrency exchanges surged significantly in July. Whether activity will spread across a broader range of equity perpetual contracts.

    Broader Context

    Source materials place the factual news in this context: Equity perpetual futures on major digital asset exchanges reached about $250 billion in monthly volume in July.
  • Bitcoin Consolidates Around $63K Amidst Choppy Action, Uncertainty Remains

    Bitcoin Consolidates Around $63K Amidst Choppy Action, Uncertainty Remains

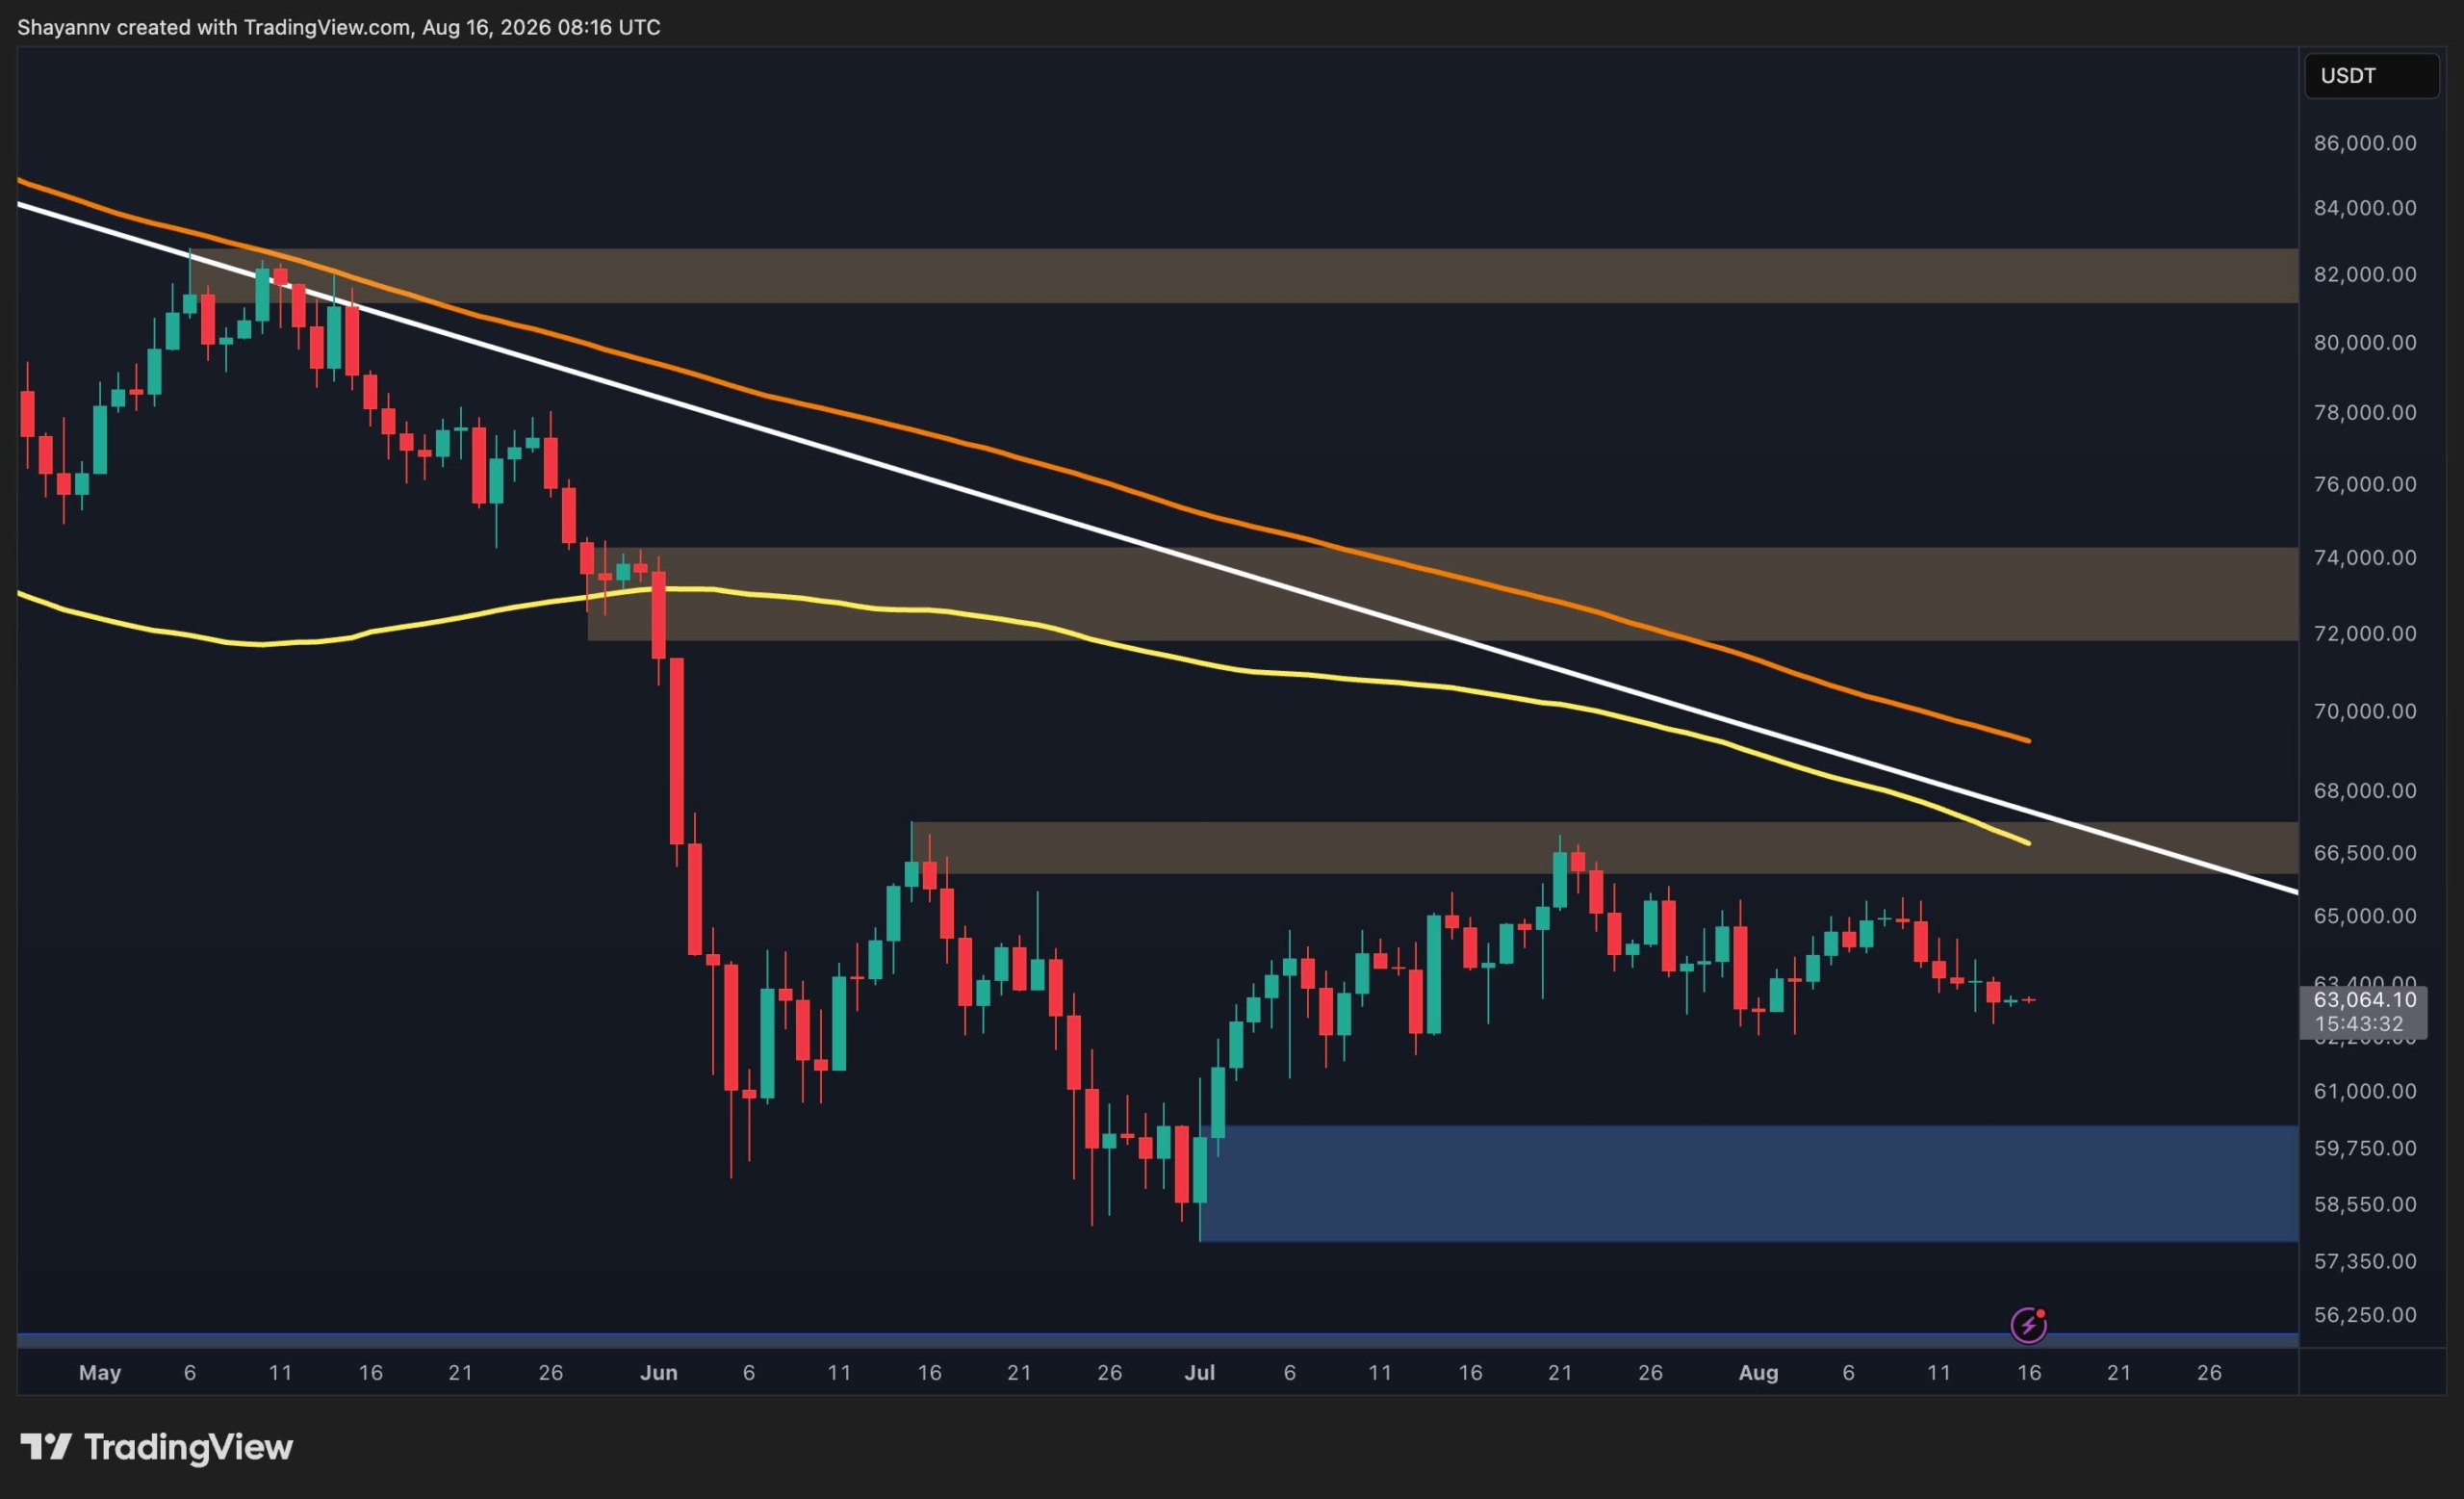
    Bitcoin is currently navigating a period of choppy consolidation, trading around the $63,000 mark with notably low volume. This sideways price action, according to the analysis, suggests a market lacking a decisive directional impulse, making its next move difficult to ascertain.

    Why This Matters

    The current market analysis indicates that Bitcoin’s price action is characterized by sideways consolidation due to limited liquidity and volume, preventing a decisive directional move. It remains uncertain whether Bitcoin may break out of its consolidation phase next week.

    Broader Context

    Source materials place the market analysis in this context: Bitcoin remains trapped in a low-momentum environment, with price action increasingly characterized by choppy consolidation rather than a decisive directional move.

    Key Technical Levels

    Resistance is identified between $66,200 and $67,200, while a significant support area lies between $58,500 and $59,800. The broader market structure remains compressed, with Bitcoin trading below major descending moving averages, and the 100-day moving average acting as an overhead reference.

    On the 4-hour timeframe, the price action is compressing between a descending upper trendline, around $64,500-$65,000, and an ascending lower trendline. This tightening range suggests that a break below the near-term support structure could lead to a revisit of lower price zones.

    Potential Downside Scenarios

    The article suggests that a notable move below the ascending lower trendline on the 4-hour chart could initiate a deeper correction. Such a move might first target the $60,300-$60,900 support zone, followed by the broader $58,100-$59,600 area. Significant liquidity concentrations exist around the current consolidation range, with notable clusters extending through the $53,000-$56,000 region. The heatmap indicates that a liquidity hunt below the $58,000 region remains a possibility if the current 4-hour support structure fails. This scenario, however, remains uncertain and requires confirmation.

    Potential Upside and Limitations

    Conversely, a notable move above the descending resistance trendline on the 4-hour chart could potentially invalidate the near-term bearish structure and improve the short-term outlook. However, the $66,200-$67,200 zone represents a more substantial resistance area that would need to be overcome for a material improvement in the short-term structure. Substantial liquidity also exists above the market around $66,000-$67,000 and at higher levels.

    The analysis highlights that the absence of significant volume favors continued consolidation rather than an immediate notable move. A downside liquidity sweep, potentially extending below $58,000, could theoretically precede a stronger bullish cycle, but this remains a speculative scenario. According to the analysis, Bitcoin would first need to reclaim key resistance zones and demonstrate meaningful volume expansion to suggest such a transition.

    Conclusion on Uncertainty

    Ultimately, the current market conditions for Bitcoin remain uncertain. The lack of liquidity and volume continues to limit follow-through, and the structure leaves room for potential liquidity-driven moves before a stronger trend develops. A decisive notable move below the $58,500-$59,800 zone would significantly weaken the bullish case, while a break above the descending trendline would introduce a more positive scenario. However, the article emphasizes that predicting the direction or timing of any significant price movement is difficult given the current ambiguous signals. The next week may provide more clarity as the consolidation range potentially resolves.

  • XRP Price Action Near $1.00: Technical Analysis Suggests Bearish Lean, Key Levels Monitored

    XRP Price Action Near $1.00: Technical Analysis Suggests Bearish Lean, Key Levels Monitored

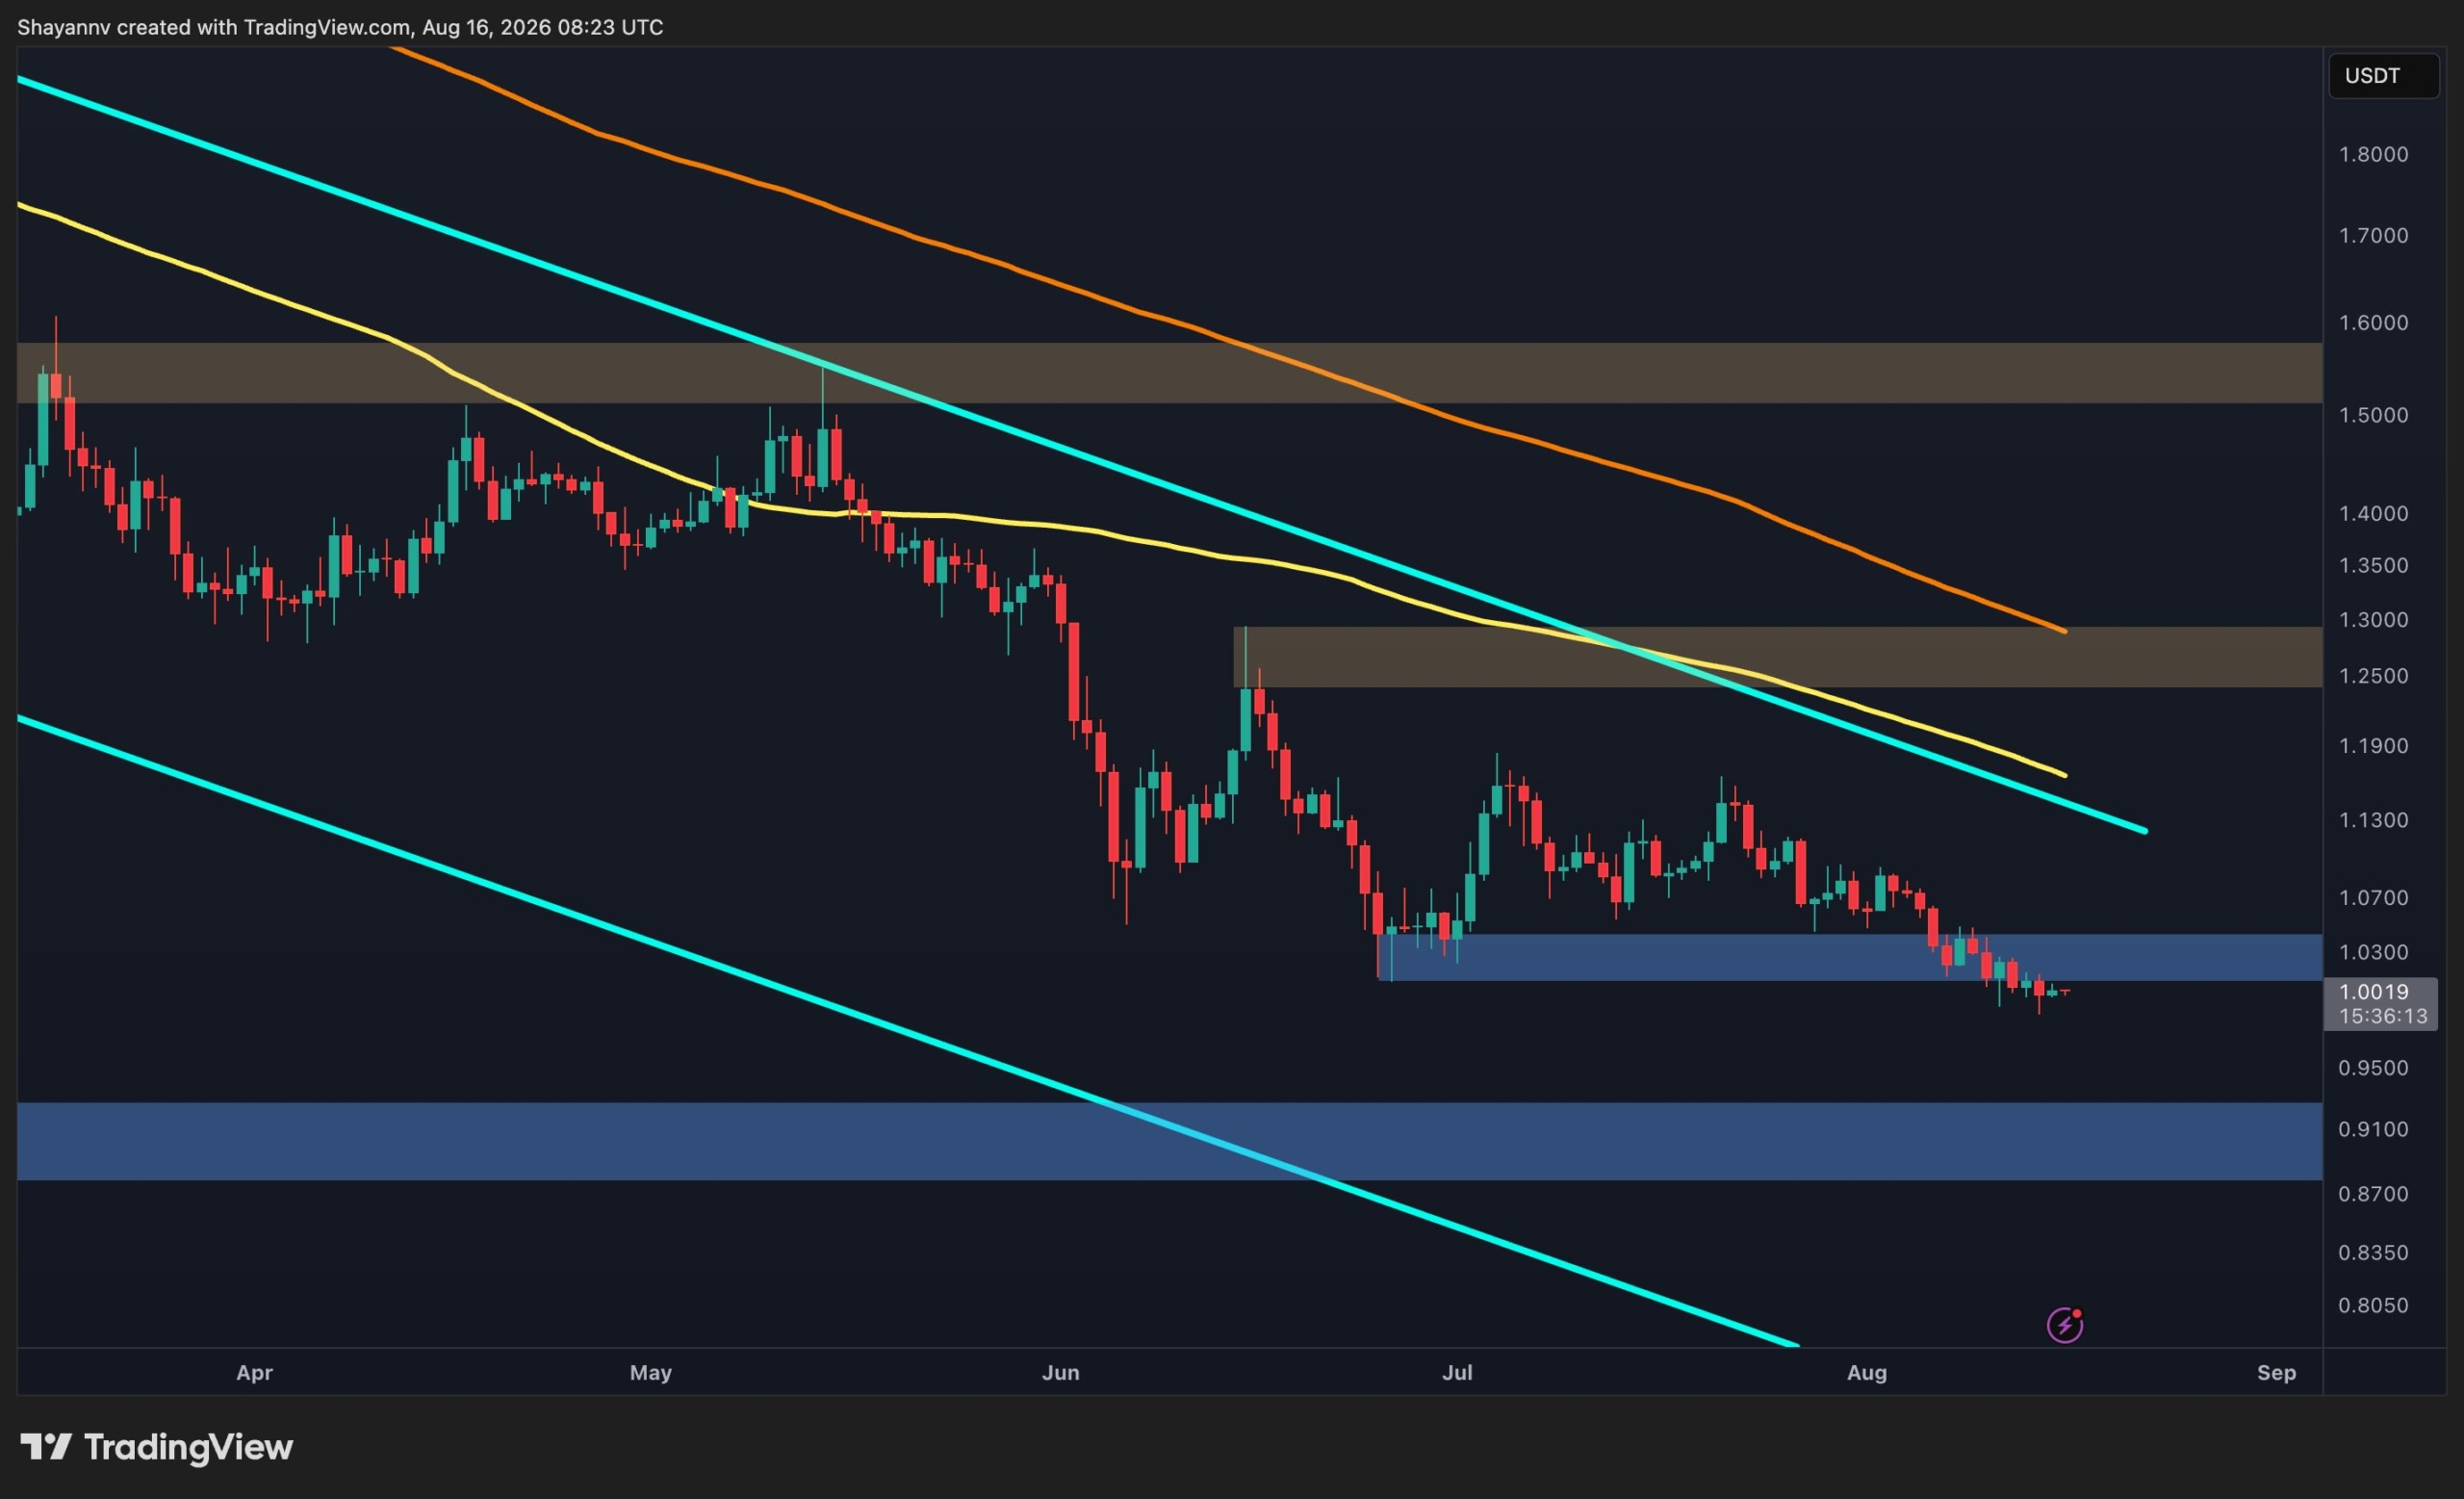
    XRP is currently trading near the $1.00 level, with prevailing technical indicators suggesting a bearish outlook. The asset is experiencing pressure, and a potential additional weakness is possible if key support levels are breached, according to market analysis.

    Bearish Structure and Momentum Observations
    The broader market structure appears to favor bears, with XRP trading below major moving averages on the daily timeframe. On the 4-hour chart, XRP has been forming lower highs beneath a descending trendline, reinforcing the bearish trend. This technical setup indicates that the market has lost momentum following previous declines, and a sustained recovery has yet to develop.

    Key Technical Levels: Resistance and Support
    Immediate resistance is identified in the $1.02-$1.04 area. XRP has recently moved below the $1.02-$1.03 support area on the 4-hour chart, suggesting that this former support may now act as resistance. The descending trendline overhead further reinforces the bearish structure.

    Immediate support is observed around the $1.00 level. However, if this level fails decisively, the next major downside reference is the demand zone between $0.91 and $0.97. This region represents the next significant support visible on the daily chart and could become relevant if the current consolidation resolves to the downside. A sustained move below the $1.00 area could expose this demand zone.

    Consolidation and Potential Scenarios
    The current consolidation just below $1.00 suggests that sellers have not completely lost control, although momentum is becoming compressed. The 4-hour chart presents a more immediate bearish picture, with recent rebound attempts repeatedly failing to produce a meaningful structural move. The lack of a strong bullish reversal suggests that the market may still be in a corrective phase.

    For the bearish setup to weaken, a sustained recovery above the $1.02-$1.04 resistance zone and a break above the descending trendline would be necessary to materially improve the daily structure. A stronger recovery above the $1.06-$1.08 area would provide a more convincing signal that the current downtrend is losing momentum. Until such a break occurs, the path of least resistance appears tilted to the downside, with the potential for another test of lower support levels remaining a possibility.

    Why This Matters

    The current market analysis indicates that XRP is trading below major moving averages and within a descending structure, suggesting a bearish trend. The uncertainty remains regarding whether XRP can defend the $1.00 level.

    Broader Context

    This market analysis is presented in the context of discussions surrounding XRP’s price movements. The post Ripple Price Prediction: Can XRP Defend $1 or Will $0.90 Come Into Play Next? appeared first on CryptoPotato.

  • California Bill to Regulate AI in Mental Health Services Advances Through Assembly Committee

    California Bill to Regulate AI in Mental Health Services Advances Through Assembly Committee

    California Senate Bill 903, legislation designed to regulate the use of artificial intelligence in mental health services, has cleared the Assembly Appropriations Committee and is progressing toward a final Assembly vote. The bill aims to prevent AI chatbots from functioning as therapists and making mental health decisions without human oversight.

    The Assembly Appropriations Committee approved SB 903 with a unanimous 13-0 vote on Thursday. This follows earlier approvals in Assembly policy committees, with votes of 17-0 and 14-1. The California Senate had previously passed the bill in May by a 39-0 vote. Senator Steve Padilla is the bill’s author.

    Key provisions of SB 903 include limiting AI in psychotherapy to support roles, requiring clinician oversight, and obtaining patient consent for AI use. The bill also seeks to protect therapy data while exempting certain counseling types and federally approved tools.

    Proponents, including Senator Padilla, argue that AI algorithms lack the nuanced skills and training of human therapists and that regulatory guardrails are necessary to prevent patient harm. Concerns have been raised that AI chatbots might reinforce delusions through excessive agreement, creating an “echo chamber of one” that lacks the beneficial influence of real-world interactions, as noted by researchers.

    However, critics like Robert Boykin, executive director of TechNet, express concern that mandating clinician involvement could worsen existing shortages of behavioral healthcare workers. This, they contend, may create a “clinician bottleneck,” potentially delaying patient access to care, even for initial intake and screening tools.

    The increasing integration of AI in mental health is underscored by a recent American Psychological Association survey, which found that 77% of psychologists have patients utilizing AI for mental health purposes.

    The legislative process for SB 903 is ongoing. The date for the final Assembly vote has not yet been scheduled. It remains uncertain whether the Assembly will approve the amended bill, if it may return to the Senate for concurrence, or if Governor Gavin Newsom will ultimately sign it into law.

    As California moves forward with SB 903, the bill’s progression highlights a growing societal debate about AI’s role in sensitive sectors like healthcare, with potential implications for patient safety and access to care.

    Broader Context

    Source materials place the factual news in this context: California is one step closer to barring AI chatbots from posing as therapists and making mental health decisions without human oversight.

  • BiggerZ Launches Integrated Betting Platform Emphasizing Transparency and Verifiability

    BiggerZ Launches Integrated Betting Platform Emphasizing Transparency and Verifiability

    BiggerZ has launched a new, unified platform that integrates casino gaming, sports betting, and prediction markets, offering users a single account and balance for all services. The platform, announced on August 16th, 2026, emphasizes transparency, verifiability, and clearly defined rules across its diverse offerings.

    Why This Matters

    The materials describe a narrow update: BiggerZ has launched a platform that integrates casino gaming, sports betting, and prediction markets under a single account and balance. Specific details on which fiat payment methods are supported.

    Broader Context

    Source materials place the factual news in this context: As online betting platforms expand across crypto, casino gaming, sports and prediction markets, BiggerZ is taking a different approach to how these products are presented to players: fairness should be explained rather than simply claimed.

    Platform Principles and Features

    BiggerZ states its approach is built on four core principles: transparency, clarity, verifiability, and defined rules. This philosophy is applied across its proprietary ‘BiggerZ Touch’ games, sportsbook settlement processes, and prediction market resolutions. According to BiggerZ, fairness should be explained rather than simply claimed, and users should understand the mechanisms governing outcomes before placing bets.

    For its ‘BiggerZ Touch’ games, the platform incorporates a provably fair transparency layer, which BiggerZ claims allows players to independently verify results. Third-party slots and live dealer games continue to operate under their respective providers’ certified systems and RNG controls. However, BiggerZ Touch adds a distinct verification mechanism for eligible in-house game outcomes.

    Sportsbook and Prediction Markets

    The same emphasis on fairness extends to BiggerZ’s sportsbook and prediction markets. In the sportsbook, fairness is primarily a matter of settlement clarity, with defined market rules, live betting conditions, void bets, and settlement conditions to help users understand how their bets will be resolved. For prediction markets, transparency centers on defined resolution criteria. These markets can cover real-world outcomes across various categories, including crypto, sports, finance, politics, culture, entertainment, and major world events. Each market is linked to specific resolution criteria, with its wording, timing, settlement conditions, and specified data source determining the final outcome.

    Payments and Verification

    BiggerZ also applies its principles to payments and account management. The platform supports cryptocurrency deposits, which are credited after required network confirmations. BiggerZ states it offers instant crypto withdrawals for eligible approved transactions, subject to network conditions and any necessary account verification. The company notes that requirements affecting fund access or account activity are intended to be available to players before they deposit or place a bet.

    The platform supports both cryptocurrency and selected fiat payment methods. BiggerZ is operated by CDK PLAY INC SRL and is licensed by the Government of the Autonomous Island of Anjouan, Union of Comoros.

    Brand Visibility

    BiggerZ has also focused on building brand visibility through partnerships with globally recognized figures across music, sport, and entertainment. These collaborations are intended to provide social proof and brand visibility alongside the platform’s focus on transparent game mechanics, settlement rules, and verifiable outcomes.

    Specific details remain uncertain regarding which fiat payment methods are supported, the exact criteria for ‘eligible approved transactions’ for instant crypto withdrawals, the specific network conditions that may affect withdrawals, and the precise nature of account verification required.

  • XRP ETFs Show Gains, But Inflows Lag

    XRP ETFs Show Gains, But Inflows Lag

    XRP ETFs End Week in the Green Amidst Stagnant Inflows

    The past week saw a curious development in the spot XRP Exchange Traded Funds (ETFs) as they concluded the trading period in positive territory, despite a single day accounting for all the activity. This pattern of minimal inflows has become a recurring theme, coinciding with a continued downturn in the price of the underlying asset, which has fallen below $1.00 for the first time in nearly two years.

    The net flows into spot XRP ETFs last week offered little new insight, continuing a trend that has persisted for some time. While the five-day trading period registered positive net flows, the overall picture was less encouraging. The funds saw a modest inflow of $2.25 million, a slight increase from the previous week’s $1.01 million.

    For context, these exchange-traded funds tracking the cross-border payment token were attracting over $20 million weekly in late June and surpassed $60 million in mid-May.

    A closer examination of the daily performance reveals a more concerning trend. The entirety of the $2.25 million inflow occurred on Thursday. The remaining four trading days of the week showed no reported activity, with data from SoSoValue indicating $0.00 for each of those days. This pattern extends to August, where six out of the ten business days have mirrored this trend of zero inflows. Consequently, cumulative net inflows have remained just over $1.51 billion, with minimal movement observed in recent weeks.

    On a more positive note, several major U.S. financial institutions, including Morgan Stanley, have disclosed significant holdings in XRP through ETFs in the past week.

    However, this apparent lack of sustained institutional interest, juxtaposed with reports of Ripple “whales” accumulating XRP, has coincided with a consistent decline in the native token’s price over the past few weeks. The asset recently faced rejection at the $1.10 mark and subsequently plunged, losing the $1.05 support level. In the days that followed, XRP dipped below $1.00 on multiple occasions and is currently struggling to decisively reclaim that level.

    From a technical and on-chain perspective, the outlook for XRP is mixed. While some on-chain metrics suggest an increase in network activity, overall investor sentiment has deteriorated to a multi-month low. Simultaneously, XRP’s Open Interest has reached its highest levels since the significant market event in October 2025, potentially signaling heightened volatility in the upcoming trading sessions.

  • Bitcoin ETFs See Net Outflows, Ethereum ETFs End Five-Week Inflow Streak

    Bitcoin ETFs See Net Outflows, Ethereum ETFs End Five-Week Inflow Streak

    Last week, Bitcoin exchange-traded funds (ETFs) experienced substantial net outflows totaling nearly $390 million, marking a notable shift after a period of strong inflows. Concurrently, Ethereum ETFs, which had maintained a streak of net inflows for five consecutive weeks, also recorded modest net outflows.

    Bitcoin ETF Flows Under Pressure
    The past week saw Bitcoin ETFs bleed approximately $390 million. Monday was the most significant day for withdrawals, with $144.67 million leaving the funds. Wednesday saw outflows of $61.16 million, followed by $131.13 million on Thursday and $57.63 million on Friday. Tuesday was an exception, with Bitcoin ETFs experiencing net inflows of $4.89 million.

    Among the largest Bitcoin ETFs, BlackRock’s IBIT holds nearly $47 billion in net assets, Fidelity’s FBTC has $10.70 billion, and Grayscale’s GBTC has $8.26 billion.

    Ethereum ETF Streak Snapped
    Ethereum ETFs, after a five-week run of positive net inflows, also saw a reversal. Last week, these funds experienced net outflows totaling $2.26 million. Monday accounted for $14.59 million in outflows, and Tuesday saw $1.76 million in net outflows. However, the trend partially reversed mid-week, with $7.38 million in net inflows on Wednesday and $6.72 million on Thursday. Friday recorded no net flows, with SoSoValue showing $0.00.

    Context and Uncertainty
    The second full week of August did not provide confirmation of a sustained positive trend for crypto ETFs. The Bitcoin ETFs had previously registered their best week since April, attracting over $850 million in net inflows. The Ethereum ETFs, in contrast, had built a consistent inflow streak from the first full week of July through the first full week of August, during which their cumulative net inflows grew from under $10.90 billion to $11.46 billion.

    The recent data introduces uncertainty regarding the immediate future of investor behavior towards cryptocurrency ETFs. While the Ethereum ETFs’ outflows were significantly smaller than those of their Bitcoin counterparts, the end of their inflow streak highlights a complex market environment. The long-term trend of Bitcoin and Ethereum ETF flows remains a key point of observation.

    Why This Matters

    The materials describe a narrow update: Last week, Bitcoin ETFs experienced net outflows totaling nearly $390 million, with Monday being the most significant day for withdrawals. Whether the late Q2 ETF slumber is over and investors have finally shifted their behavior.

    Broader Context

    Source materials place the factual news in this context: The spot exchange-traded funds tracking the performance of the largest cryptocurrency by market cap turned red once again in the past five trading days, with just one day recording more net inflows than outflows.

  • XRP Market Bottom Remains Uncertain Amidst Mixed Signals and AI Analysis

    XRP Market Bottom Remains Uncertain Amidst Mixed Signals and AI Analysis

    The cryptocurrency market is closely observing XRP’s price action, particularly following its recent dips below the $1.00 mark. While some indicators suggest a potential market bottom may be near, a definitive confirmation remains elusive, with conflicting signals and cautious analysis from AI highlighting ongoing uncertainty.

    Deteriorating Market Structure and Potential Decline

    In the past week, XRP experienced fluctuations that saw it trade below $1.00 on multiple occasions. This price level has been a significant psychological support, and its breach has raised questions about the token’s market structure. Historically, XRP has seen a substantial decline, plunging by 70% from its all-time high recorded approximately 13 months ago. This prolonged downturn has been characterized by a series of lower highs and lower lows, with most recovery attempts being short-lived. Further indicating potential downward pressure, XRP’s Taker Buy/Sell Ratio on Binance recently reached a multi-month low of 0.86. This metric indicates that aggressive sellers are outnumbering buyers on the exchange, signaling increased selling pressure. Additionally, rising futures positioning could heighten the risk of further price declines, potentially triggering a cascade of liquidations.

    Signs of Potential Recovery

    Despite the prevailing bearish trend, certain on-chain metrics offer a more optimistic perspective. Over the last three months, the number of wallets holding at least one million XRP has increased by 32. Furthermore, network activity has shown a notable surge, with the number of active XRP addresses escalating from under 24,000 to over 43,500 within a month. These developments, coupled with XRP’s resilience in fighting to maintain the $1.00 support level, suggest underlying strength that could precede a rebound.

    AI’s Cautious Outlook

    In an effort to gain further insight, ChatGPT was consulted for its analysis on whether XRP has reached a market bottom. According to ChatGPT’s assessment, while there is a possibility that the bottom is in or very close, definitive confirmation is lacking. The AI model noted that another leg down is plausible, suggesting that the recent sub-$1.00 dip might be close to a local capitulation bottom, but without certainty. ChatGPT’s analysis also highlighted that the next significant price area for XRP is observed around $0.94-$0.95. A break below this level could potentially lead to further losses, with a price dump target in the $0.80-$0.85 range. This cautious outlook from the AI underscores the prevailing uncertainty in the market.

    Conclusion: Navigating Uncertainty

    In conclusion, the XRP market presents a complex picture with mixed signals. While increased wallet holdings and network activity offer some positive signs, the deteriorating market structure and bearish trading ratios suggest that further price declines are possible. Investors and market observers are advised to approach the current situation with caution, as definitive confirmation of a market bottom remains absent.

    Why This Matters

    The materials describe a narrow update: ChatGPT analyzed XRP’s price action, considering factors like its decline from its all-time high, the increase in large XRP wallets, network usage jumps, and the Taker Buy/Sell Ratio. Whether XRP has reached a macro bottom.

    Broader Context

    Source materials place the market analysis in this context: After several months of flirting with the psychological support level at $1.00, Ripple’s XRP finally dipped below it on a couple of occasions in the past week, which aligned with many analysts’ expectations for such a move before a major rebound.

  • Dogecoin Analysis: Potential Rally Signals Emerge Amidst Multi-Year Lows, Analysts Weigh In

    Dogecoin Analysis: Potential Rally Signals Emerge Amidst Multi-Year Lows, Analysts Weigh In

    Dogecoin (DOGE) is currently trading below $0.07, a price point not observed in nearly three years. This marks a significant decline from its 2021 all-time high, from which it remains 90% distant. Despite these conditions, several market analysts are pointing to a combination of on-chain activity and historical patterns that suggest a potential for a future price increase.

    On-Chain Activity and Technical Indicators

    The number of active DOGE addresses has seen an uptick, rising from 38,000 in July to 44,000 earlier this month. This increase in network activity, coupled with Dogecoin’s return towards the bottom of its long-term price channel, has led some analysts to interpret these conditions as potentially setting the stage for a significant rally. The weekly TD Sequential indicator for Dogecoin has also reportedly produced multiple consecutive buy signals, which is noted as a potential warning of an upcoming upward price movement.

    Analyst Perspectives and Projections

    Analysts like Ali Martinez, who has over 165,000 followers on the platform X, and Crypto Patel have identified the $0.07 to $0.10 range as a key accumulation zone for DOGE. According to Crypto Patel, a sustained hold within this zone could pave the way for more ambitious price targets. However, some of his long-term projections, such as a target of $4, are considered speculative.

    Popular trader Lucky, with nearly two million followers, has also advised his audience to monitor Dogecoin, suggesting that the cryptocurrency could experience a considerable run in the coming weeks and months. These perspectives highlight a divergence between Dogecoin’s current market performance and the outlook presented by some market observers.

    Risk/Reward and Historical Context

    The current price level of $0.07 is also being viewed by some as an improved risk-reward scenario for potential investors compared to previous periods of higher prices. This is because the asset is significantly below its all-time high, potentially offering a different entry point.

    It is important to note that historical performance is not indicative of future results, and the exact timing and magnitude of any potential rally remain uncertain. While certain indicators and analyst sentiments suggest a positive outlook, the cryptocurrency market is inherently volatile, and Dogecoin’s future price movements are subject to numerous factors. The long-term projections of $1, $2, or $4 for DOGE are speculative and should be viewed with caution.

    Why This Matters

    Dogecoin’s current price action, trading at a multi-year low, presents a point of interest for market observers. The increase in active addresses from 38,000 in July to 44,000 earlier this month, alongside analyst interpretations of technical indicators, may reflect changing conditions in market sentiment. However, the inherent volatility of the cryptocurrency market means that these signals are not guarantees of future performance.

    Broader Context

    The current market analysis for Dogecoin occurs against a backdrop where the initial meme coin enthusiasm has largely subsided. Despite Dogecoin remaining 90% away from its 2021 all-time high, the recent price action and increased network activity are being analyzed by experts for potential future movements, underscoring the speculative nature of cryptocurrency investments.

  • Gen Z’s ETF Trading Grows on Binance, But Cautious Risk Approach Remains

    Gen Z’s ETF Trading Grows on Binance, But Cautious Risk Approach Remains

    Gen Z investors on Binance are increasingly allocating capital to Exchange Traded Funds (ETFs), with ETF trading volume rising to 25.0% of their equity transactions in early August, a significant jump from 14.6% in June. This trend is particularly noteworthy as Gen Z is the only demographic group to experience growth in its ETF holder base, which increased by 2.9% during this period, contrasting with declines seen among Millennials and Gen X. Despite this growing interest in ETFs, Gen Z continues to demonstrate a cautious stance towards leveraged investment products.

    According to a Binance Research report, Millennials directed 9.5% of their equity volume to ETFs in early August. While Gen Z’s ETF holder base expanded, the report also indicated that Gen Z ETF buyers traded less frequently than their Millennial counterparts. In July, Gen Z ETF buyers made an average of 7.9 trades, compared to 10.3 trades by Millennials, suggesting a potentially more passive or long-term investment strategy for ETFs among younger users on the platform.

    Further underscoring Gen Z’s risk-averse approach, leveraged and inverse ETFs constituted a mere 9.25% of their direct-equity turnover in July and 3.93% of their net monthly inflow. By early August, this share decreased to 2.65% of their equity trading volume. The vast majority of Gen Z accounts—88.2% for TradFi-Perps and 96.5% for direct equities—showed no leveraged or inverse activity.

    This behavior occurs within the context of Binance’s recent expansion into direct stock trading, which launched in June 2026. Tokenized US equities rapidly attracted attention, reaching $100 million in assets under management within two weeks. Notably, 47% of this trading activity occurred outside regular US market hours.

    The divergence in ETF holder base trends is clear: Gen Z’s grew by 2.9%, while Millennials’ fell by 4.5% and Gen X’s by 5.9%. This suggests a unique shift in investment preferences among younger demographics on Binance. For unleveraged ETFs specifically, Gen Z’s net equity inflow share rose from 18.5% in June to 21.9% in July, despite a slight 2.0% dip in overall net inflow to these funds during July.

    It is crucial to acknowledge the report’s caveat that “two months is not enough to establish a trend.” The precise timeframe for the growth and decline in ETF holder bases across different demographics is also not explicitly defined. Additionally, ‘snapshot’ data regarding ETF buyer positions, including the number of fund symbols held and the proportion of open positions, lacks specific temporal context.

    Despite the increase in ETF trading volume, Gen Z’s total net equity deployment experienced a 17.4% decrease in July. Within July’s net inflow, single stocks accounted for 20.4% and leveraged products for 28.5%. As the report stated, “Gen Z does not appear to be committing capital to leveraged exposure.”

    Why This Matters

    The materials describe a narrow update: Exchange-traded funds (ETFs) accounted for 25. Whether the observed trend in Gen Z’s ETF trading volume is sustainable, as two months is insufficient to establish a trend.

    Broader Context

    Source materials place the factual news in this context: Binance opened direct stock trading in June 2026.