Tag: Market Trends

  • XRP Wallet Growth Experiences Significant Surge, According to Santiment.

    XRP Wallet Growth Experiences Significant Surge, According to Santiment.

    XRP Sees Strongest Network Growth of the Year, According to Santiment

    XRP experienced one of its most significant network growth spurts of the year, with analytics firm Santiment reporting the creation of 4,300 new wallets within a 24-hour period. This marks the fourth-largest spike of 2024. Santiment highlighted the importance of this development, stating that “network growth is among the top leading signals to identify reversals,” positioning the wallet surge alongside on-chain metrics that suggest XRP is trading in a lower-risk zone.

    Undervalued Setup for XRP

    This data point was also discussed by Santiment’s Brian Quinlivan during a recent livestream. The XRP segment stood out due to a combination of new wallet creation, depressed profitability metrics, and relatively subdued crowd sentiment. Quinlivan noted that XRP’s MVRV setup resembled that of Ethereum, but with a more pronounced long-term drawdown among active holders.

    According to Santiment data cited during the livestream, XRP’s 365-day MVRV was approximately negative 35.12%, while its 30-day MVRV had fallen back into negative territory at roughly negative 3%.

    Quinlivan argued that this combination places XRP in a statistically less overheated position compared to periods when recent and longer-term holders hold substantial unrealized gains. “Again, that golden rule, they’re both below zero, meaning you’d be buying whether you’re doing short or long-term trading at a less risky point than the average moment in XRP’s 11, 12 year history now,” he said.

    He further emphasized the significance of the long-term figure, noting that readings below negative 30% often indicate a point where the average active holder has already absorbed significant losses. “Anything below 30, no matter what asset you’re looking at, that’s something that should provide confidence in your investment because you have something that quantifies how much blood in the streets there is,” he stated. “You can buy knowing that your fellow peers that you’re trading against, you’re not on the same team just because they’re investing in the same asset. You’re buying when those fellow peers have already experienced immense losses that you haven’t because you’d be opening a fresh new entry into XRP.”

    Sentiment Analysis

    Sentiment data further supported this assessment. Quinlivan noted that XRP’s social tone had been “pretty up and down lately,” but was leaning more negative than usual, which Santiment typically views as constructive from a contrarian perspective. The asset was showing about 1.7 bullish comments for every bearish comment, a level that, while seemingly elevated, is below XRP’s typical social baseline, which tends to be closer to a 2-to-1 bullish ratio.

    He added that, excluding an outlier around May 14, XRP sentiment had remained below its typical average for approximately the preceding 10 days. This is significant because, according to Santiment’s framework, excessive bullishness often appears near local tops, while apathy or frustration can emerge near more attractive entry points.

    The livestream also contextualized XRP within a broader altcoin environment. Quinlivan observed that many assets have faced negative sentiment due to their failure to follow Bitcoin into a more convincing rally. He cited the rapid fading of market attention around specific integrations or partnerships if price doesn’t respond, using the XRP-related hype surrounding a Rakuten partnership approximately a month prior as an example of how narratives can lose traction without market confirmation.

    At the time of this report, XRP was trading at $1.36.

  • Ripple Sees Surge in XRP Wallets

    Ripple Sees Surge in XRP Wallets

    XRP Sees Surge in New Wallet Creations, Signaling Potential Market Shift

    XRP experienced a significant increase in new wallet creations, with 4,300 wallets added in the past 24 hours, according to data released by Santiment on May 22. This marks the fourth-largest spike in network growth this year.

    Market Activity and Derivatives

    The surge in wallet creation coincided with XRP trading near $1.37. Simultaneously, derivatives activity on platforms like Binance and CME increased, despite the token’s recent underperformance. This spike in new wallets is noteworthy because network growth often precedes significant price movements, indicating shifts in trader interest.

    Santiment highlighted that the recent wave of wallet creations was one of the largest for XRP in 2026, noting that network growth is a strong indicator of potential market reversals. This data also emerged during a period of heightened activity in the token’s derivatives markets. Open interest (OI) for XRP futures on Binance reached $488 million this month, according to Arab Chain.

    This OI figure is among the highest since March, following a steady increase throughout May. Analysts often interpret rising OI as a sign of traders adding leveraged positions, although it doesn’t necessarily predict market direction.

    Exchange Flows and Price Performance

    Additionally, exchange-flow data from analyst Amr Taha revealed that Binance XRP withdrawals accounted for 53% of transaction share, compared to 47% for deposits. The last time withdrawals reached a similar level was April 10, when XRP was trading around $1.34.

    A higher withdrawal share can suggest that traders are moving tokens off exchanges, potentially to hold them. However, this activity doesn’t automatically signal an upcoming rally; it could simply indicate reduced selling pressure in the short term.

    Despite the increased trading activity, XRP’s price has remained relatively stable. At the time of writing, CoinGecko data showed the asset down 0.3% in the past 24 hours, trading between $1.35 and $1.38. The token is also down 8% over the past week and nearly 5% for the month. Year-to-date losses exceed 43%, leaving the Ripple token more than 62% below its July 2025 all-time high of $3.65.

    Institutional Engagement

    Institutional engagement remains strong. As previously reported by CryptoPotato, CME’s XRP futures products processed approximately $63 billion in notional trading volume during their first year.

    CME launched the contracts in May 2025, offering standard and micro-sized futures tied to the XRP-Dollar Reference Rate. Since then, traders have exchanged roughly 1.32 million contracts, equivalent to 28.6 billion XRP.

  • XRP Dips 8% as Whales Buy 71 Million Tokens

    XRP Dips 8% as Whales Buy 71 Million Tokens

    On-chain data indicates that XRP whales have significantly increased their holdings over the past week, accumulating 71 million coins even as the asset’s price declined.

    Whale Activity and Market Sentiment

    Analyst Ali Martinez recently highlighted this trend in a post on X, focusing on the supply held by large XRP holders, often referred to as “whales.” These entities, possessing substantial XRP holdings, can exert considerable influence on the market. Their actions, while not always directly impacting the asset’s price, often reflect the prevailing sentiment among these major investors.

    The behavior of these whales is tracked through various metrics, including their holdings. A chart shared by Martinez illustrates the recent expansion of XRP whale holdings. Over the past week, these large investors have added over 71 million XRP tokens, currently valued at approximately $97.8 million, to their portfolios. This accumulation occurred while the asset’s price decreased by over 8% during the same period. This timing suggests that these major players may view the price dip as a buying opportunity. Whether this strategy will prove successful remains to be seen.

    Potential for Price Volatility

    In a separate X post, Martinez suggested that XRP may be poised for a volatile move. He pointed to the Bollinger Bands indicator, a tool used to gauge an asset’s volatility. The indicator comprises a 20-day moving average (MA) central line and two bands representing standard deviations above and below it.

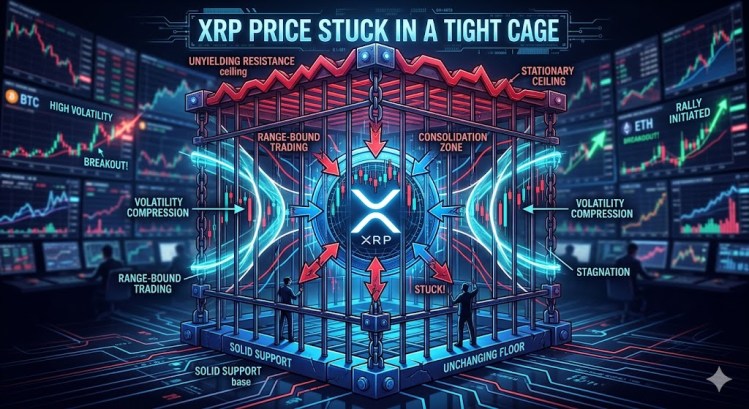
    The chart shows that the Bollinger Bands have recently tightened around the 3-day XRP price, indicating a period of stagnant price action. Martinez noted that the current squeeze is the tightest in over a year. He stated, “When volatility compresses this tightly, it’s a signal that a violent price expansion is approaching.”

    XRP Price Overview

    XRP briefly surpassed the $0.54 mark a week ago, but the price has since retreated, currently trading around $1.37.

  • XRP Price Faces Mounting Breakout Pressure

    XRP Price Faces Mounting Breakout Pressure

    XRP Price Consolidates, Eyes Further Gains

    XRP’s price has begun a recovery, trading above $1.3620 and $1.3650. The cryptocurrency is currently consolidating and could attempt another upward move if it surpasses $1.3840.

    Technical Analysis

    XRP has initiated a recovery wave, trading above the $1.3640 zone. The price is currently below $1.3820 and the 100-hourly Simple Moving Average. A contracting triangle is forming, with resistance at $1.380 on the hourly chart for the XRP/USD pair, according to data from Kraken. The pair could continue its upward trajectory if it settles above $1.3840.

    Potential Gains

    Supported above $1.350, XRP has initiated a recovery wave, mirroring trends seen in Bitcoin and Ethereum. The price has climbed above $1.3580 and $1.3620, entering a short-term positive zone. However, it remains below $1.3850 and the 23.6% Fibonacci retracement level of the downward movement from the $1.5495 swing high to the $1.3465 swing low.

    A contracting triangle is also forming, with resistance at $1.380 on the hourly chart of the XRP/USD pair. The price is currently trading below $1.3750 and the 100-hourly Simple Moving Average.

    If the price moves upward, it may encounter resistance near $1.3780. The primary resistance level is near $1.380. A close above $1.380 could push the price to $1.3840, with the next hurdle at $1.3940. A clear break above the $1.3940 resistance could send the price towards the $1.420 resistance. Further gains could see the price targeting the $1.4480 resistance or the 50% Fibonacci retracement level of the downward move from the $1.5495 swing high to the $1.3465 swing low.

    Potential Decline

    If XRP fails to break above the $1.3840 resistance zone, a fresh decline could ensue. Initial support on the downside is near the $1.360 level. The next major support is near $1.3580. A break below $1.3580 could lead to a further decline towards $1.340. The subsequent major support is near the $1.3380 zone, below which the price could continue to fall towards $1.3250.

    Technical Indicators

    • Hourly MACD: The MACD for XRP/USD is losing momentum in the bullish zone.
    • Hourly RSI: The RSI for XRP/USD is above the 50 level.

    Key Levels

    • Major Support Levels: $1.3600 and $1.3580.
    • Major Resistance Levels: $1.3840 and $1.3940.
  • Zcash Surges to Six-Month High, Eyes $700 Mark

    Zcash Surges to Six-Month High, Eyes $700 Mark

    Zcash (ZEC) has reached its highest level since 2025, but the recent surge is now approaching a significant technical hurdle. While some analysts are observing the first “constructive signs” in months, others are cautioning about potential signs of market exhaustion.

    ZEC Rally Faces Key Barrier

    Zcash has been a leader in the cryptocurrency market amidst recent volatility, gaining over 21% in the past week and 110% over the last 30 days. Throughout May, the cryptocurrency has risen from the $350 level to reclaim the $670 area, reaching a six-month high of $690 on Wednesday.

    Market analyst Ali Martinez highlighted a multi-month horizontal channel that has been forming since October between the $192 and $698 levels. After retesting the channel’s bottom in March, ZEC has jumped approximately 250% towards the upper zone of the channel, nearing a retest of the macro resistance. Martinez stated that the next step “is seeing whether buyers step in hard enough to force a breakout” from the crucial resistance zone.

    However, he noted that Zcash may be showing signs of exhaustion as it approaches the “same resistance zone that triggered a major rejection back in November,” between $700 and $730. According to the analysis, ZEC’s TD Sequential indicator is currently flashing a sell signal on the weekly chart, while momentum indicators “are starting to look stretched again,” making it an important setup to watch.

    Martinez noted that the 250% move from the bottom to the top of the channel was anticipated by a TD Sequential buy signal on the weekly chart, asserting that the correction could be more significant since the sell signal has appeared in the weekly timeframe. He suggested that Zcash could see a 25% correction towards the $500 area as the initial target, adding that a 45% drop towards the $380 support may follow if a deeper retracement occurs. “So, while both HYPE and Zcash remain in strong uptrends, they are also entering zones where risk increases significantly,” he warned.

    Zcash Shows ‘Constructive Signs’

    While the price holds the December highs as support in the weekly timeframe, analyst Rekt Capital pointed out that Zcash is “showing initial Bull Flag tendencies similar to what developed a few weeks prior, with positive pressure building at $528.951.” The market observer affirmed that the recent performance is “the first opportunity to see whether ZEC can hold these levels in a durable way,” adding that “so far the early signs are constructive.”

    Continuing to hold this area would contradict the prior failed retest and suggest a real shift in market dynamics, with buyers willing to accumulate here. He explained that if Zcash continues to retest the $698 resistance and produces shallower rejections, it would signal that the $700 psychological barrier is weakening, which could, over time, open the path for price discovery.

    Nonetheless, he noted that price stability at current levels is crucial, and continued weekly closes above the $530 area would confirm the shift in market dynamics from last year’s attempt. On the monthly timeframe, Rekt Capital affirmed that a close above $514 is also critical, as it marks the three-month resistance zone that capped its breakout attempts between late 2025 and early 2026. “A Monthly Close above it, followed by a successful retest as new support, would be a compelling setup,” he concluded.

  • Analyst Predicts XRP to Capture 31% of Crypto Market.

    Analyst Predicts XRP to Capture 31% of Crypto Market.

    XRP’s Market Dominance Shows Bullish Structure, Analyst Says

    Crypto analyst Will Taylor, known as Cryptoinsightuk on X, believes XRP’s market capitalization dominance still indicates a bullish structure, despite its recent pullback from a key range high. His latest chart of XRP.D suggests a potential long-term move toward 31.26% dominance, significantly above the current level near 3.315%.

    Taylor’s analysis focuses on market structure rather than short-term sentiment. The chart shows XRP dominance holding above a major horizontal level around 3.315% after breaking out from a multi-year range and failing to fully clear the 6.127% area. The weekly setup then compresses into a descending wedge, with Taylor suggesting the retracement has not invalidated the broader breakout.

    “As I look at $XRP.D, I still struggle to feel bearish here,” Taylor wrote. “What I think we’re seeing is: a completed Wyckoff accumulation, a breakout above the major 3.315% resistance, a failed attempt to fully break through the 6.127% range high, then a pullback into a compressed descending wedge.”

    The Path to 31% Market Dominance for XRP

    The chart identifies 6.127% as the next major range high, while 31.26% is marked as a possible upside objective. This implies a significant expansion in XRP’s share of the total crypto market if the analyst’s continuation thesis plays out. This doesn’t necessarily require XRP to rise in isolation; dominance can also increase if XRP outperforms other major crypto assets during a broader rotation.

    Taylor’s analysis centers on the behavior after the failed push through 6.127%. Rather than viewing the rejection as evidence of distribution, he describes the current structure as compression. He believes a decisive bearish breakdown would likely exhibit stronger downside momentum and heavier sell pressure.

    “To me, that matters,” he said. “Because descending wedges are often reversal / continuation structures, especially when they’re paired with diminishing volume. If sellers were truly in control, I’d expect to see expanding downside volatility and aggressive sell volume, not compression.”

    The chart also includes the Relative Strength Index (RSI), which has been trending lower alongside price compression. Taylor argues this does not represent a full structural breakdown. Instead, the indicator appears to be compressing in its own downtrend while XRP dominance holds above the breakout zone. This distinction is central to his thesis. A market that breaks out, rejects at a higher resistance, then consolidates above former resistance can still be considered constructive, provided the former breakout level is defended. In this case, the 3.315% zone is the key reference point. A sustained loss of that area would weaken the continuation argument, while a breakout from the wedge could bring the 6.127% range high back into focus.

    The Wyckoff Thesis

    The Wyckoff labels on Taylor’s chart are central to the bullish reading. The structure marks a long accumulation sequence beginning with preliminary support, or PS, followed by a selling climax and secondary test around the 2020–2021 lows. The subsequent automatic rally, secondary test, and “spring” are presented as the base-building phase before XRP dominance reclaimed higher ground.

    From there, the chart identifies a move over the “creek,” a Wyckoff term often used to describe the transition out of an accumulation range, followed by a sign of strength near the 6.127% range high. The latest pullback is labeled as an LPS, or last point of support, which in Wyckoff analysis is typically watched as a potential higher-low area before continuation. That makes the 31.26% marker more than a loose upside arrow in Taylor’s framing. The chart is effectively arguing that XRP dominance has moved from accumulation into markup, with the current descending wedge serving as a possible consolidation above the breakout zone rather than evidence of failed demand. The bullish case depends on that LPS interpretation holding; if the structure breaks back below the reclaimed 3.315% level, the Wyckoff continuation thesis would become harder to defend.

    Taylor also framed the setup as one that may need a catalyst. “It honestly feels like XRP dominance is waiting for a catalyst before attempting another move higher,” he wrote. “I know this goes against a lot of current sentiment and market interpretation, but I’d genuinely love to hear the bearish argument from here structurally, because right now I still see more signs pointing toward bullish continuation than full distribution.”

    The 31.26% marker gives the chart its most striking implication, but the nearer technical question is whether XRP dominance can continue to hold the reclaimed 3.315% level and resolve the wedge to the upside. For now, Taylor’s read is clear: the structure has pulled back, but in his view, it has not yet broken.

  • Nakamoto Moves to Stabilize Stock Price

    Nakamoto Moves to Stabilize Stock Price

    Nakamoto Sells Bitcoin to Cover Costs Amidst Financial Struggles

    Nakamoto sold 284 Bitcoin on the last day of March to cover operational expenses, according to the company’s first-quarter financial results. This detail highlights the current situation of one of the country’s Bitcoin treasury companies.

    Mounting Losses and Shifting Strategy

    The Bitcoin accumulation strategy that once propelled Nakamoto’s stock above $25 per share has been replaced by selling Bitcoin to manage operating costs. The company reported a net loss of $238 million for the first quarter. Over $102 million of this loss stemmed from a 20% decline in the value of its Bitcoin holdings during the quarter. Despite a 500% increase in revenue quarter-over-quarter, the losses overshadowed these gains.

    Nakamoto currently holds 5,058 Bitcoin, making it the 20th largest corporate Bitcoin holder globally, just behind ProCap Financial. Michael Saylor’s strategy leads the list, holding over 843,000 Bitcoin.

    Reverse Stock Split to Maintain Nasdaq Listing

    The company is now focused on maintaining its listing on the Nasdaq. Last December, Nasdaq issued a warning to Nakamoto after its stock price fell below $1 for 30 consecutive trading days. The deadline to rectify this is June 8. The company’s chosen solution is a 1-for-40 reverse stock split, scheduled to take effect on Friday. Shareholders approved the move at a special meeting earlier this month.

    The reverse stock split will consolidate every 40 shares into one, reducing the total share count from 696 million to 17.4 million. The stock closed at 16 cents on Wednesday, down 7.5% for the day and more than 99% below its price a year ago. A reverse split does not affect a company’s overall market value; it is a structural adjustment designed to increase the price per share above the listing threshold.

    Broader Sector Downturn

    Nakamoto’s challenges are not isolated. Reports suggest that crypto treasury companies have generally experienced a downturn since 2025, with many trading below the value of their assets. Some companies have begun selling their Bitcoin holdings to address debt. For example, Genius Group liquidated its entire 84 Bitcoin reserve in February.

  • Bitcoin Holds Ground Amidst Bearish Sentiment

    Bitcoin Holds Ground Amidst Bearish Sentiment

    Bitcoin Shows Resilience Amidst Bearish Pressure

    Bitcoin continues to demonstrate resilience despite facing mounting bearish pressure below the critical $78,800 resistance zone. Although short-term volatility and repeated rejections have slowed bullish momentum, the overall market structure still indicates an active uptrend, with buyers continuing to defend key support levels and positioning for a potential rebound.

    Bitcoin Finds New Support Around $77,000

    In a recent market assessment, Ultimae highlights that while Bitcoin briefly dipped below the $78,700 support level, the $77,000 zone is currently functioning as the primary defensive floor. This transition suggests that the market is successfully absorbing recent selling pressure, with $77,000 acting as a key technical pivot for bulls to stabilize the price.

    Currently, market participants are closely monitoring the Exponential Moving Average (EMA) as a decisive technical indicator. The asset’s ability to hold above this moving average suggests that short-term momentum is attempting to base, providing a foundation for the next potential move. Should price action result in a clear breach of this immediate support, $75,700 is the next area of interest where liquidity may be gathered. Further downside pressure from that point would bring the $73,500 support into focus, a level that has historically served as a critical zone for institutional interest.

    Despite the recent pullback, Ultimae maintains a distinctly bullish perspective, asserting that Bitcoin’s broader uptrend remains firmly intact. The analyst views the current price decline as a healthy consolidation phase rather than a shift in the longer-term structural trend. To invalidate this upward structure, the price would need to break decisively through the support line of the red box highlighted on the chart. Until that boundary is breached, the current market environment is viewed as constructive. While a minor drift toward $73,500 remains a possibility, the expectation is for a recovery bounce to materialize soon.

    Bitcoin Rebounds Strongly After Triple Retest

    Bitcoin has demonstrated resilience by retesting the 4-hour bullish order block (OB) three times, resulting in a healthy rebound of $1,700 that successfully cleared the $77,400 resistance level. According to analyst Qingtianbtc, this recovery to the $78,300 level and the subsequent move toward the 4-hour bearish OB are well within expected market behavior.

    The current upward movement is interpreted as a temporary relief rally rather than a trend reversal. Investors should anticipate that any push into the $78,300 to $78,800 range will serve as a point of exhaustion before the asset resumes its downward trajectory. Meanwhile, the 4-hour bearish OB, spanning from $78,800 to $79,600, currently acts as a zone of significant resistance, as a sustained breakout above this range remains unlikely in the immediate term.

  • Binance Sees XRP Whale Activity Surge, Contrasting Coinbase Data

    Binance Sees XRP Whale Activity Surge, Contrasting Coinbase Data

    XRP is trading below $1.40, with selling pressure keeping the price within a range that has frustrated investors for weeks. The market is cautious, but an analysis by CryptoQuant, tracking exchange-level flow data, has identified a behavioral divergence between two major crypto venues, adding a structural dimension to the current price action.

    Whale Activity on Binance

    The analysis examines the composition of XRP outflows on Binance, specifically the share of daily withdrawals dominated by transactions exceeding one million XRP, a threshold typically associated with whale-scale activity. This share has climbed to 57.6%, the highest since a 66% spike on March 28. A similar elevated reading appeared in late April, near 60%. These instances of whale withdrawal dominance have all occurred within the $1.33 to $1.42 price zone.

    This repetition creates a pattern that the analysis identifies as structurally significant. XRP’s largest holders are moving coins away from Binance at elevated rates each time the price enters this specific range, not in a single event, but consistently across multiple occasions. Whether this behavior reflects accumulation, repositioning, or preparation for a move is the question the comparison with Coinbase begins to answer.

    Divergence on Coinbase

    The Coinbase data presents a contrasting picture. On Coinbase, the above-1-million XRP outflow category has dropped to 14.8%, its lowest level since April 11. Simultaneously, the mid-sized wallet category of 10,000 to 100,000 XRP outflows has risen from 19% to 36% between April 11 and May 19. Coinbase is not seeing whale dominance in its withdrawals but rather a shift toward smaller and mid-sized participants moving coins, a structurally different behavioral profile from Binance.

    The divergence between the two venues creates a specific analytical signal. Binance is experiencing renewed whale withdrawal dominance at 57.6%, while Coinbase is experiencing the opposite, with its largest outflow category at a six-week low and mid-sized activity increasing.

    The $1.33 to $1.42 price zone, where whale withdrawal dominance has been observed on Binance, is now a key level for XRP traders to monitor. Large holders have become active at this range on three separate occasions, and the current 57.6% reading suggests they are active again.

    The CryptoQuant analysis does not definitively declare the signal bullish or bearish. Whale withdrawals can reflect accumulation, self-custody migration, or repositioning. The data confirms that the largest XRP participants are behaving differently from smaller ones, and they are doing it at a price level they have chosen repeatedly before.

    Technical Outlook

    XRP continues to trade within the same compressed range that has defined price action since March, currently holding near $1.36 after another rejection below the $1.45 resistance area. The daily chart shows a market trapped between weakening momentum and persistent support, resembling accumulation rather than trend continuation.

    The repeated defense of the $1.30–$1.33 region is a key detail. Since the February sell-off, every meaningful retrace into this zone has attracted buyers, preventing a deeper breakdown. Bulls have repeatedly failed to reclaim the 200-day moving average near $1.50, leaving XRP range-bound.

    Volume continues to contract compared to the February sell-off, confirming that volatility and directional conviction have faded. The market appears to be entering a low-liquidity equilibrium phase where both buyers and sellers are waiting for a catalyst. Technically, the current structure remains neutral-to-bearish while the price trades below the major moving averages. However, sustained consolidation above $1.30 keeps the broader base intact. A breakout above $1.45 could trigger momentum toward the $1.60 region, while losing $1.30 would likely expose XRP to another test of the February lows.

  • Chainlink On-Chain Activity Soars as Exchange Supply Dwindles

    Chainlink On-Chain Activity Soars as Exchange Supply Dwindles

    Chainlink has fallen below the $10 mark as the market experiences a potential further downturn, leaving holders facing a price structure that offers little immediate relief. While the decline is evident, a report by CryptoOnchain has identified a development in the network data from earlier this month that provides context for the current price weakness.

    Network Activity Spike

    Between May 9 and 10, Chainlink’s active address count surged to over 280,000, a figure that requires context. The network’s historical baseline is approximately 3,000 daily active addresses. This spike represents a 93-fold increase from that baseline, compressed into a two-day window, with no precedent in Chainlink’s recent on-chain history. This indicates significant activity on the network, far exceeding routine levels.

    In traditional on-chain analysis, such a spike would typically suggest retail panic, large token movements toward exchanges, and preparation for liquidation. The historical pattern for anomalies of this scale is distribution, where large holders and retail participants simultaneously rush to sell, creating selling pressure. However, this assumption does not hold in this case.

    Contrasting Exchange Flows

    The CryptoOnchain report cross-references the network surge with exchange flow data, revealing a different picture. Despite the extreme active address anomaly, Binance’s LINK reserve has been declining steadily for the past 14 days, falling from 86.3 million to 85.8 million tokens. The 7-day average netflow remains heavily negative, with outflows consistently outpacing inflows throughout the entire period.

    Market participants were actively withdrawing LINK from Binance during the period of intense network activity. If the spike in active addresses represented panic selling, the exchange flow data would show coins moving onto exchanges rather than away from them. The data, however, shows coins leaving exchanges.

    Structural Interpretation

    This divergence between network intensity and exchange behavior suggests a structural interpretation rather than a sentiment-driven one. Tokens migrating toward self-custody or being locked in smart contracts, potentially related to CCIP adoption and the expanding use of Chainlink’s cross-chain infrastructure, would produce this pattern: explosive on-chain movement alongside declining exchange reserves and persistently negative netflow.

    The implication is a reduction in the liquid float available for immediate sale. This reduction, occurring alongside genuine network utility growth, creates supply tightness that historically precedes structural price appreciation.

    Price Analysis

    Chainlink continues to trade under pressure after losing the $10 level. The daily chart shows the market trapped within a broader bearish structure, despite signs of stabilization. LINK is currently trading near $9.60 after rejecting sharply from the recent local high around $10.70, where sellers prevented a breakout above the descending resistance zone that has capped price action since January.

    The chart shows LINK consolidating between roughly $8.80 and $10.00 for several weeks, forming a tightening range just above the 200-day moving average. That level near $9.20 is becoming increasingly important because it has acted as dynamic support throughout May. Bulls have repeatedly defended the area, preventing a deeper retracement back toward the February lows near $7.50.

    The 200-day exponential moving average continues trending downward above the current price, reinforcing the idea that the broader macro trend remains fragile despite the recent recovery attempt. Volume has also cooled notably compared to the capitulation phase seen in February, suggesting that the latest decline reflects exhaustion and consolidation rather than panic-driven selling. For bulls, reclaiming the $10.00–$10.70 region remains essential to shift momentum decisively back in favor of buyers.