Tag: Market Trends

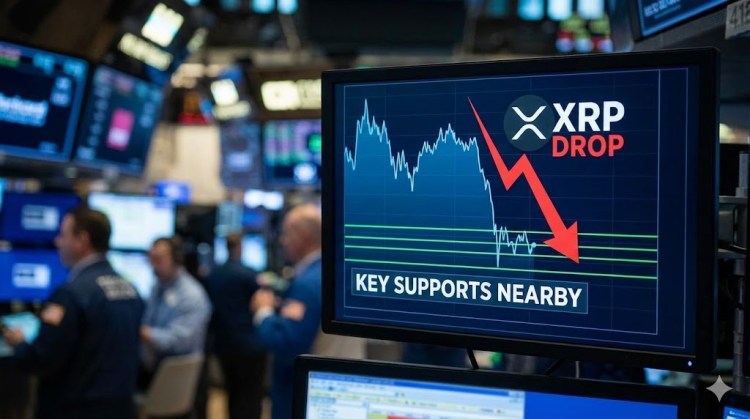
  • XRP Price Stagnates; CNBC Ranks Ripple Higher Than Revolut

    XRP Price Stagnates; CNBC Ranks Ripple Higher Than Revolut

    CNBC has ranked Ripple as the 16th most disruptive company globally, surpassing Revolut, Perplexity, Kalshi, Polymarket, and Canva. However, the price of its associated token, XRP, has declined from its peak earlier in the year.

    CNBC’s Disruptor 50 List

    CNBC’s updated Disruptor 50 list for 2026 identifies Ripple as the only cryptocurrency or blockchain firm to be included, categorizing it as “new money.” The company has risen significantly, moving from 38th place in 2021 to its current position, outperforming both fintech and deep-tech companies.

    Market Sentiment and XRP’s Performance

    Following the announcement, Santiment Intelligence highlighted XRP’s “long-term role in cross-border payments versus replacement by stablecoins or alternative rails” as the primary driver of social volume.

    The total implied valuation of the 50 Disruptor companies reached $2.4 trillion, a substantial increase from $798 billion the previous year, reflecting the current investment in disruptive infrastructure projects.

    Currently, XRP is supported in the $1.30–$1.35 range, where recent lows have been maintained across major aggregators. Resistance levels are around $1.40-$1.42, a level that has consistently capped upward movement. The price structure suggests consolidation within a multi-week range until XRP closes and sustains above $1.50 with significant trading volume.

    XRP ETF and Future Projections

    Despite significant outflows from Bitcoin and Ethereum, the XRP spot ETF has shown positive flows. Community projects anticipate XRP reaching $5 by late 2025, driven by increasing institutional investment. This target exceeds XRP’s all-time high of $3.84.

    XRP investors are hoping for continued positive ETF flows, and a price break above $1.50 with volume could target the $2.50–$3.00 range. Alternatively, consolidation could persist between $1.35 and $1.45 as the market awaits macroeconomic developments.

    XRP’s performance hinges on maintaining its current support levels; a drop below $1.30 could lead to a retest of sub-$1.00 levels. The Clarity Act remains a potential factor that could accelerate either scenario.

    Market Dynamics and Investment Considerations

    While XRP’s CNBC ranking validates its cross-chain payments thesis, the current spot price and substantial market capitalization have narrowed the potential for significant gains. For traders observing XRP’s resistance levels amidst growing institutional interest, the trade-off is between established recognition and early-stage investment opportunities.

    LiquidChain: A Layer 3 Infrastructure Project

    LiquidChain ($LIQUID) is a Layer 3 infrastructure project focused on building a cross-chain liquidity layer. Liquid is developing a single execution environment that integrates liquidity from Bitcoin, Ethereum, and Solana simultaneously.

    This architecture aims to eliminate the multi-step bridging issues that fragment DeFi capital across different ecosystems, a problem that XRP’s payment rails have yet to solve at the smart contract level. With Liquid, developers can deploy once and access all three ecosystems.

    The presale is currently live at $0.01461 per $LIQUID, with $780,000 raised to date, and offers a 1400% APY staking bonus for early investors.

  • Zcash Surges 88% in a Month: Is It the Cycle’s Hidden Gem?

    Zcash Surges 88% in a Month: Is It the Cycle’s Hidden Gem?

    Hayes’s Bullish Outlook on Zcash

    BitMEX co-founder Arthur Hayes has suggested that Zcash (ZEC) could eventually capture 10% of Bitcoin’s market capitalization, signaling a long-term bullish view on privacy coins rather than a short-term price prediction. Given ZEC’s circulating supply of approximately 16 million tokens, this scenario would imply a price in the high four-figure range, roughly $8,000–$10,000, depending on Bitcoin’s valuation.

    Technical Analysis and Price Targets

    From a technical perspective, traders are observing a potential cup-and-handle pattern, although this is a subjective chart formation with no guaranteed outcome. Resistance levels are often cited around $625–$650, with some speculative projections suggesting a move towards $1,000. However, this depends heavily on broader market conditions and is not a confirmed target. This target also aligns with ZEC’s 1.618 Fibonacci extension, calculated from a $745 swing high down to a $185 swing low.

    Privacy Coins Outperform

    ZEC is not alone in its gains. Monero and Dash, both privacy-focused tokens, have also seen positive movement over the past month. However, Zcash leads the pack. Reports indicate the coin climbed more than 80% in 30 days while the total crypto market cap barely moved, increasing just 0.2% over the same period.

    In the past three days alone, ZEC added 18% while the broader market declined by 3%. This divergence has led some traders to suggest that Zcash is experiencing its own bull market.

    Growing demand for financial privacy appears to be the primary driver behind this surge, attracting renewed interest in a coin that had been largely overlooked for years.

    Institutional Interest and Market Sentiment

    Earlier in May, hedge fund Multicoin Capital disclosed its ZEC holdings. Around the same time, Robinhood added the token to its platform, expanding its accessibility to a wider retail investor base. These developments coincided with a growing narrative around privacy coins. Hayes’s comments further amplified this trend. His estimate, based on a market cap comparison to Bitcoin, drew attention, and data indicates that ZEC’s value in Bitcoin terms has risen approximately 20.5% since his remarks.

    Regardless of whether the cup-and-handle pattern materializes, Zcash has demonstrated its ability to perform independently.

  • XRP Metrics Indicate Bullish Turn After Sell-Off

    XRP Metrics Indicate Bullish Turn After Sell-Off

    XRP Exchange Flows Show Shifting Patterns

    XRP exchange-flow activity is exhibiting a new pattern following weeks of consistent deposit pressure primarily on Bybit, according to a recent analysis by CryptoQuant.

    Bybit’s Shift

    Data from the XRP Multi-Exchange Daily Depositing/Withdrawing Transactions Delta indicates that Bybit’s transaction delta returned to near-neutral around May 16, ending a period of strong positive readings that had persisted from mid-April to mid-May.

    Consistent deposit-side activity is often interpreted as a potential sign of selling pressure, as assets transferred to exchanges are generally more accessible for trading or liquidation. This suggests that the pressure has now diminished, based on transaction count data.

    Binance and Coinbase See Withdrawals

    While Bybit’s earlier deposit imbalance appears to have subsided, Binance and Coinbase are now displaying the opposite trend, with withdrawal transactions surpassing deposits on both exchanges. This represents a significant change from the previous exchange-flow structure, which was dominated by Bybit deposits.

    The market dynamics for XRP have therefore shifted, as the broader exchange-deposit activity seen over the past month is no longer prevalent. Instead, exchange behavior now indicates a rotation in flows, with Bybit cooling off while Binance and Coinbase experience increased withdrawal-side activity.

    CryptoQuant noted that the metric tracks transaction delta rather than the total amount of XRP being transferred, meaning it does not reveal the exact volume of tokens entering or leaving exchanges. Nevertheless, the directional change is significant, highlighting a clear shift in transaction behavior across several major trading platforms.

    Technical Indicators Suggest Volatility

    Alongside the changing exchange activity, technical indicators are beginning to suggest a possible increase in XRP volatility.

    Crypto analyst Ali Martinez recently observed that XRP’s Bollinger Bands on the 3-day chart have tightened to their narrowest level in over a year, potentially signaling a major price movement ahead. The crypto asset has been trading between $1.29 and $1.50 for months. Martinez stated that a close above $1.50 could push XRP toward $1.80, while a drop below $1.29 may trigger deeper downside pressure.

    Institutional Inflows

    On the institutional side, XRP appears to have defied market panic. As reported by CryptoPotato, even as investment products dedicated to Bitcoin and Ethereum faced significant sell pressure, XRP managed to attract inflows of over $67 million last week.

  • Bitcoin Rally Fueled by Short Squeeze, $70,000s Possible.

    Bitcoin Rally Fueled by Short Squeeze, $70,000s Possible.

    Bitcoin’s Rally Fails Macro Test, Says Wintermute

    Wintermute has stated that Bitcoin’s recent rally has failed its first major macroeconomic test, arguing that the price increase was driven more by leverage and short covering than by sustained spot demand. In its May 18 market update, the trading firm attributed the sharp reversal across digital assets to factors including persistent inflation, rising Treasury yields, ETF outflows, and renewed expectations of interest rate hikes.

    “Last week we said we’d find out fast what kind of rally this was. We found out,” Wintermute wrote. “BTC failed at the 200-day on the first real macro shock, which tells you it was the squeeze driving it all along.” The firm’s analysis framed the week as a macro-driven repricing of assets.

    April’s Consumer Price Index (CPI) came in at 3.8% year-over-year, exceeding the 3.7% consensus estimate, while core CPI rose 0.4% month-over-month. Wintermute noted that the inflation shock has become more difficult for markets to ignore, pointing out that the prolonged energy shock is now impacting core inflation and that real wages turned negative for the first time in three years.

    Market Reacts to Inflation Data

    Markets reacted swiftly to the economic data. The 10-year Treasury yield increased by 28 basis points during the week, reaching 4.58%, its highest level since September 2025. Furthermore, fed funds futures reversed expectations of rate cuts for 2026 and began pricing in a 44% chance of a rate hike by December, up from 22.5% a week earlier. Wintermute observed that the market narrative shifted from “when do they cut” to “do they hike” in just five trading days.

    This repricing negatively impacted long-duration assets. Wintermute reported that 20-year-plus Treasuries fell 2.8%, while gold declined 3.8% despite the prevailing geopolitical backdrop. Brent crude rose 8.6%, leading the firm to conclude that “the only things that worked were the things causing the problem.”

    Bitcoin’s Price Action and Liquidation

    Bitcoin briefly surpassed $82,000 following the CLARITY Act vote but subsequently reversed sharply, closing Friday near $78,000, a 5.7% decrease for the week. The weekend slide towards $77,000 triggered $657 million in liquidations, including $584 million from long positions. Ethereum underperformed even more, falling 10.2% during the week.

    Wintermute noted that ETH continued to weaken in both spot and derivatives markets, with ETH/BTC trading at 0.0275, funding rates softening, and relative implied volatility increasing. The firm described ETH as the “wrong asset for this macro.”

    ETF Outflows and Institutional Selling

    ETF flows also turned negative. Bitcoin spot ETFs recorded $1 billion in outflows for the week, ending six consecutive weeks of inflows, while ETH ETFs saw $255 million in outflows. Wintermute cited Glassnode data indicating that institutions were “selling into strength,” with the seven-day moving average of net flows at negative $88 million per day, the weakest level since mid-February. “When leverage is the marginal buyer, the unwind is fast,” Wintermute wrote.

    Technical Outlook and Key Levels

    Bitcoin remains below its 200-day moving average near $82,200, having been rejected five times this month, according to Wintermute. The immediate support zone is between $76,000 and $78,000. A break below $75,000 could potentially lead to a decline towards the $70,000 to $72,000 range.

    Wintermute acknowledged the broader structural case for Bitcoin, noting that exchange reserves remain near multi-year lows, long-term holders continue to accumulate, and the CLARITY Act is progressing. The firm also highlighted that tokenized Treasuries reached $15 billion on-chain, identifying this segment as an area of continued growth.

    However, Wintermute emphasized that short-term flows are currently more significant than the structural narrative. “The flow data shows institutions used the rally to take profit rather than add, and in the short term that matters more than the structural story,” the firm wrote.

    The next test, according to the update, is whether Bitcoin can hold the $76,000 to $78,000 area through Nvidia earnings on Wednesday, May 20. A hold would “rebuild some confidence,” Wintermute said, but a break below $75,000 with funding resetting and ETF flows negative could bring the low $70,000s back into view quickly. At press time, BTC traded at $77,297.

  • XRP Faces Resistance After $1.50 Rejection, Possible Drop to $1.

    XRP Faces Resistance After $1.50 Rejection, Possible Drop to $1.

    XRP Struggles to Maintain Key Support as Analysts Weigh Potential Price Movements

    As XRP attempts to hold a critical support level, analysts are scrutinizing key indicators that could determine whether the recent price decline is temporary or the start of a more significant correction.

    Technical Indicators Signal Caution

    XRP continued its recent downward trend on Tuesday, falling to approximately $1.35, its lowest point since late April. The cryptocurrency has been trading between $1.36 and $1.50 for the past month, repeatedly attempting to break above the upper boundary. Last Thursday, the altcoin briefly surpassed this key resistance level, reaching a two-month high of $1.54, driven by developments related to the CLARITY Act. However, the price was quickly rejected from this level, resulting in a roughly 12% drop over the past five days.

    Market analyst ChartNerd observed that XRP risks further price correction towards new lows as the altcoin retests the $1.35 area, stating that “the data speaks for itself.” The analyst pointed to several concerning signals, including significant resistance levels above and the confirmation of a “death cross” on the weekly Stoch RSI.

    ChartNerd highlighted the weekly 20 and 50 EMAs, currently at $1.50 and $1.80, as crucial resistance levels that have not been retested since their January 2026 crossover, which preceded XRP’s decline to its February low of $1.11. He also noted that the weekly Stoch RSI crossover has historically marked local tops for XRP, with the last two crosses leading to deeper corrections. The most recent crossover coincided with the relief rally that preceded the weekly EMA death cross four months ago.

    Following the recent rally to $1.54, the price has now retested the weekly 20 EMA for the first time since the January crossover. ChartNerd suggested that failure to break above this level and establish it as sustained support “will likely open the next leg down later this year.”

    Potential Price Targets and Market Sentiment

    ChartNerd emphasized that XRP must reclaim both EMAs and convert them into support to invalidate the bearish outlook, but added that “it just doesn’t feel like the right time yet.” Even if the altcoin rallies towards $1.80, the analyst believes the price will likely fail to hold that level long-term and “at least come back to, at a minimum, fill in most of this wick back down towards the lower dollar levels.” He explained that a rejection from these EMAs could potentially push the altcoin towards a cycle bottom of $0.70, a previous level of macro resistance that has not yet been retested.

    Meanwhile, analyst Ali Martinez believes XRP is poised for a significant price movement. He noted that the altcoin has been developing the “tightest Bollinger Band squeeze” on the three-day chart in over a year, describing the current compression zone as a “definitive ‘no-trade zone.’” Martinez indicated that such tight volatility compression often precedes a “violent price expansion.” He advised investors to await a clear three-day candlestick close outside of XRP’s current range, between $1.29 and $1.50, to confirm the next major trend direction. A close above the upper boundary would likely signal an expansion towards $1.80. Conversely, a breakdown below the lower boundary would invalidate the immediate bullish structure and potentially lead to a deeper correction towards the $1.00 psychological support level.

  • XRP Price Faces Further Downside Risk

    XRP Price Faces Further Downside Risk

    XRP Price Dips Below $1.40

    The price of XRP has continued its downward trend, trading below $1.40. The cryptocurrency is currently consolidating losses and facing resistance levels at $1.3650 and $1.3940.

    Technical Analysis

    XRP began another decline, falling below the $1.40 mark. It is now trading below $1.3880 and the 100-hourly Simple Moving Average. A bearish trend line is forming, with resistance at $1.3720 on the hourly chart of the XRP/USD pair, according to data from Kraken. The pair could continue to decline if it remains below $1.40.

    XRP failed to maintain its position above $1.4150 and extended its decline, mirroring the trends of Bitcoin and Ethereum. The price dropped below $1.4050 and $1.40, entering a short-term bearish zone and even extending losses below $1.380. A low of $1.3464 was established, and the price is currently consolidating losses well below the 23.6% Fibonacci retracement level of the downward move from the $1.5495 swing high to the $1.3464 low.

    The price is trading below $1.3880 and the 100-hourly Simple Moving Average. If a recovery occurs, the price may encounter resistance near the $1.3650 level. A bearish trend line is also forming, with resistance at $1.3720 on the hourly chart of the XRP/USD pair. The initial major resistance is near the $1.380 level, with the primary resistance at $1.3940. A close above $1.3940 could potentially push the price towards $1.40. The next hurdle is at $1.4250, which is also the 50% Fibonacci retracement level of the downward move from the $1.5495 swing high to the $1.3464 low. A clear move above the $1.4250 resistance could drive the price towards the $1.440 resistance, with further gains potentially leading to the $1.450 resistance.

    Potential for Further Losses

    If XRP fails to surpass the $1.40 resistance zone, a fresh decline could be triggered. Initial support on the downside is near the $1.3465 level, with the next major support near $1.3350. A break below $1.3350 could lead to a further decline towards $1.3220. The subsequent major support is near the $1.320 zone, below which the price could continue to fall towards $1.3120.

    Technical Indicators

    • Hourly MACD: The MACD for XRP/USD is gaining momentum in the bearish zone.
    • Hourly RSI (Relative Strength Index): The RSI for XRP/USD is currently below the 50 level.

    Key Levels

    • Major Support Levels: $1.3465 and $1.3350.
    • Major Resistance Levels: $1.3720 and $1.3940.
  • XRP Eyes Potential Rally Above $1.50

    XRP Eyes Potential Rally Above $1.50

    XRP Faces Critical Juncture Amidst Consolidation

    XRP is approaching a pivotal moment as its price action consolidates within a significant range, sparking speculation of an imminent breakout. With bullish momentum gradually building, analysts believe a decisive move above the key resistance level of $1.50 could trigger a substantial rally, potentially leading to higher targets in the coming sessions.

    Bollinger Band Squeeze Suggests Potential for Volatility

    Crypto analyst Ali Charts suggests that XRP may be on the verge of a major breakout, as volatility continues to tighten across higher timeframes. According to the analyst, the Bollinger Bands on XRP’s 3-day chart are experiencing their tightest squeeze in over a year, a condition often preceding a sharp expansion in price movement.

    Despite the growing anticipation, Ali Charts describes the current setup as a no-trade zone, advising traders to avoid premature positions until the market confirms its next direction with a decisive breakout. The analyst is closely monitoring the $1.50 and $1.29 levels for confirmation. A clear 3-day candlestick close above $1.50 would likely initiate an upward rally toward a primary target around $1.80, indicating that buyers have regained strong control of momentum.

    On the downside, Ali warns that a close below $1.29 would weaken the current bullish structure and increase the likelihood of a deeper correction toward the key psychological support near $1. He stresses the importance of patience, noting that waiting for the Bollinger Bands to break before entering trades offers a favorable risk-to-reward opportunity.

    XRP Remains Within a Broad Corrective Triangle

    XRP is currently navigating a broad, corrective triangle structure following a failed attempt at an upside breakout. More Crypto Online highlights that the recent price action lacks the necessary impulsive characteristics, suggesting the asset remains locked within a wide, range-bound environment.

    The preferred technical scenario allows for the continued development of this larger triangle formation, which may eventually support another move higher as part of a developing C-wave. Primary resistance clusters are located at $1.55, $1.60, and $1.66, serving as potential ceilings for the move. Conversely, the structural integrity of this triangle weakens significantly should the price breach the critical support threshold of $1.28. Before reaching that level, the next support is around $1.30, followed by a deeper liquidity zone situated between $1.26 and $1.16, which serves as the ultimate range support.

    XRP continues to oscillate within this corrective range. While an upside extension remains a possibility, the market has yet to demonstrate a convincing, impulsive breakout. The onus is on the bulls to initiate a definitive trend shift above current resistance levels.

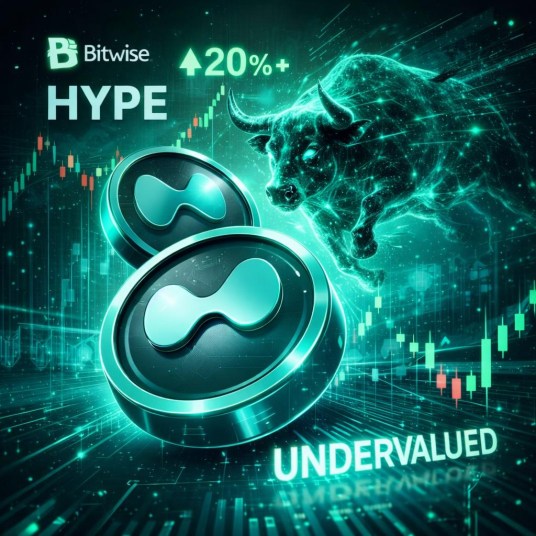
  • Bitwise: Hyperliquid’s HYPE Token Undervalued After 20% Surge

    Bitwise: Hyperliquid’s HYPE Token Undervalued After 20% Surge

    Bitwise CIO Bullish on Hyperliquid and HYPE Token

    Bitwise Chief Investment Officer Matt Hougan expressed a strongly bullish outlook on Hyperliquid and its native token, HYPE, shortly after Bitwise launched a HYPE exchange-traded fund (ETF) last week. Hougan argued that the market is undervaluing Hyperliquid’s broader business model, treating it as merely another perpetual futures venue.

    Hyperliquid as a Global Super App

    Hougan believes Hyperliquid is experiencing a “pricing error,” with investors valuing the platform primarily as a perpetual futures exchange. In contrast, he views Hyperliquid as a global financial “super app,” expanding beyond crypto into areas such as stocks, commodities, foreign exchange, and prediction markets.

    As part of his valuation, Hougan estimated the platform’s annual revenue could reach $800 million to $1 billion, suggesting significant growth potential beyond its current market categorization. A key element of Hougan’s argument is Hyperliquid’s fee model, where 99% of trading fees are allocated to HYPE token buybacks. He described this as a mechanism that supports value, unlike revenue extraction without token-linked benefits. This, he said, aligns incentives differently than investors may assume when viewing Hyperliquid as a standard trading platform.

    HYPE Approaches All-Time Highs

    Hougan emphasized that HYPE’s recent performance does not alter his view that the token remains undervalued. He noted that HYPE is up 77% this year, yet he believes the market hasn’t fully recognized Hyperliquid’s long-term trajectory. In his view, Hyperliquid’s opportunity lies not only in growing as a crypto perpetual exchange but also in evolving into a broader trading super app encompassing stocks, pre-IPO assets, commodities, prediction markets, and crypto assets.

    These bullish remarks follow increased interest in HYPE, fueled by ETF activity. Along with Bitwise’s launch of a Hyperliquid ETF tied to HYPE, 21Shares introduced its own HYPE ETF earlier in the month. Following these launches, HYPE surged, recording gains of nearly 20% in the past week. At the time of writing, HYPE was trading just above $48, only 18% below its all-time high of $59 reached last year.

  • XRP Hodlers Divided as ETF Hopes Fade, $27 Target Remains.

    XRP Hodlers Divided as ETF Hopes Fade, $27 Target Remains.

    XRP Price Faces Conflicting Signals Amid Market Uncertainty

    The price of XRP is currently trading below its support level, creating a divergence between short-term technical indicators and long-term price predictions. This situation presents a complex outlook for the cryptocurrency, with both bearish and bullish arguments supported by available data.

    Bearish sentiment is fueled by XRP’s position below all major moving averages. Data reinforces this, with market sentiment registering 89% bearish and a Fear & Greed score of 39. Furthermore, institutional demand for Exchange Traded Funds (ETFs) has cooled, removing a key argument for near-term price increases.

    The broader market environment, led by Bitcoin, is also contributing to the uncertainty. Risk-off behavior is evident, with 30-day volatility exceeding 3%, indicating potential panic selling. Sentiment has retreated from early-year highs, leaving XRP caught between opposing forces.

    Technical Analysis and Price Levels

    At $1.38, XRP is currently at its immediate support level. Resistance begins at $1.40, with a more significant ceiling at $1.45, representing a potential 5% increase from the current price.

    The Relative Strength Index (RSI) on the daily chart is approximately 42, indicating a neutral position but trending toward oversold territory. The weekly RSI is already in oversold territory, around 38. This divergence often precedes a sharp reversal or extended consolidation period.

    Potential Scenarios

    If XRP can surpass the $1.45 resistance level with increased trading volume and daily Exponential Moving Averages (EMAs) begin to compress, momentum could shift, potentially driving the price toward $1.65–$1.80 in the coming weeks. Regulatory developments could accelerate this upward movement.

    Alternatively, the price may consolidate within the $1.35–$1.45 range for an extended period as the market awaits a new catalyst. The weekly oversold reading could limit any further price declines.

    CoinLore’s 10-day forecast projects relatively stable price action around current levels. The current market conditions suggest that patience may be the most prudent approach.

    Market Dynamics and Alternative Investments

    As a blue-chip asset, XRP’s recent performance, including a 5% weekly decline while trading below major moving averages, has prompted some traders to explore earlier-stage investment opportunities. This shift is not necessarily a reflection of a broken XRP thesis but rather a response to the compressed near-term risk/reward profile.

    This rotation has drawn attention to presales with asymmetric structures, such as Maxi Doge ($MAXI). Maxi Doge is a meme token on Ethereum, built around the “Leverage King” trading culture.

    The presale has raised over $4.7 million at a current price of $0.00028, with a 65% Annual Percentage Yield (APY) staking bonus for early participants. Features include holder-only trading competitions with leaderboard rewards and a dedicated Maxi Fund treasury.

  • Perplexity AI Forecasts Surprising Solana Price in Six Months

    Perplexity AI Forecasts Surprising Solana Price in Six Months

    Solana Price Predictions

    Several major payment processors, including Visa, PayPal, and Stripe, are integrating with Solana, a development that has prompted price predictions from Perplexity AI. The AI model forecasts a significant price increase for Solana (SOL) within the next six months.

    Perplexity AI’s base prediction estimates a price range of $220 to $250 by November 2026, with a potential rise to $400 if market sentiment remains positive. This bullish outlook is based on real-world adoption metrics, particularly Solana’s higher daily active user count compared to Ethereum.

    Institutional Adoption and Market Dynamics

    The integration of live payment infrastructure by Visa, PayPal, and Stripe signifies established institutional legitimacy for Solana. Furthermore, Bitwise projects substantial inflows into spot SOL ETFs in 2026, which would necessitate the purchase of SOL.

    These factors, combined with a user base exceeding Ethereum’s, are expected to create a supply squeeze, driving up the price.

    Potential Risks and Bearish Scenarios

    The primary risk to Solana’s price is the potential for network outages. Regulatory uncertainties surrounding ETF approvals and competition from other Layer 1 blockchains could also hinder growth. Perplexity AI’s downside prediction is $150 to $170 if macro headwinds worsen.

    Current Market Analysis

    Solana is currently trading at $84.54. The price chart shows a pattern of a sharp peak, followed by a decline and a period of consolidation. After peaking at $255 in August 2025, the price fell to $70 in February 2026 and has since been trading in a $75 to $100 range.

    The immediate challenge is the recent pullback from $100 to $84. Resistance levels are at $90 to $95, $100, $120, and $150. Support levels are at $78 to $82, with a potential drop to $70 if that support fails.

    Broader Market Context

    Bitcoin and Ethereum are experiencing limited upside, while XRP has been stagnant. This has led to capital seeking opportunities in less-established projects with smaller market capitalizations.

    LiquidChain and Cross-Chain Liquidity

    One such project is LiquidChain, a Layer 3 execution environment designed to connect Bitcoin, Ethereum, and Solana. It aims to solve the problem of cross-chain liquidity by providing a single deployment, full ecosystem access, and zero bridging overhead. The presale price is $0.01454, with approximately $700,000 raised.

    The post Perplexity AI Predicts Unexpected Solana Price in 6 Months appeared first on Cryptonews .