Tag: Market Trends

  • Lisk (LSK) Surges 325% Daily Amidst Bitcoin’s Range-Bound Trading Near $77,000

    Lisk (LSK) Surges 325% Daily Amidst Bitcoin’s Range-Bound Trading Near $77,000

    The cryptocurrency market is currently characterized by a significant divergence in performance, with Lisk (LSK) experiencing a notable 325% surge in a single day, while Bitcoin (BTC) has maintained a consolidated trading range between $77,000 and $77,400 over the weekend. This contrast underscores shifting investor focus and evolving market dynamics, particularly in the wake of recent macroeconomic data releases.

    Lisk (LSK) has posted an extraordinary daily gain of 325%, reaching $0.82, and an even more striking 800% surge over the past week. This performance sharply contrasts with Bitcoin’s consolidation. According to CryptoPotato, Bitcoin’s market capitalization has dipped below $1.550 trillion on CoinMarketCap, with its dominance over altcoins standing at 58.7%.

    Bitcoin’s price action over the past week has been notably volatile, influenced by economic indicators. In the first week of September, Bitcoin reached a high of $82,400 before a Friday drop below $79,000, following the US jobs report. The subsequent week saw Bitcoin trading between $80,000 and $77,600. A further dip occurred on a Thursday, with Bitcoin slipping to $77,000. The release of August’s CPI numbers initially drove Bitcoin down to $76,000, a multi-week low. However, it recovered to $79,800 within an hour, only to face another rejection and return to the $77,000 level. Since then, Bitcoin has traded sideways between $77,000 and $77,500.

    Other major altcoins have shown mixed results. Ethereum, after reaching nearly $2,700 on Friday, is now contending to remain above $2,500. BNB has experienced a 1.3% daily decline, trading at $722, while XRP remains significantly below the $1.40 level. SOL, TRX, DOGE, XMR, and LINK are also reported to be slightly down. Conversely, smaller gains were noted in RAIN (over 2%), CRO (3%), PUMP (6%), and BTW (11% to over $0.55).

    The total cryptocurrency market cap is approximately $2.640 trillion on CoinMarketCap, showing minimal change from the previous day. The substantial gains in Lisk (LSK) against Bitcoin’s consolidation and the broader market’s reaction to economic data suggest a complex and segmented crypto landscape. The specific drivers behind Lisk’s significant surge and the sustainability of its performance are points of ongoing observation, as is the market’s continued response to macroeconomic factors.

    Why This Matters

    The materials describe a narrow update: Lisk (LSK) surged by 325% daily and 800% weekly. The exact timing of the CPI numbers release relative to the Thursday drop.

    Broader Context

    Source materials place the factual news in this context: Similar to the previous weekends, this one is quite sluggish for bitcoin.

  • XRP Consolidates Within Descending Channel; Key Support and Resistance Levels Under Scrutiny

    XRP Consolidates Within Descending Channel; Key Support and Resistance Levels Under Scrutiny

    XRP’s price is currently navigating a descending channel, a pattern indicating consolidation rather than a clear directional trend, leaving its immediate future uncertain. This pattern follows a significant surge in August, which saw XRP’s price climb from around $0.99 to over $1.50. Since then, XRP has formed a series of lower highs, suggesting a corrective price action.

    According to the analysis, XRP is presently trading around $1.37, testing a near-term support zone identified between $1.33 and $1.34. While buyers have shown some defense of this area, leading to modest rebounds, the momentum has not been sufficient to break the sequence of declining highs. The data suggests this consolidation places the market at an important juncture.

    Key Technical Levels Dictate Trajectory

    Technical indicators point to several key levels that may likely dictate XRP’s short-to-medium term trajectory. On the downside, if the $1.33-$1.34 support zone fails, the next significant area of interest is around $1.26. This level aligns with the 0.618 Fibonacci retracement and a moving average, forming part of a broader support zone between $1.22 and $1.27. As per the report, losing this $1.22-$1.27 area would represent a more significant deterioration in market structure, potentially exposing deeper support around the $1.09-$1.13 zone.

    On the upside, XRP faces resistance. The upper trendline of the descending channel is approaching the $1.40-$1.42 region, acting as dynamic resistance. To amid reported market activity in the corrective trend, XRP would need to break above this descending trendline and achieve acceptance above the $1.40-$1.42 zone. Further recovery would then require navigating the $1.45-$1.50 resistance area before challenging the major resistance zone located between $1.61 and $1.70.

    Current Price Action Remains Corrective

    The current price action remains corrective rather than decisively bullish, according to the analysis. Buyers have yet to generate enough momentum to overcome the pattern of lower highs established since the August peak. A rejection from the current trendline would likely keep the descending structure intact, potentially leading to revisits of the channel’s lower boundary, which converges with the $1.22-$1.27 support zone.

    The analysis suggests that while XRP is consolidating, its price action is dependent on holding key support levels and breaking through resistance zones. The immediate outlook remains uncertain, with no definitive bullish or bearish signal yet established. The market is at a critical juncture, and the defense of the $1.33-$1.34 support will be a key indicator of near-term sentiment. A notable move above the descending trendline and subsequent acceptance above the $1.40-$1.42 zone would be the first meaningful indication that the correction is losing strength, according to the analysis.

    Why This Matters

    The materials describe a narrow update: XRP experienced a surge in August, reaching above $1.50 from around $0.99. Whether buyers can regain control and establish a clear direction remains uncertain.

    Broader Context

    Source materials place the market analysis in this context: Ripple’s XRP has yet to establish a clear direction after its August surge, with repeated rebounds being capped before buyers can regain control.

  • ETH Surges Past $2.5K, $3K Target in Sight

    ETH Surges Past $2.5K, $3K Target in Sight

    Ethereum is attempting to convert its post-rally consolidation into a continuation setup. The cryptocurrency remains compressed near the upper end of its trading range, and a sustained breakout could pave the way for another bullish leg. However, a recent Consumer Price Index-driven false breakout underscores the need for confirmation.

    Daily Timeframe Analysis

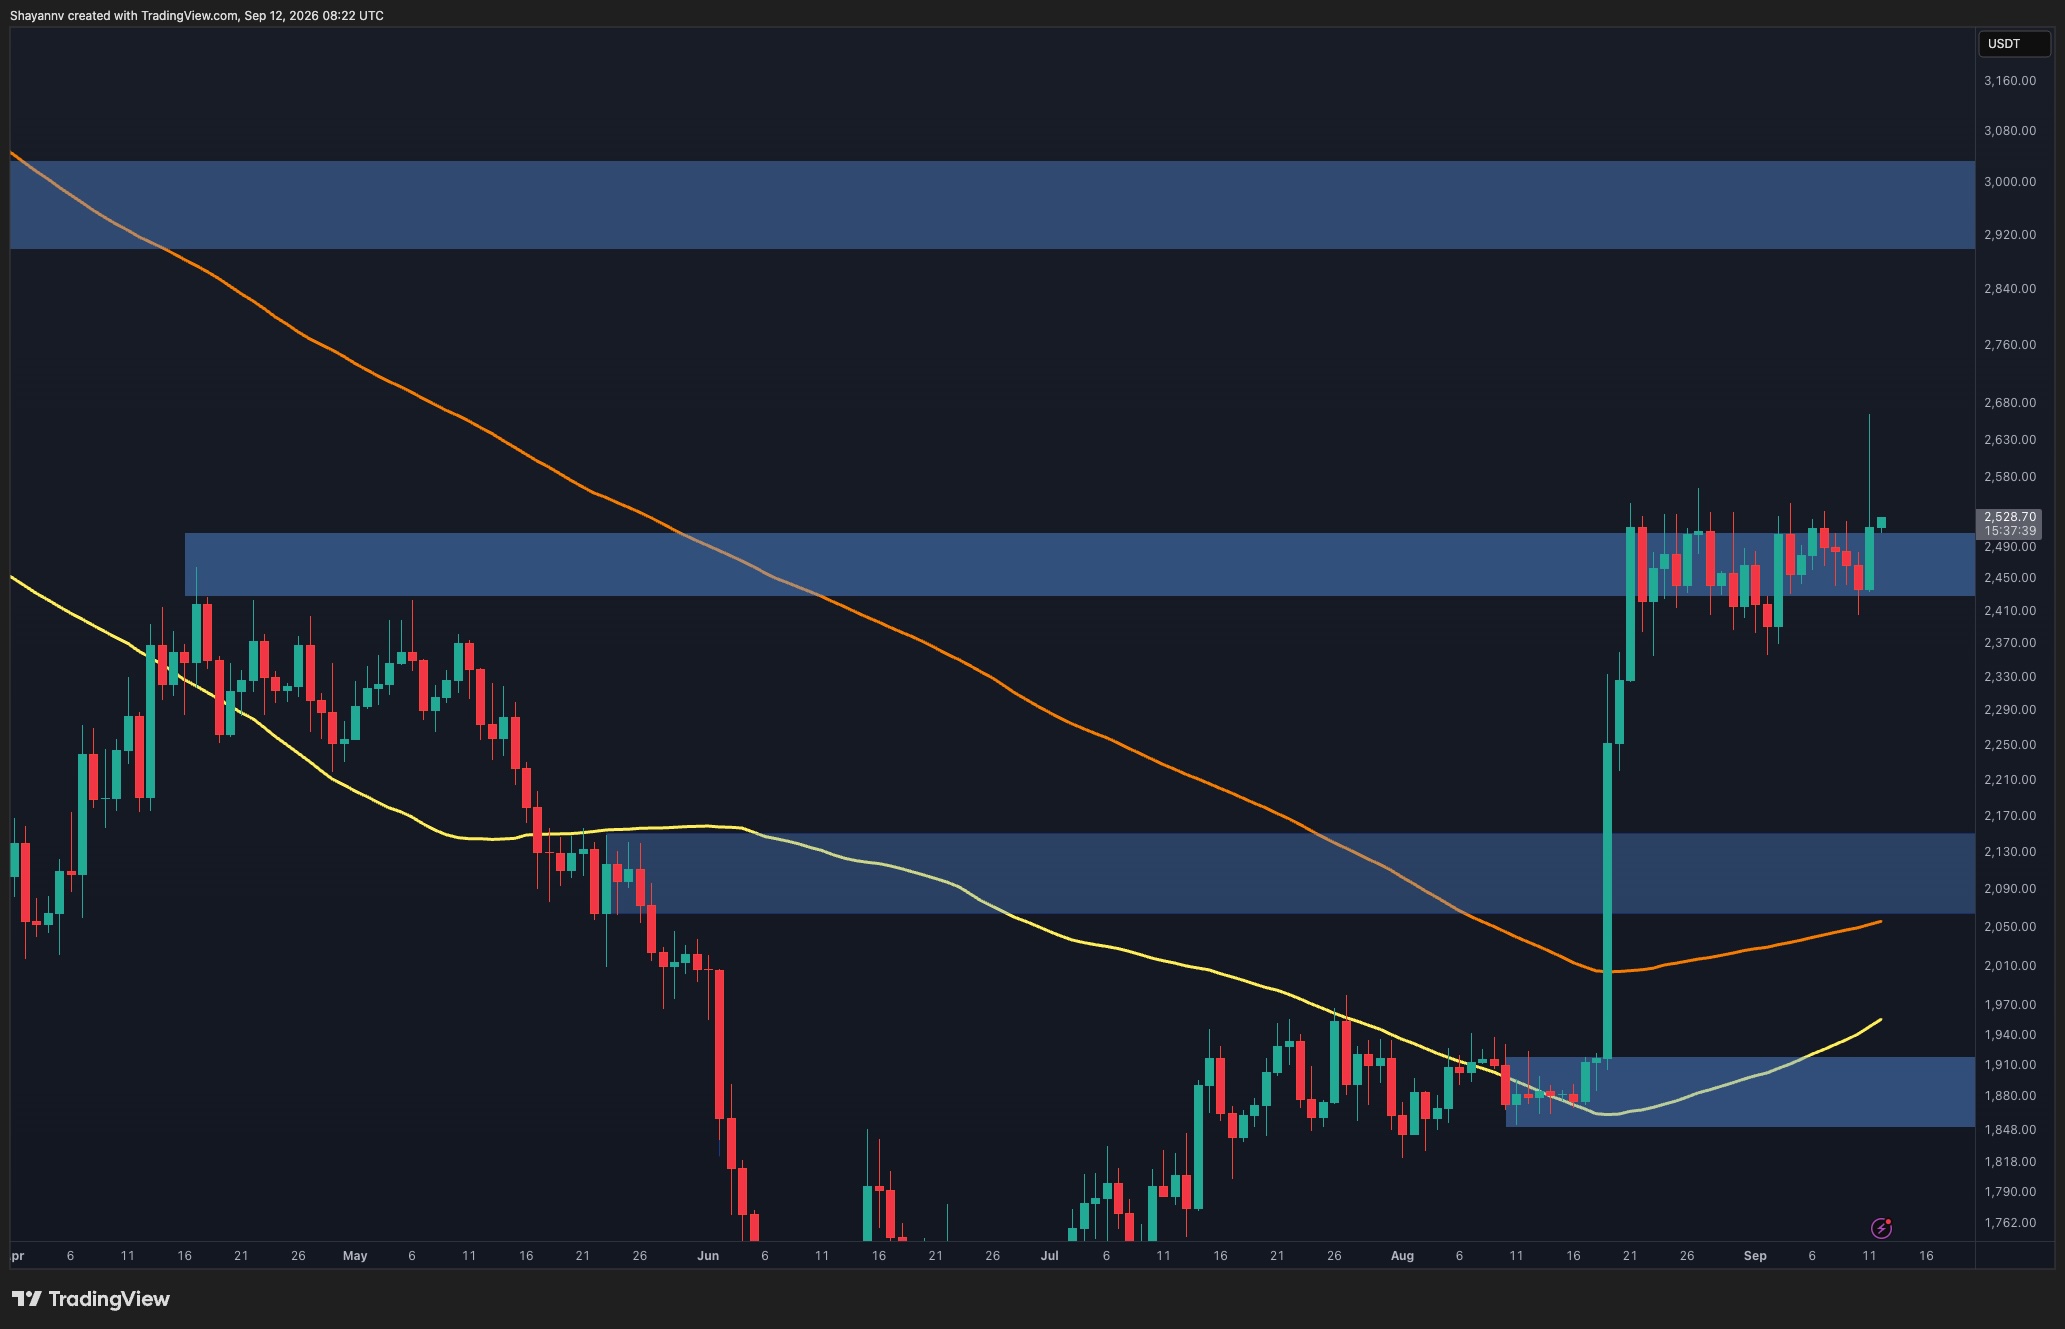
    On the daily chart, Ether (ETH) continues to hold the substantial gains achieved during its explosive August breakout. Crucially, the market has avoided a significant retracement despite repeated tests of the $2.43K-$2.52K area. This suggests that sellers have so far been unable to force prices back toward lower support zones.

    The current consolidation is occurring around the $2.45K-$2.52K resistance zone, with ETH trading near $2.52K. A convincing daily breakout and close above this region would bolster the bullish structure and could open the door to higher prices. In such a scenario, the next major resistance level visible on the chart is situated around the $2.92K-$3.03K zone.

    However, the market must first establish acceptance above the current resistance. Failure to do so would leave ETH vulnerable to further rotation within the existing range. The $2.05K-$2.14K region represents the next significant daily support area below, with moving averages also gradually trending upward beneath the price.

    Four-Hour Chart Insights

    The four-hour chart offers a clearer perspective on the immediate breakout attempt. ETH has spent several weeks trading within a range of roughly $2.35K to $2.56K, repeatedly encountering rejections at both ends without establishing a sustained directional move.

    The most recent CPI-driven volatility briefly pushed the price above the $2.56K range high, with a wick extending toward $2.66K. However, buyers were unable to sustain the breakout, and ETH quickly retreated back within its established structure. This false breakout is significant, as it demonstrates that simply trading above the range is insufficient. The market needs to hold above the $2.56K resistance level to confirm a genuine structural breakout.

    Nevertheless, ETH has recovered toward the upper boundary once more, rather than experiencing a sharp rejection. If buyers can secure acceptance above $2.56K, the consolidation could resolve into another bullish leg.

    Conversely, another rejection would keep the range intact and initially expose the $2.43K-$2.45K support zone. A more decisive breakdown below the range floor around $2.35K would weaken the continuation scenario and could shift attention toward the $2.22K-$2.27K support zone.

    Spot Taker CVD Analysis

    The 90-day Spot Taker CVD (Cumulative Volume Difference) tracks the cumulative difference between market buy and market sell volume. An increasing positive CVD indicates dominance by taker buyers, while a declining negative reading reflects stronger aggressive selling.

    The latest data reveals a notable shift toward positive readings, indicating that taker buyers have regained dominance after more neutral conditions were observed during July and early August. This transition has coincided with ETH’s recovery toward the $2.5K region and serves as a constructive signal for the current consolidation.

    If taker-buy dominance persists while ETH establishes itself above the range resistance, the combination would provide stronger confirmation that demand is supporting another bullish leg. A loss of this buy-side dominance, particularly alongside another failed breakout, would instead suggest that aggressive demand is not yet robust enough to sustain the upward move.

  • XRP Price Consolidation: Key Catalysts and Technicals Shape Uncertain September Outlook

    XRP Price Consolidation: Key Catalysts and Technicals Shape Uncertain September Outlook

    XRP is currently consolidating in the low-$1.30s, a period characterized by market indecision as participants await crucial catalysts. These include a significant regulatory decision, potential shifts in whale investor behavior, and the defense of key technical support levels. According to price analysis, the current trading range reflects a sideways-to-mildly bearish structure heading into the final stretch of September.

    Key Support and Resistance Levels
    The mid-to-high-$1.30s represent a critical demand zone where substantial XRP volume has previously traded. This area, along with support near the low-$1.30s (close to the 20-day EMA) and a more significant zone around $1.25–$1.30 (near the 50-day EMA), is being closely watched. Resistance is building above the current range, with initial hurdles identified in the mid-$1.30s to low-$1.40s, followed by heavier supply noted between $1.45–$1.55. The $1.55–$1.70 region stands as the next major test for any potential upward movement.

    Factors Driving Uncertainty
    Several factors are contributing to the current uncertainty surrounding XRP’s trajectory. A looming regulatory decision is considered a potential swing factor for the next major price move, with traders monitoring the CLARITY Act vote timeline. Additionally, shifts in whale behavior, such as the movement of dormant coins, are being observed as potential catalysts, though not necessarily indicative of a sale. The broader macroeconomic environment, particularly signals from Federal Reserve policy, is also impacting the cryptocurrency market as a whole, influencing XRP’s price action.

    Technical Indicators and Market Context
    Technical indicators suggest a neutral Relative Strength Index (RSI), while expanding Bollinger Bands hint at potentially building volatility rather than fading momentum. CoinMarketCap’s tracking shows that XRP has underperformed against the wider crypto market during recent risk-off movements. This follows an August rally that saw XRP climb from approximately $1 to the high-$1.60 range. The current consolidation is occurring within what appears to be a descending triangle pattern.

    Potential Scenarios
    The market’s immediate focus is on whether buyers will defend the low-to-mid-$1.30s support. A break below this level would weaken the current recovery thesis and could lead to a retest of the mid-$1.20s. Conversely, a bullish scenario would involve XRP reclaiming the low-$1.40s, potentially paving the way toward the $1.60 area and possibly the high-$1.80s if a triangle pattern breaks higher. However, the base case, according to analysis, is continued price action between roughly $1.30 and $1.40 as traders await a fresh catalyst.

    Related Market News
    In related market news, Bitcoin Hyper ($HYPER), a Bitcoin Layer 2 project integrating the Solana Virtual Machine, is noted for its positioning as a fast SVM-based execution layer. Currently priced at $0.013686, its presale has raised over $33 million, offering early participants a 35% APY for staking rewards. Research indicates that some traders are exploring earlier-stage infrastructure plays with more room for growth.

    Ultimately, XRP’s next significant move hinges on the interplay of these technical levels, regulatory clarity, and investor sentiment. The current phase is characterized by ambiguity, with the outcome of these converging factors expected to shape XRP’s trajectory into Q4.

    Why This Matters

    The materials describe a narrow update: XRP is trading in the low-$1. Whether buyers will defend the low-to-mid-$1.30s support or allow it to crack.

  • Ripple (XRP): 21Shares Lists 4 Investor Must-Knows

    Ripple (XRP): 21Shares Lists 4 Investor Must-Knows

    21Shares Identifies Key Investment Drivers for XRP

    Swiss-based asset manager 21Shares has presented a compelling investment case for XRP, pointing to enhanced regulatory clarity, increased institutional access, growing utility on the XRP Ledger (XRPL), and a predictable supply as key factors. However, the report also acknowledges a significant ongoing risk that continues to cast a shadow over the underlying asset.

    Regulatory Clarity and Institutional Adoption

    The firm’s report designates regulatory clarity as the primary pillar of its investment thesis. The favorable outcome of Ripple’s protracted legal battle with the U.S. Securities and Exchange Commission (SEC) in the past year has significantly eased compliance burdens for institutions. The report notes that the regulatory landscape for XRP has become considerably clearer since August 2025, offering a more defined treatment compared to the previous SEC administration.

    This improved regulatory environment appears to be directly contributing to the second pillar: expanding institutional access. The launch of several spot XRP Exchange Traded Funds (ETFs) on Wall Street last November saw substantial inflows, exceeding $1 billion within the first six weeks. Recent reports indicate that cumulative inflows have reached a new all-time high of over $1.7 billion, demonstrating sustained investor interest even amidst a challenging market for the asset.

    Growing XRPL Utility and Predictable Supply

    The third key driver highlighted by 21Shares is the increasing real-world usage of the XRP Ledger. The report states that the XRPL has processed nearly $500 billion in on-chain value over the past 12 months. Concurrently, Ripple’s RLUSD stablecoin has experienced significant growth, expanding its market capitalization from $72 million to $1.6 billion in under two years.

    Furthermore, tokenized assets on the XRPL have seen substantial expansion, recently reaching a valuation of $4 billion. The network continues to focus on facilitating payments, stablecoins, and real-world assets. Crypto commentator Vincent Van Code echoed these sentiments, suggesting that Ripple’s comprehensive infrastructure offers an “out-of-the-box, turnkey end-to-end solution” for institutions venturing into digital assets.

    The final pillar cited is XRP’s fixed maximum supply of 100 billion tokens. The absence of an ongoing inflation schedule, coupled with a small amount of XRP being permanently burned through transaction fees, contributes to its predictable supply dynamics.

    Acknowledging the Lingering Risk

    Despite these positive indicators, 21Shares acknowledges a critical weakness in its investment thesis: increased XRPL usage does not automatically equate to heightened demand for XRP. Institutions may utilize the network without holding XRP for extended periods, or their engagement with the token might be minimal.

    The central question remains whether the expansion of payments, stablecoins, and tokenized assets will ultimately lead to sustainable value accrual for XRP.

    For investors who believe in the increasing digitization of global finance, 21Shares posits that XRP offers one of the more regulated and institutionally connected avenues for exposure to this trend. However, the investment case is contingent on adoption translating into genuine demand for the underlying asset, which, as of press time, continues to face resistance around the $1.40 mark.

  • Bitcoin Faces Key Resistance Levels Amidst Rally Uncertainty, Analysts Assess Implications

    Bitcoin Faces Key Resistance Levels Amidst Rally Uncertainty, Analysts Assess Implications

    Bitcoin’s recent price rally has encountered significant resistance, leaving its future direction uncertain as analysts evaluate the implications of key on-chain and technical levels. The cryptocurrency experienced a notable surge, climbing from under $65,000 to surpass $82,000 within a few weeks, representing a rally of approximately 24%. However, this recent price movement was met with rejection at several critical resistance points.

    According to CryptoQuant analysts, Bitcoin’s ability to sustain its upward trajectory hinges on overcoming a series of technical and on-chain hurdles. The most immediate and significant level identified is the 365-day moving average, currently situated around $81,700. Historically, a decisive close above this indicator has often signaled the commencement of a new bullish phase. Analysts at CryptoQuant believe that a successful breach of $81,700 could pave the way for another substantial price increase. Conversely, its continuous inability to break through this level could lead to a prolonged consolidation period or a more significant price decline.

    Further complicating the immediate outlook is a substantial supply wall identified by CryptoQuant analysts. Throughout the year, long-term holders have sold approximately 539,000 BTC within the price range of $77,100 to $80,200. This activity has created a significant on-chain supply barrier that Bitcoin must absorb before it can make another convincing attempt to move higher. The analysts emphasize that Bitcoin needs to overcome this supply before a more profound rally can develop.

    Beyond the 365-day moving average, other resistance levels are also being closely watched. The 3x Metcalfe valuation band is positioned around $83,600, and the trader realized-price upper band is noted at $88,700. These levels represent further potential points of selling pressure where active traders, sitting on unrealized profits, may begin to offload their holdings.

    On the downside, the 200-day moving average, currently around $70,000, is identified as the first major technical support level. Additionally, a significant cluster of Bitcoin accumulation, approximately 476,000 BTC, occurred between $62,000 and $65,000 this year, forming another important support zone. These levels are crucial for defining the downside risk should Bitcoin fail to overcome the immediate resistance.

    The current market sentiment, as interpreted by CryptoQuant analysts, remains constructive, but with critical conditions. The primary uncertainty lies in Bitcoin’s capacity to decisively break through the $81,700 resistance. Failure to do so could result in extended consolidation or a notable decline. The ability to absorb the supply wall created by long-term holders is also a key factor. While analysts are bullish on Bitcoin’s potential, they stress that clearing $81,700, followed by $83,600 and $88,700, is essential for the current recovery to evolve into a more significant rally. The market is therefore at a critical juncture, with future price movements dependent on Bitcoin’s performance against these key technical and on-chain indicators.

    Why This Matters

    The materials describe a narrow update: Bitcoin’s price increased from under $65,000 to over $82,000, but subsequently faced rejection at several technical and on-chain resistance levels. Whether Bitcoin may successfully break through the $81,700 resistance level.

    Broader Context

    Source materials place the market analysis in this context: The article discusses Bitcoin’s recent price action and potential future movements based on analysis from CryptoQuant.

  • Bitcoin’s Midterm Election Cycle: A Historical Pattern of Decline and Rebound, Amidst Significant Uncertainty

    Bitcoin’s Midterm Election Cycle: A Historical Pattern of Decline and Rebound, Amidst Significant Uncertainty

    A historical pattern suggests Bitcoin’s price performance has shown a tendency to decline in the lead-up to US midterm elections and subsequently rebound in the following year. This observation, highlighted by analyst CryptoGoos, points to a potential buy signal emerging, though experts caution against treating this correlation as a definitive predictor of future market movements.

    According to CryptoGoos, Bitcoin has historically struggled during US midterm election years. This pattern has reportedly occurred in 2014, 2018, and 2022. Data from CryptoQuant indicates that Bitcoin (BTC) experienced declines of over 60% in each of these three midterm election years. Following these periods of decline, BTC has historically shown a strong recovery, with an average gain of over 50% in the 12 months after the elections.

    This historical tendency suggests a potential opportunity for investors to accumulate Bitcoin ahead of the next midterm elections, with a proposed strategy involving sales in subsequent years. CryptoGoos outlined a plan that includes a 25% offload in 2027, followed by a 50% dump in 2028 and another 25% in 2029. However, it is crucial to note that this strategy is based on a historical correlation and carries significant uncertainty.

    The reasons behind this pattern are complex and not solely attributable to the elections themselves. Interpretations suggest that midterm election years often coincide with increased political uncertainty, reduced investor appetite for risk, and shifting fiscal expectations. Additionally, these periods can align with the historically weaker phases of Bitcoin’s four-year cycle. Once the elections pass, a major source of uncertainty is removed, allowing markets to price in future fiscal, regulatory, and monetary policies with greater confidence, potentially contributing to a market rebound.

    Past midterm election years have been marked by significant market events that influenced Bitcoin’s price. In 2014, Bitcoin faced a collapse following the 2013 bull market and the failure of Mt. Gox. The 2018 midterm year saw the cryptocurrency plunge from nearly $20,000 to under $3,500. More recently, in 2022, Bitcoin entered a brutal downturn amid aggressive Federal Reserve rate hikes, the collapse of Terra/LUNA, and a broader crypto credit crisis. Days after the November 8, 2022, midterms, the implosion of FTX coincided with Bitcoin slumping toward $16,000. Bitcoin remains significantly below its October 2025 all-time high.

    Despite the recurring pattern, relying solely on US midterm election cycles for investment decisions is fraught with risk. The historical data does not guarantee that future outcomes will mirror past performance. Several uncertainties remain, including whether current market conditions will align with historical trends, the precise timing and magnitude of future price movements, and the specific factors driving these cycles. It is important to acknowledge that the election itself does not mechanically lead to a sharp Bitcoin price uptick.

    Therefore, while the historical correlation between Bitcoin and US midterm elections offers an interesting analytical perspective, it should be viewed as an observation rather than a predictive tool. Investors are advised to exercise caution and consider a wide range of market factors beyond election cycles when making investment decisions.

    Why This Matters

    The materials describe a narrow update: A trading strategy proposed by analyst CryptoGoos suggests that Bitcoin’s price historically declines leading up to US midterm elections and rebounds strongly in the 12 months following them. Whether the current market conditions will mirror the historical pattern of Bitcoin’s performance around US midterm elections.

    Broader Context

    Source materials place the market analysis in this context: Bitcoin was essentially an unknown internet magic money in 2010.

  • Bitcoin Hits $77K After Volatile Weekend; Ether Falls Post-Rally

    Bitcoin Hits $77K After Volatile Weekend; Ether Falls Post-Rally

    Bitcoin experienced a volatile trading session on Friday, with significant price swings both before and after the release of August Consumer Price Index (CPI) data, before ultimately settling around the $77,000 mark.

    Ethereum mirrored this volatility, surging to an eight-month high before encountering resistance. Many other large-cap altcoins showed gains over the past 24 hours.

    Bitcoin’s Rollercoaster Ride

    The primary cryptocurrency faced rejection above $80,000 at the beginning of the week and failed to regain that level in the subsequent days. Instead, selling pressure intensified amid growing global economic uncertainty, pushing Bitcoin down to $77,600 just a few days later. An attempt to rebound was thwarted at $79,600 on two occasions, September 9 and 10, before bears initiated another downward move, bringing the price below $77,000 following the release of Producer Price Index (PPI) data on Thursday.

    Bitcoin managed to resist the mounting pressure, trading sideways around $77,000 as Friday approached. This period was crucial as markets awaited the August CPI figures. Once the data was released, aligning closely with expectations, a significant market reaction ensued.

    Initially, Bitcoin plunged to a multi-week low of $76,000. However, it quickly rebounded, surging by nearly $4,000 to reach $79,800. Another rejection followed, causing Bitcoin to fall back to its starting point, just above $77,000, where it currently remains. All eyes are now on the Federal Reserve, which has received the complete economic picture.

    Bitcoin’s market capitalization is holding steady at $1.550 trillion, with its dominance over altcoins decreasing to 58.7% on CoinMarketCap.

    Ethereum and Altcoin Performance

    Ethereum emerged as a top performer during the post-CPI rally, skyrocketing from $2,440 to a new eight-month high of $2,670. However, it faced resistance and retreated to just over $2,500. Despite this pullback, Ethereum is still up 3% for the day, mirroring the performance of BNB, which is trading above $730. XRP remains below $1.40, even with a 2% daily increase, while Solana has successfully defended the $100 support level.

    Zcash (ZEC) and Monero (XMR) are showing upward momentum, with gains of 4.8% and 5.3%, respectively. Other notable large-cap altcoin gainers include Uniswap (UNI) and Skycoin (SKY), followed by Stellar (XLM), Bitcoin Cash (BCH), and Litecoin (LTC).

    The total cryptocurrency market capitalization has increased by 0.6% since yesterday, reaching $2.640 trillion on CoinMarketCap.

  • Ethereum Price Surges to 8-Month High Driven by Whale Activity, Faces Resistance Amidst Market Uncertainty

    Ethereum Price Surges to 8-Month High Driven by Whale Activity, Faces Resistance Amidst Market Uncertainty

    Ethereum (ETH) experienced a significant price surge, reaching an 8-month high above $2,600, driven by increased activity from large holders, often referred to as whales, and positive on-chain signals. However, the cryptocurrency later faced resistance and retreated to just over $2,500.

    On-Chain Drivers Fuel Surge

    On Friday, Ethereum’s price saw a rapid increase of approximately 8% within an hour, climbing from below $2,440 to a peak of $2,667. This move marked its highest point since late January. The rally was preceded by encouraging on-chain signals identified earlier in the week. Notably, transactions involving Ethereum whales, those holding over $1 million in ETH, increased by nearly 14% during the surge. Furthermore, over 116,000 ETH, valued at approximately $300 million, were withdrawn from cryptocurrency exchanges in the 48 hours leading up to the price jump.

    On-chain data indicates that these withdrawals reduce the immediate availability of ETH for trading, potentially contributing to buying interest. The increase in large-value transactions suggests heightened interest and activity from significant market participants.

    Resistance and External Pressures Emerge

    Despite the surge, Ethereum encountered selling pressure from investors who had previously acquired ETH at higher price points. This coincided with a subsequent retreat, with the price settling just above $2,500. On-chain analysis highlights a substantial resistance zone between $2,720 and $2,820, where approximately 10 million ETH were acquired previously. Investors who bought within this range may be inclined to sell if ETH approaches their cost basis, potentially limiting further upward movement.

    Adding to market uncertainty, several key macroeconomic and legislative events are scheduled for the upcoming week. The Federal Reserve is expected to announce an interest rate hike on September 16. A day prior, on September 15, the US Senate is scheduled to vote on the CLARITY Act. These events are anticipated to introduce additional volatility into risk-on assets, including cryptocurrencies like Ethereum.

    The interplay of increased whale activity, exchange outflows, and upcoming external market pressures creates a complex outlook for Ethereum. While on-chain signals pointed to a potential upward move, significant resistance levels and anticipated macroeconomic and legislative developments introduce considerable uncertainty regarding the cryptocurrency’s short-term trajectory. The exact impact of these upcoming events remains to be seen.

    Why This Matters

    The materials describe a narrow update: Ethereum’s price surged unexpectedly by 8% within an hour, reaching $2,660, its highest point since January. The exact identity or specific reasons behind the surge in whale activity.

    Broader Context

    Source materials place the factual news in this context: Ethereum price reached its highest level since late January.

  • Grok AI: Bitcoin to Reach $200K by 2027

    Grok AI: Bitcoin to Reach $200K by 2027

    Bitcoin Poised for Potential Surge as 2026 Draws to a Close

    As Bitcoin heads into the final months of 2026, the cryptocurrency appears to be gathering momentum for a significant move, though a universally bullish sentiment has yet to take hold. Elon Musk’s AI, Grok, has projected that Bitcoin could reach $180,000 by the start of 2027.

    Following a notable gain of approximately 25% in August, Bitcoin is currently trading around the $76,900 mark. The $80,000 level is emerging as a critical psychological and technical resistance point.

    The prevailing thesis suggests a return to sustained risk-on market conditions in late 2026. This outlook is underpinned by improving macroeconomic liquidity, a resurgence of durable spot ETF inflows, increased institutional accumulation, and potential policy support, which could include expansions of strategic reserves or clearer regulatory frameworks. The broader “debasement trade,” driven by ongoing fiscal pressures, is also seen as a contributing factor.

    Historically, Bitcoin has experienced substantial growth from mid-cycle levels once a new bull phase commences. A move from the current approximate $77,000 level, through the previous all-time high near $126,000, and into the mid-to-high $100,000s would align with a full bull market scenario and Bitcoin’s established role as a market leader.

    Recent US Consumer Price Index (CPI) data revealed an inflation rate of 3.4%, meeting expectations. This release triggered a significant price increase for Bitcoin, accompanied by a notable drop in yields. However, questions remain about the sustainability of this rally, as inflation is not yet showing sufficient signs of cooling.

    Technical Outlook and Key Levels

    From a technical standpoint, Bitcoin appears to have largely recovered from its earlier weakness in 2026. The cryptocurrency has recently been trading above its 200-day moving average, and the 20-day exponential moving average (EMA) has crossed above the 200-day EMA, a development that could signal a bullish trend.

    The immediate challenge lies at the $80,000 resistance, followed by the $82,000 to $85,000 range. A sustained breach of this zone could pave the way for a move towards $90,000 and eventually six-figure territory.

    Conversely, a decline below $72,000 would significantly undermine the bullish outlook. A deeper drop towards $68,000 would raise concerns about whether the recent rally was merely a temporary bounce within a bear market.

    Grok AI’s Price Predictions

    Synthesizing these factors, Grok AI forecasts Bitcoin’s price to be between $140,000 and $180,000 on January 1, 2027.

    The AI’s bearish scenario projects a range of $65,000 to $80,000, contingent on deteriorating ETF flows and adverse macroeconomic conditions. The base case scenario anticipates a price of $115,000 to $130,000, reflecting continued institutional investment and a gradual strengthening of the cryptocurrency market.

    However, Grok AI suggests that if a full-fledged Bitcoin bull run materializes, the target could be dramatically elevated to $175,000 to $200,000. This scenario envisions a combination of accelerating ETF inflows, declining interest rates, widespread retail fear of missing out (FOMO), and a decisive breakout, potentially recreating the explosive final stages observed in previous crypto cycles.

    Grok AI’s central prediction stands at $115,000, with a bull-run target exceeding $200,000.

    Emerging Infrastructure Plays

    While Bitcoin is currently facing resistance at $80,000, Grok AI’s prediction of a potential surge to $200,000 by year-end highlights the significant upside potential. However, even at such levels, Bitcoin may not offer the same exponential returns as assets acquired before substantial liquidity arrives. This is where early-stage infrastructure projects aim to fill a crucial gap.

    Bitcoin Hyper ($HYPER) is positioning itself as the first Bitcoin Layer 2 solution with full Solana Virtual Machine (SVM) integration. The platform claims to offer smart contracts operating at Solana-like speeds while settling transactions on Bitcoin’s base layer.

    The project’s presale has reportedly raised $33 million to date, with tokens priced at $0.0136856 and staking rewards available for early participants. Its decentralized canonical bridge and low-latency execution layer are designed to address Bitcoin’s long-standing limitations: slow transaction times and a lack of programmability.