Tag: Market Trends

  • Jane Street Discloses Over $1 Billion in U.S. Spot Bitcoin ETF Holdings, Primarily in BlackRock’s IBIT

    Jane Street Discloses Over $1 Billion in U.S. Spot Bitcoin ETF Holdings, Primarily in BlackRock’s IBIT

    Jane Street, a prominent quantitative trading firm, has disclosed significant holdings in U.S. spot Bitcoin exchange-traded funds (ETFs), totaling over $1 billion as of the second quarter. The largest portion of these disclosed investments is concentrated in BlackRock’s iShares Bitcoin Trust (IBIT).

    According to the firm’s latest Form 13F, filed on August 14th with the Securities and Exchange Commission (SEC), Jane Street reported approximately $828 million invested in IBIT. The filings also indicate positions in other Bitcoin ETFs, including Fidelity’s FBTC and Grayscale’s GBTC. This disclosure marks a notable increase from the first quarter, when Jane Street had reduced its IBIT position by around 71% to approximately 5.9 million shares, valued at about $225 million.

    Beyond Bitcoin ETFs, Jane Street also expanded its exposure to other cryptocurrency-related ETFs. The filings show the firm holds more than 1.2 million shares of Bitwise’s spot XRP ETF, a substantial increase from the 20,605 shares reported in the previous quarter. Additionally, Jane Street reported positions in XRP products offered by Franklin Templeton, Grayscale, Bitwise, Canary Capital, and 21Shares.

    It is crucial to understand that Form 13F filings provide a snapshot of long positions in certain securities held by institutional investment managers at the end of a reporting period. These filings do not capture the firm’s complete exposure, as they do not include short positions, futures, swaps, or other derivative products. Therefore, the disclosed holdings should not be interpreted as a one-sided bullish bet on Bitcoin or other cryptocurrencies.

    As a major market maker in the industry, Jane Street’s trading activities are complex and multifaceted. The 13F filings offer a limited view of their overall market engagement, focusing solely on specific long equity and ETF positions.

    Why This Matters

    The materials describe a narrow update: Jane Street reported holding over $1 billion in U. The firm’s complete short, futures, swaps, or exposure to other derivative products are not shown in the filings.

    Broader Context

    Source materials place the factual news in this context: Jane Street – the popular quant trading firm with a heavy orientation toward crypto – disclosed more than $1 billion in U.S. spot Bitcoin ETF holdings as of the second quarter of this year.

  • XRP Price Resilience Tested by Technical Warnings and Regulatory Uncertainty

    XRP Price Resilience Tested by Technical Warnings and Regulatory Uncertainty

    XRP’s notable streak of closing above the $1 mark for 635 consecutive days, a period dating back to November 2024, is now facing significant headwinds. Despite this sustained price stability, emerging technical indicators suggest a potential downturn, while an uncertain regulatory environment adds another layer of risk, according to recent analyses.

    The central tension of this story lies in the divergence between XRP’s prolonged defense of the crucial $1 psychological level and the growing cautionary signals from its technical charts. While the cryptocurrency has largely held its ground, recent price action and charting patterns indicate a shift in momentum that warrants careful examination.

    Technical Indicators Signal Weakening Trend

    Analysis of XRP’s daily chart reveals technical damage. The 50-day exponential moving average (EMA) has crossed below the 200-day EMA, a pattern traders often refer to as a ‘death cross.’ This suggests that sellers have dominated the short-to-medium-term trend for weeks. Furthermore, the daily Average Directional Index (ADX), which measures trend strength, stands at 21.8. This reading is just below the 25 threshold that traders typically use to suggest strong conviction, indicating that while the current decline is real, it may not be characterized by extreme volatility at this moment.

    On the weekly chart, the picture is more nuanced. XRP’s 50-week EMA remains above its 200-week EMA, suggesting the longer-term trend is still intact. However, the gap between these two averages has been narrowing over recent months. The weekly ADX, currently at 33.7, signals a genuinely strong trend. As reported by the source, for those holding XRP long, this strong trend is currently pointing in an unfavorable direction.

    Further technical analysis indicates that XRP has not yet reclaimed its shallowest Fibonacci retracement level at $1.0281. The ‘golden zone’ for Fibonacci retracement, situated between $1.0754 and $1.0965, represents a significant climb from current price levels. Immediate resistance is observed near $1.07–$1.09, with a potential push to $1.1264 if momentum is sustained. On the support side, this week’s low was around $0.98, with major support identified at $0.9061.

    External Pressures and Market Dynamics

    Recent events have also tested XRP’s stability. A bridge exploit resulted in the draining of approximately $200,000 through a connection between the TX Chain and the XRP Ledger. This incident was associated with XRP to briefly trade below $1 on August 11 and again on August 14. In both instances, buyers intervened before the daily close, preventing a sustained breach of the $1 level.

    The broader cryptocurrency market is also navigating a challenging period. Bitcoin has struggled to hold above $64,000, and Ethereum has faced difficulties maintaining the $1,900 level, with traders uncertain about when the current slide will end. This contrasts with Wall Street, where sectors like AI stocks have shown strength, with companies like Anthropic reportedly posting significant quarterly revenue.

    Regulatory and Legislative Uncertainty Looms

    The upcoming calendar introduces further uncertainty for the crypto market. The Senate has begun a five-week August recess without voting on the Clarity Act, a crypto market structure bill, pushing the next realistic vote to around September 15. Adding to this, the SEC abruptly postponed its own vote on new crypto-startup fundraising rules, citing scheduling issues.

    These external factors contribute to a cautious outlook. Analyst Geoff Kendrick of Standard Chartered significantly revised his 2026 XRP price target downward from $8 to $2.80 in the first quarter of 2026, reflecting a bearish sentiment among some market observers.

    Trader Positioning and Potential Risks

    Whales have reportedly purchased around 380 million XRP near the $1 level over the past week. However, this buying activity is occurring alongside approximately $1.5 billion in newly opened leveraged long positions. As reported by the source, this combination could exacerbate price drops if forced liquidations are triggered by a sustained break below $1.

    Conclusion: Navigating Uncertainty

    While XRP’s ability to hold above $1 for an extended period is notable, the confluence of weakening technical indicators, recent price volatility, and an uncertain regulatory environment presents significant risks. The market awaits further developments regarding the Clarity Act and SEC actions, with traders closely monitoring technical levels and positioning. The current situation suggests a need for caution, as XRP navigates a complex landscape where past resilience may not fully insulate it from future challenges.

    Why This Matters

    The materials describe a narrow update: XRP has maintained a streak of closing above $1 for 635 days, despite recent price dips below this level due to a bridge exploit and general market volatility. When the current crypto market slide will end.

    Broader Context

    Source materials place the factual news in this context: Crypto is grinding through what can be considered an extended bear market with no reported bottom in sight.


  • Jane Street Discloses Significant XRP ETF Stake

    Jane Street Discloses Significant XRP ETF Stake

    Jane Street Reports Major Position Across XRP ETFs

    Jane Street Group has disclosed a significant increase in its holdings of Bitwise’s XRP Exchange Traded Fund (ETF), reporting over 1.2 million shares as of June 30, 2026. This marks a substantial jump from the 20,605 shares held just three months prior, a more than 60-fold increase detailed in the trading firm’s second-quarter Form 13F filing with the Securities and Exchange Commission (SEC).

    While this filing underscores Jane Street’s prominent position within the XRP ETF market, its role as a major market maker actively involved in trading ETFs and options suggests that these holdings should not be interpreted as a simple, long-term directional bet on XRP.

    The firm’s Q2 2026 Form 13F, which covers positions as of June 30, revealed the substantial increase in Bitwise XRP ETF shares. Beyond Bitwise, Jane Street also reported exposure to XRP-related funds from Franklin Templeton, Grayscale, Canary Capital, and 21Shares, indicating a diversified approach across several XRP ETF products rather than a singular focus on Bitwise’s offering.

    Bitwise’s XRP ETF distinguishes itself by holding spot XRP, a feature not present in other ETFs tracking the asset. Launched in November, shortly after Canary Capital’s ETF debuted on Wall Street, the Bitwise fund has since grown to become the largest among the XRP ETFs mentioned in the filings.

    The considerable increase in reported XRP ETF shares held by Jane Street is noteworthy, but the firm’s market-making activities and its extensive trading in ETFs and options provide crucial context. As such, the position should not be automatically construed as a straightforward long-term investment in XRP. The filing establishes Jane Street’s reportable securities as of the June 30 cutoff, but this data alone does not reveal the firm’s specific investment intentions or the planned duration of its holdings. Nevertheless, Jane Street’s reported stake positions it as a leading institutional participant in the adoption of XRP ETFs among those entities listed in the filings.

    In other institutional activity, Bank of America reported holding 13,260 shares of the Volatility Shares XRP ETF, a position valued at approximately $76,000. Notably, the Volatility Shares ETF is not a spot XRP ETF, unlike Bitwise’s product.

    Morgan Stanley also disclosed positions in three XRP-related funds at the close of the second quarter: 6,715 shares of Franklin’s XRP ETF, 255 shares of REX-Osprey’s product, and 567 shares of Bitwise’s fund. While these holdings are relatively small in the context of Morgan Stanley’s overall portfolio, they contribute to the growing list of institutions reporting regulated exposure to XRP.

    Additional reported positions include nearly 200,000 Bitwise XRP ETF shares held by Wolverine Asset Management and 86,744 shares of the Capital XRP ETF reported by Gallacher Capital Management. Main Street Group and the National Bank of Canada reported holding 5,261 and 3,848 XRP-related shares, respectively.

  • Tudor Investment Boosts Bitcoin ETF Stake, Cuts Options Exposure

    Tudor Investment Boosts Bitcoin ETF Stake, Cuts Options Exposure

    Tudor Investment, the macro hedge fund founded by Paul Tudor Jones, has increased its direct holdings in BlackRock’s iShares Bitcoin Trust (IBIT) during the last quarter, marking a reversal of its previous year-long selling trend. Concurrently, the firm significantly reduced its call options tied to the ETF, indicating a strategic shift towards more direct ownership.

    According to a 13F filing submitted to the Securities and Exchange Commission on August 14, Tudor Investment held 688,529 shares of IBIT as of June 30, valued at approximately $22.9 million. This represents an 18.9% increase from the 579,083 shares reported at the end of March, with a net addition of 109,446 shares.

    In parallel, the filing revealed an approximately 85% reduction in Tudor Investment’s reported call options tied to IBIT. The number of underlying shares represented by these call options decreased from 998,000 to 148,000, while the firm’s put position related to IBIT remained largely stable.

    This adjustment from options to direct shares suggests a move away from leveraged bets and towards straightforward spot exposure. However, the full extent of Tudor Investment’s strategy remains unclear, as 13F filings do not disclose specific strike prices or expiration dates.

    While the increase in direct shareholding is modest relative to Tudor Investment’s overall assets, it is being interpreted as a notable signal from a prominent trader returning to accumulation. Paul Tudor Jones has historically advocated for Bitcoin as an inflation hedge, a thesis he first outlined in 2020 and has since reiterated, viewing the asset as a hedge against currency debasement.

    Tudor Investment’s recent activity coincides with a period of renewed institutional interest in U.S. spot Bitcoin ETFs. These funds have experienced significant inflows recently, particularly as expectations for interest rate hikes have cooled. BlackRock’s iShares Bitcoin Trust (IBIT) continues to lead the market, holding approximately 49% of the total assets in the U.S. spot Bitcoin ETF sector.

    Although Tudor Investment’s current IBIT holdings are substantially lower than its peak in late 2024, when it held over 8 million shares valued around $427 million before gradually reducing its position through 2025, the recent increase signifies a change in direction from its prior selling pattern.

    Why This Matters

    The materials describe a narrow update: Tudor Investment, a hedge fund founded by Paul Tudor Jones, increased its holdings in BlackRock’s iShares Bitcoin Trust (IBIT) by 18. The full strategy behind Tudor Investment’s shift from options to direct shares is unclear as 13F filings do not disclose strike prices or expirations.

    Broader Context

    Source materials place the factual news in this context: Tudor Investment, the macro hedge fund founded by billionaire Paul Tudor Jones, added to its stake in BlackRock’s spotBitcoinETF last quarter, reversing a year-long stretch of selling.

  • Wells Fargo Discloses Millions in XRP Holdings

    Wells Fargo Discloses Millions in XRP Holdings

    Wells Fargo Discloses Millions in XRP ETF Holdings, Adding to Institutional Narrative

    XRP’s price is trading near the $1.00 mark, a critical psychological level that has become a dividing line between market confidence and doubt regarding its future trajectory. Beneath this apparent stability, however, a significant development is unfolding involving one of America’s largest financial institutions.

    Wells Fargo’s 13F Filing Reveals XRP ETF Exposure

    Wells Fargo’s latest 13F filing, submitted on August 14 and detailing positions as of June 30, 2026, has disclosed an investment in the Bitwise XRP ETF. The filing indicates a combined position of $9.18 million, allocated across two entries linked to the same CUSIP identifier.

    This institutional stake is noteworthy, particularly given Wells Fargo’s substantial scale. With approximately $2.2 trillion in assets under management as of the second quarter, the bank’s exposure to the XRP ETF warrants close observation.

    Continued Institutional Interest in XRP ETFs

    The broader landscape of institutional activity surrounding XRP ETFs continues to draw attention. Previously, Citadel adjusted its positions by closing its put options on the Canary XRP ETF while maintaining its call options. Other firms have also publicly declared their holdings in XRP ETFs.

    The recent filing from Wells Fargo thus adds another layer to the ongoing institutional narrative concerning XRP. With XRP currently hovering around the $1 mark, this development provides the market with an additional reason to monitor future price movements.

    XRP Price Action and Key Resistance Levels

    XRP’s intraday trading range, fluctuating between $0.98 and $1, illustrates a token currently constrained by a psychological ceiling. The price action over the past 24 hours has been largely flat, indicating a lack of clear control by either buyers or sellers.

    On a weekly basis, XRP has experienced a decline of several percentage points, following a pullback that pushed it below $1 earlier in August. Immediate resistance is observed in the $1.03 to $1.08 zone, an area that XRP tested before experiencing a retreat.

    Potential Catalysts and Market Outlook

    However, institutional filings could serve as a fresh catalyst for XRP, particularly ahead of Brad Garlinghouse’s scheduled appearance at the Wyoming Blockchain Symposium from August 17 to 20. Furthermore, ETF holdings that collectively amount to nearly 1 billion XRP could potentially reduce the available supply, while a sustained move above $1.08 would bolster the bullish outlook.

    For the immediate term, XRP may continue to consolidate within the $0.98 to $1.03 range as the market processes developments related to regulatory clarity. A decisive move above $1.03 would pave a clearer path for buyers towards the $1.08 resistance level.

    Conversely, a breach below $0.98 could reintroduce the possibility of a decline towards the lows seen in August. Until a clear breakout occurs, XRP is likely to remain range-bound around $1, with the next significant price movement expected to dictate its short-term direction.

    Institutional Validation vs.

    Retail Trader Dynamics

    While institutional filings lend validation to XRP’s long-term investment thesis, a token trading at $1 with overhead resistance presents limited immediate potential for substantial returns for capital seeking outsized gains. This dynamic creates a tension for retail traders.

    Holding XRP can be viewed as holding a maturing asset with significant value already factored into its price. Some experienced traders may opt to rotate into assets that are still in their foundational stages of development.

    LiquidChain: An Alternative Infrastructure Project

    LiquidChain ($LIQUID) is positioning itself as such an alternative, presenting itself as a Layer 3 infrastructure project designed to integrate liquidity from Bitcoin, Ethereum, and Solana into a unified execution environment.

    The project’s current presale price is set at $0.01491, with approximately $940,000 raised to date. Its proposed unified liquidity layer and “deploy-once” architecture aim to enable developers to build applications once and deploy them across three major ecosystems, addressing cross-chain fragmentation with a novel approach. Traders considering alternative investment opportunities may wish to research LiquidChain before its presale concludes.

  • Binance to Distribute AMAT, MSFT Cash Dividends Via bStocks

    Binance to Distribute AMAT, MSFT Cash Dividends Via bStocks

    Tokenized Securities to Distribute Dividends via Multiplier Adjustment

    Binance, a leading cryptocurrency exchange, has announced that its tokenized securities, known as bStocks, will distribute dividends for AMATB (Applied Materials) and MSFTB (Microsoft) through a multiplier adjustment mechanism. These bStocks, issued by Binance group affiliate BTech Holdings Limited, represent an interest in underlying securities held by the issuer, rather than direct ownership of the shares.

    Dividend Eligibility and Record Date

    Holders of AMATB and MSFTB on-chain as of the record date, August 20, 2026, at 00:00 UTC, will be eligible to receive the dividend distribution. The dividends will be credited to users’ Spot Accounts, regardless of where the assets were originally held, including Savings and Margin Accounts.

    Trading and Service Suspensions

    Trading of AMATB/USDT and MSFTB/USDT pairs will continue unaffected. However, the token conversion service for 1:1 swaps between AMAT or MSFT stock and their respective bStock counterparts, AMATB and MSFTB, will be suspended starting August 19, 2026, at 23:30 UTC.

    Simultaneously, deposits and withdrawals for AMATB and MSFTB tokens will also be suspended at the same time. Users are advised to ensure ample time for any pending AMATB and MSFTB token deposits to be fully processed before this suspension takes effect.

    The deposit, withdrawal, and token conversion services for AMATB and MSFTB are expected to resume once the dividend distribution is complete. No further announcements will be made regarding the resumption of these services. Users will also have the option to subscribe to recovery notifications where available.

    Binance Convert will also pause the conversion of AMATB and MSFTB, along with all associated trading pairs, at 23:30 UTC on August 19, 2026.

    Dividend Handling and Tax Implications

    Binance will manage all technical aspects of this dividend distribution event for its users. Dividends earned will be subject to withholding tax deductions before reinvestment and distribution.

    For further details on bStocks dividend distribution, users are encouraged to consult the Frequently Asked Questions (FAQ) section. Additional information regarding dividend history for Applied Materials and Microsoft can also be accessed.

    Binance reserves the right to amend or cancel this announcement at any time and for any reason without prior notice.

    It is important to note that information concerning tokenized securities is not intended as an offer, solicitation, promotion, recommendation, or invitation to buy or sell securities in any jurisdiction. Tokenized securities are not offered, sold, distributed, made available, or accessible in the United States or to U.S. persons. These securities have not been registered under U.S. securities laws, and a public offering will not be conducted in the United States or other jurisdictions, with the exception of the ADGM. By accessing these products, users represent and warrant that they are not U.S. persons, are not located in the United States, are not acting for the benefit of any U.S. person, and will not transact in tokenized securities from within the United States.

  • Major Financial Institutions Disclose XRP ETF Holdings in June 30 Filings

    Major Financial Institutions Disclose XRP ETF Holdings in June 30 Filings

    SEC filings dated June 30 reveal that prominent Wall Street institutions, including Jane Street Group, Bank of America, and Morgan Stanley, have reported holdings in XRP-related Exchange Traded Funds (ETFs). These disclosures provide insight into institutional engagement with digital asset investment products during the second quarter.

    Jane Street Group reported the most substantial exposure, holding over 1.2 million shares of the Bitwise XRP ETF. This represents a significant increase from the end of the first quarter, when the firm held 20,605 ordinary Bitwise XRP ETF shares, according to data. While Jane Street is a major market maker actively trading ETFs and options, the scale of its XRP ETF holdings is notable.

    Bank of America disclosed holdings of 13,260 shares in the Volatility Shares XRP ETF, a position valued at approximately $76,000. Morgan Stanley reported positions across three XRP-related funds by the end of the second quarter. According to SEC filings, these holdings are considered insignificant relative to the firm’s overall portfolio.

    The filings detail reportable securities positions as of June 30. Among other disclosed holdings, Jane Street reported 200,000 shares of the Bitwise XRP ETF and 567 shares of Bitwise’s XRP counterpart. Bank of America’s filings also indicated 6,715 shares of Franklin’s XRP ETF and 255 shares of a REX-Osprey XRP product.

    Other entities mentioned in relation to XRP ETF holdings include UBS, Franklin Templeton, Grayscale, Canary Capital, 21Shares, Volatility Shares, REX-Osprey, Wolverine Asset Management, Gallacher Capital Management, Main Street Group, and the National Bank of Canada. Specific share numbers for some of these entities were not detailed in the provided information.

    Data shows that the Bitwise XRP ETF, launched in November, has become a significant product. The substantial increase in Jane Street’s Bitwise XRP ETF holdings from Q1 to Q2 indicates a notable shift in its position. It is important to note that the Volatility Shares XRP ETF, unlike the Bitwise product which tracks spot XRP, is not a spot ETF.

    These disclosures add to a growing list of institutions reporting regulated XRP exposure. However, the exact motivations behind these holdings remain subject to interpretation. For instance, Jane Street’s involvement may not solely represent a long-term directional bet on XRP. Furthermore, the exact number of shares for some mentioned entities remains uncertain.

    Why This Matters

    The materials describe a narrow update: Financial institutions, including Jane Street, Bank of America, and Morgan Stanley, have disclosed their ownership of XRP-related ETFs in recent SEC filings covering holdings as of June 30. Whether Jane Street’s significant XRP ETF holdings represent a simple long-term directional bet.

    Broader Context

    Source materials place the factual news in this context: The broader landscape around XRP and the ETFs behind it is nowhere near the peaks from last year.

  • Equity Perpetual Futures Volume Grows on Crypto Exchanges, Amidst Concentrated Tech Asset Trading and Uncertainty

    Equity Perpetual Futures Volume Grows on Crypto Exchanges, Amidst Concentrated Tech Asset Trading and Uncertainty

    The volume of equity perpetual futures traded on major digital asset exchanges reached approximately $250 billion in July, a seventeenfold increase from roughly $15 billion in April. However, this rapid expansion is heavily concentrated in a few specific technology and semiconductor-related assets, and whether this activity will spread across a broader range of equity perpetual contracts remains uncertain.

    According to analytics firm CryptoQuant, the growth has transformed crypto exchanges into round-the-clock venues for contracts linked to traditional equities. These products allow continuous trading of equity-linked assets, offering an alternative to conventional market hours and appealing to crypto-native capital seeking exposure to traditional financial instruments. Rather than focusing solely on cryptocurrencies like BTC and Ether, exchanges are diversifying their offerings.

    Market Dynamics and Growth

    Binance remains the dominant platform in this market, handling an estimated $193 billion in equity perpetual futures volume in July, which accounted for about 76% of the total market. Other exchanges like Bitfer, Bybit, and Gate also saw significant activity, though at a considerable distance from Binance.

    CryptoQuant identified Gate as the fastest-growing venue during July, with its equity perpetual futures volume increasing by approximately 308% compared to June. Bybit experienced a 176% rise, while Binance saw a 59% increase in the same period. Gate has recorded consecutive monthly growth in this sector since May.

    Concentration and Future Development

    Despite the overall surge in trading volume, the market remains narrowly focused on a select group of assets. SanDisk, SK Hynix, Micron, and the leveraged semiconductor ETF SOXL are central to what analysts describe as the AI-memory complex. This concentration is particularly pronounced on Gate, where SanDisk and SK Hynix together comprised 53% of the exchange’s total equity perpetual futures volume in July.

    The products provide exposure to traditional assets while leveraging the continuous trading structure characteristic of crypto markets. However, the report from CryptoQuant highlights a market that has expanded rapidly but remains concentrated across a narrow range of assets. Whether this activity will eventually spread across a broader spectrum of equity perpetual contracts remains uncertain and will depend on how the market evolves beyond its current focus.

    The implications of this trend are significant for financial market participants, crypto traders, and fintech observers. While the growth signals a potential evolution in digital asset markets and the diversification of exchange offerings, the inherent concentration risk and the uncertainty surrounding future market development warrant careful consideration.

    Why This Matters

    The materials describe a narrow update: The volume of equity perpetual futures traded on cryptocurrency exchanges surged significantly in July. Whether activity will spread across a broader range of equity perpetual contracts.

    Broader Context

    Source materials place the factual news in this context: Equity perpetual futures on major digital asset exchanges reached about $250 billion in monthly volume in July.

  • Bitcoin Consolidates Around $63K Amidst Choppy Action, Uncertainty Remains

    Bitcoin Consolidates Around $63K Amidst Choppy Action, Uncertainty Remains

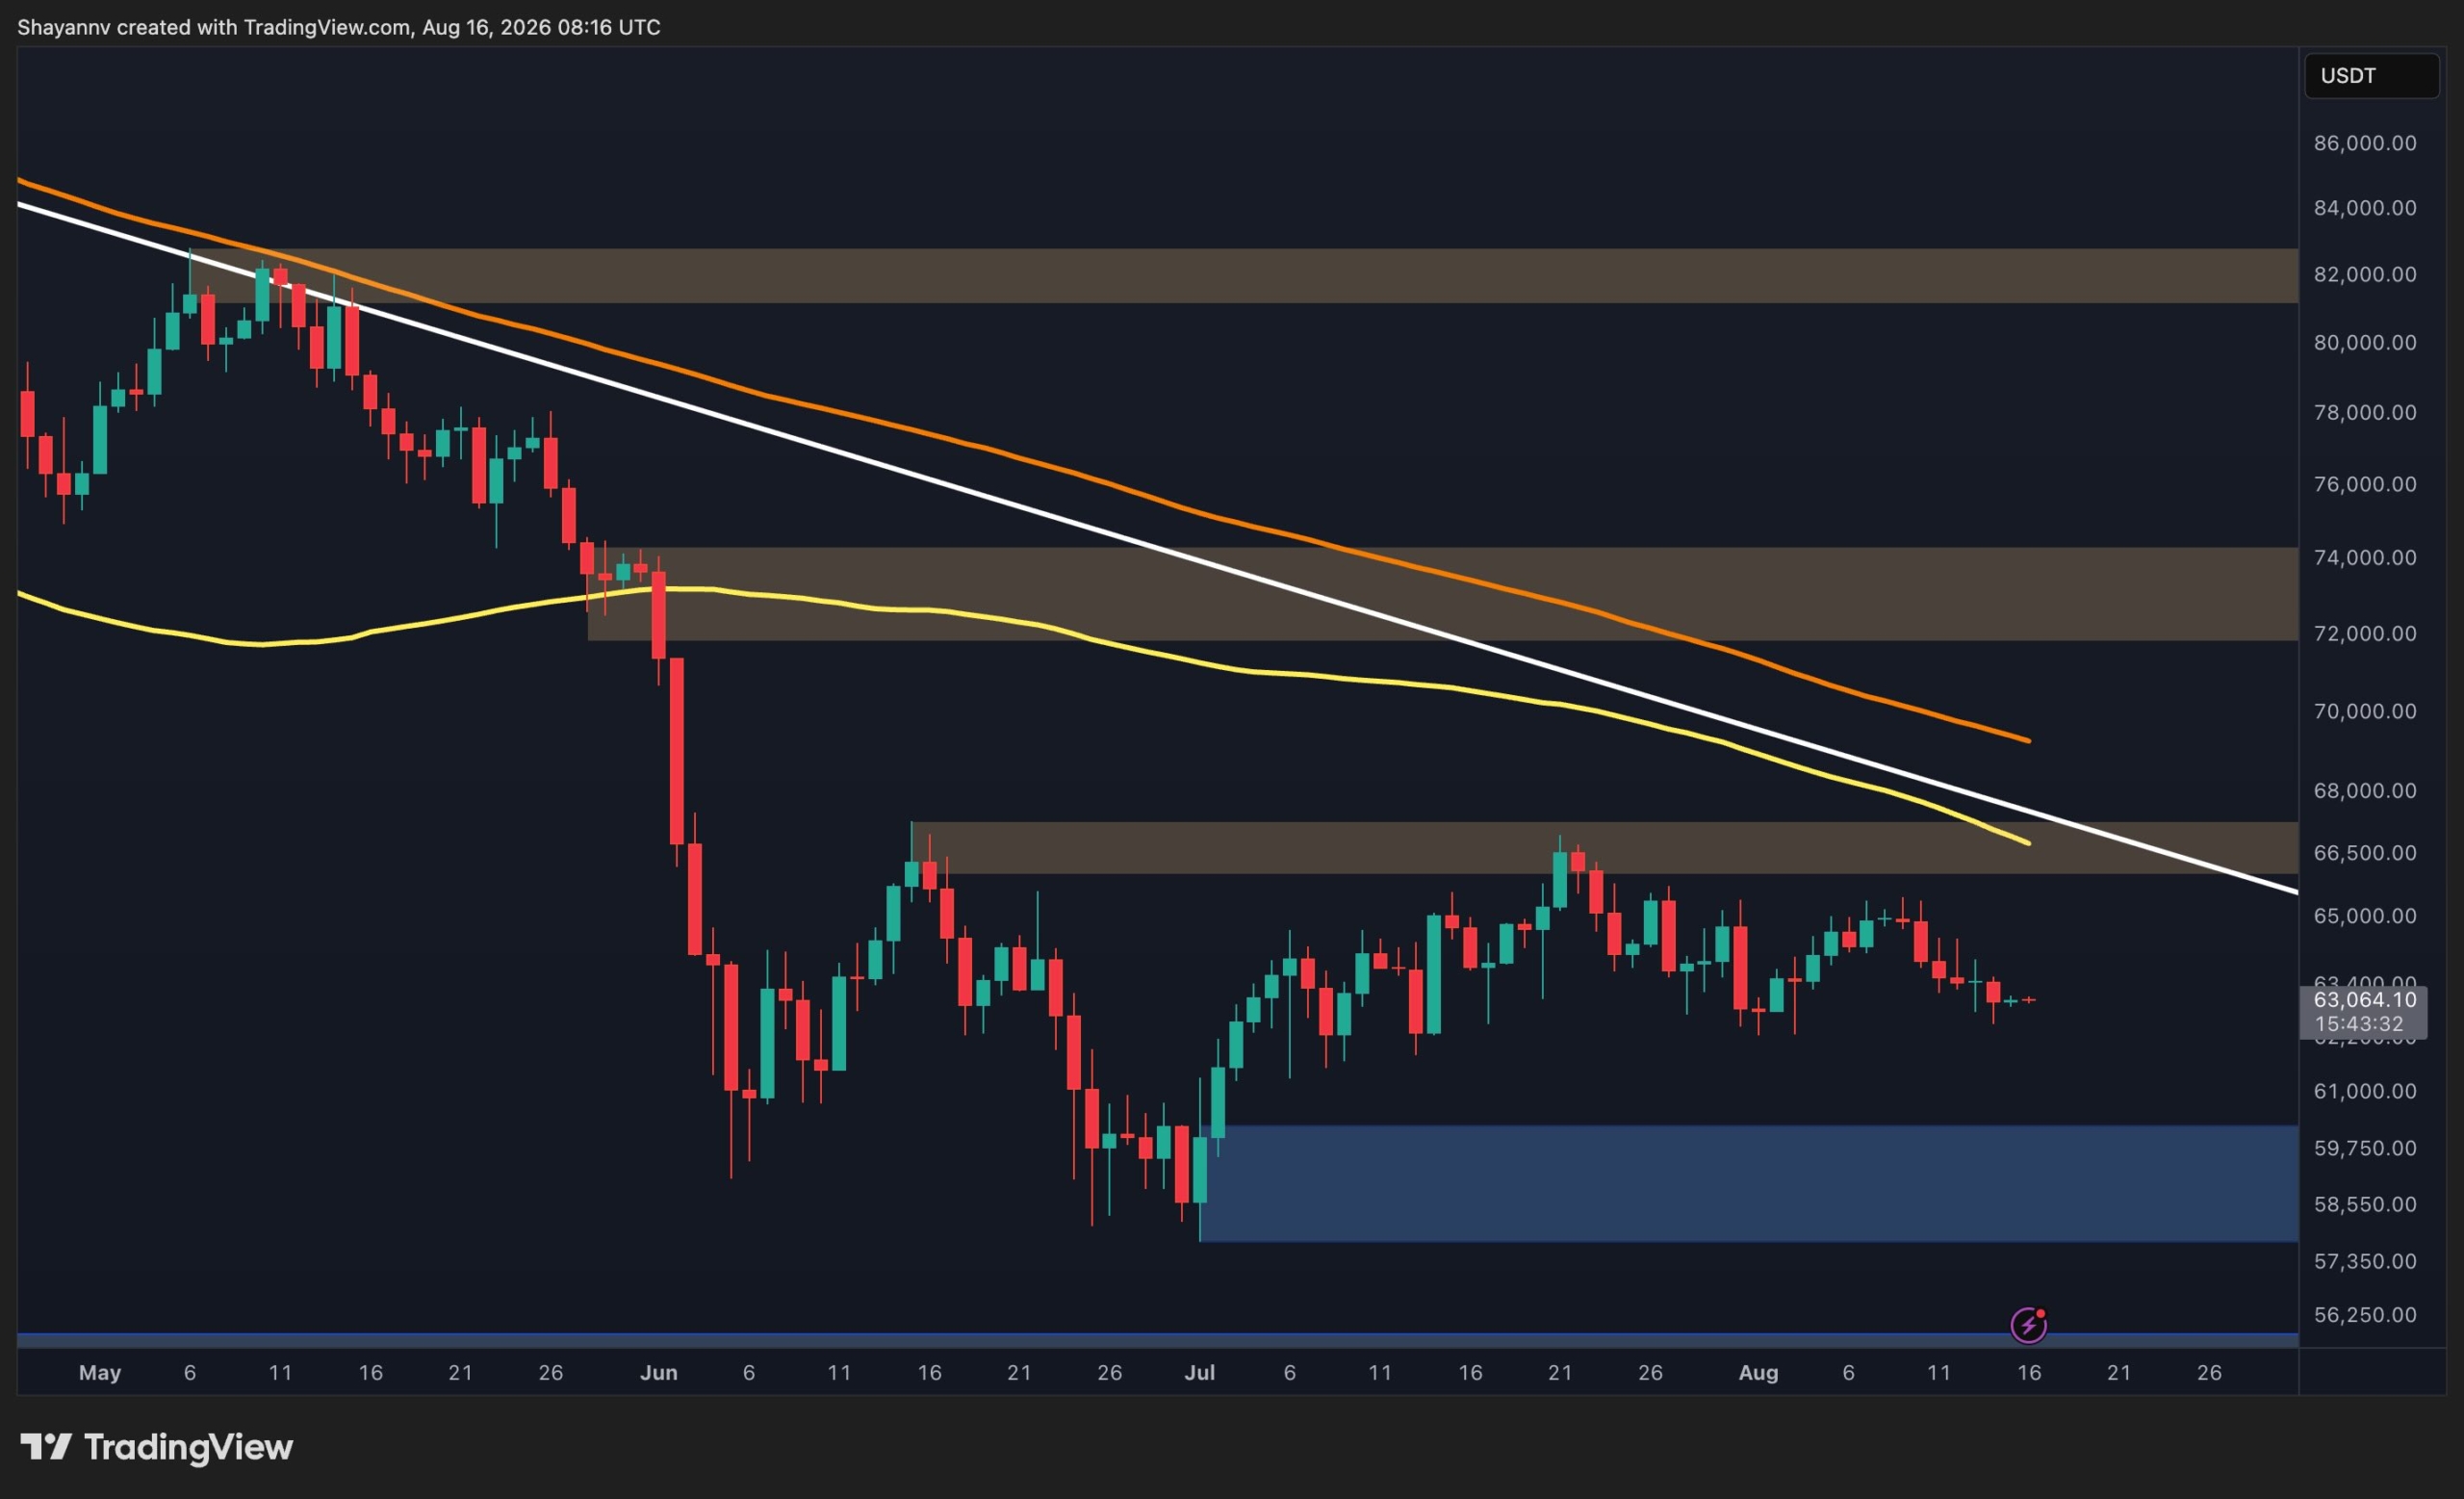
    Bitcoin is currently navigating a period of choppy consolidation, trading around the $63,000 mark with notably low volume. This sideways price action, according to the analysis, suggests a market lacking a decisive directional impulse, making its next move difficult to ascertain.

    Why This Matters

    The current market analysis indicates that Bitcoin’s price action is characterized by sideways consolidation due to limited liquidity and volume, preventing a decisive directional move. It remains uncertain whether Bitcoin may break out of its consolidation phase next week.

    Broader Context

    Source materials place the market analysis in this context: Bitcoin remains trapped in a low-momentum environment, with price action increasingly characterized by choppy consolidation rather than a decisive directional move.

    Key Technical Levels

    Resistance is identified between $66,200 and $67,200, while a significant support area lies between $58,500 and $59,800. The broader market structure remains compressed, with Bitcoin trading below major descending moving averages, and the 100-day moving average acting as an overhead reference.

    On the 4-hour timeframe, the price action is compressing between a descending upper trendline, around $64,500-$65,000, and an ascending lower trendline. This tightening range suggests that a break below the near-term support structure could lead to a revisit of lower price zones.

    Potential Downside Scenarios

    The article suggests that a notable move below the ascending lower trendline on the 4-hour chart could initiate a deeper correction. Such a move might first target the $60,300-$60,900 support zone, followed by the broader $58,100-$59,600 area. Significant liquidity concentrations exist around the current consolidation range, with notable clusters extending through the $53,000-$56,000 region. The heatmap indicates that a liquidity hunt below the $58,000 region remains a possibility if the current 4-hour support structure fails. This scenario, however, remains uncertain and requires confirmation.

    Potential Upside and Limitations

    Conversely, a notable move above the descending resistance trendline on the 4-hour chart could potentially invalidate the near-term bearish structure and improve the short-term outlook. However, the $66,200-$67,200 zone represents a more substantial resistance area that would need to be overcome for a material improvement in the short-term structure. Substantial liquidity also exists above the market around $66,000-$67,000 and at higher levels.

    The analysis highlights that the absence of significant volume favors continued consolidation rather than an immediate notable move. A downside liquidity sweep, potentially extending below $58,000, could theoretically precede a stronger bullish cycle, but this remains a speculative scenario. According to the analysis, Bitcoin would first need to reclaim key resistance zones and demonstrate meaningful volume expansion to suggest such a transition.

    Conclusion on Uncertainty

    Ultimately, the current market conditions for Bitcoin remain uncertain. The lack of liquidity and volume continues to limit follow-through, and the structure leaves room for potential liquidity-driven moves before a stronger trend develops. A decisive notable move below the $58,500-$59,800 zone would significantly weaken the bullish case, while a break above the descending trendline would introduce a more positive scenario. However, the article emphasizes that predicting the direction or timing of any significant price movement is difficult given the current ambiguous signals. The next week may provide more clarity as the consolidation range potentially resolves.

  • XRP Price Action Near $1.00: Technical Analysis Suggests Bearish Lean, Key Levels Monitored

    XRP Price Action Near $1.00: Technical Analysis Suggests Bearish Lean, Key Levels Monitored

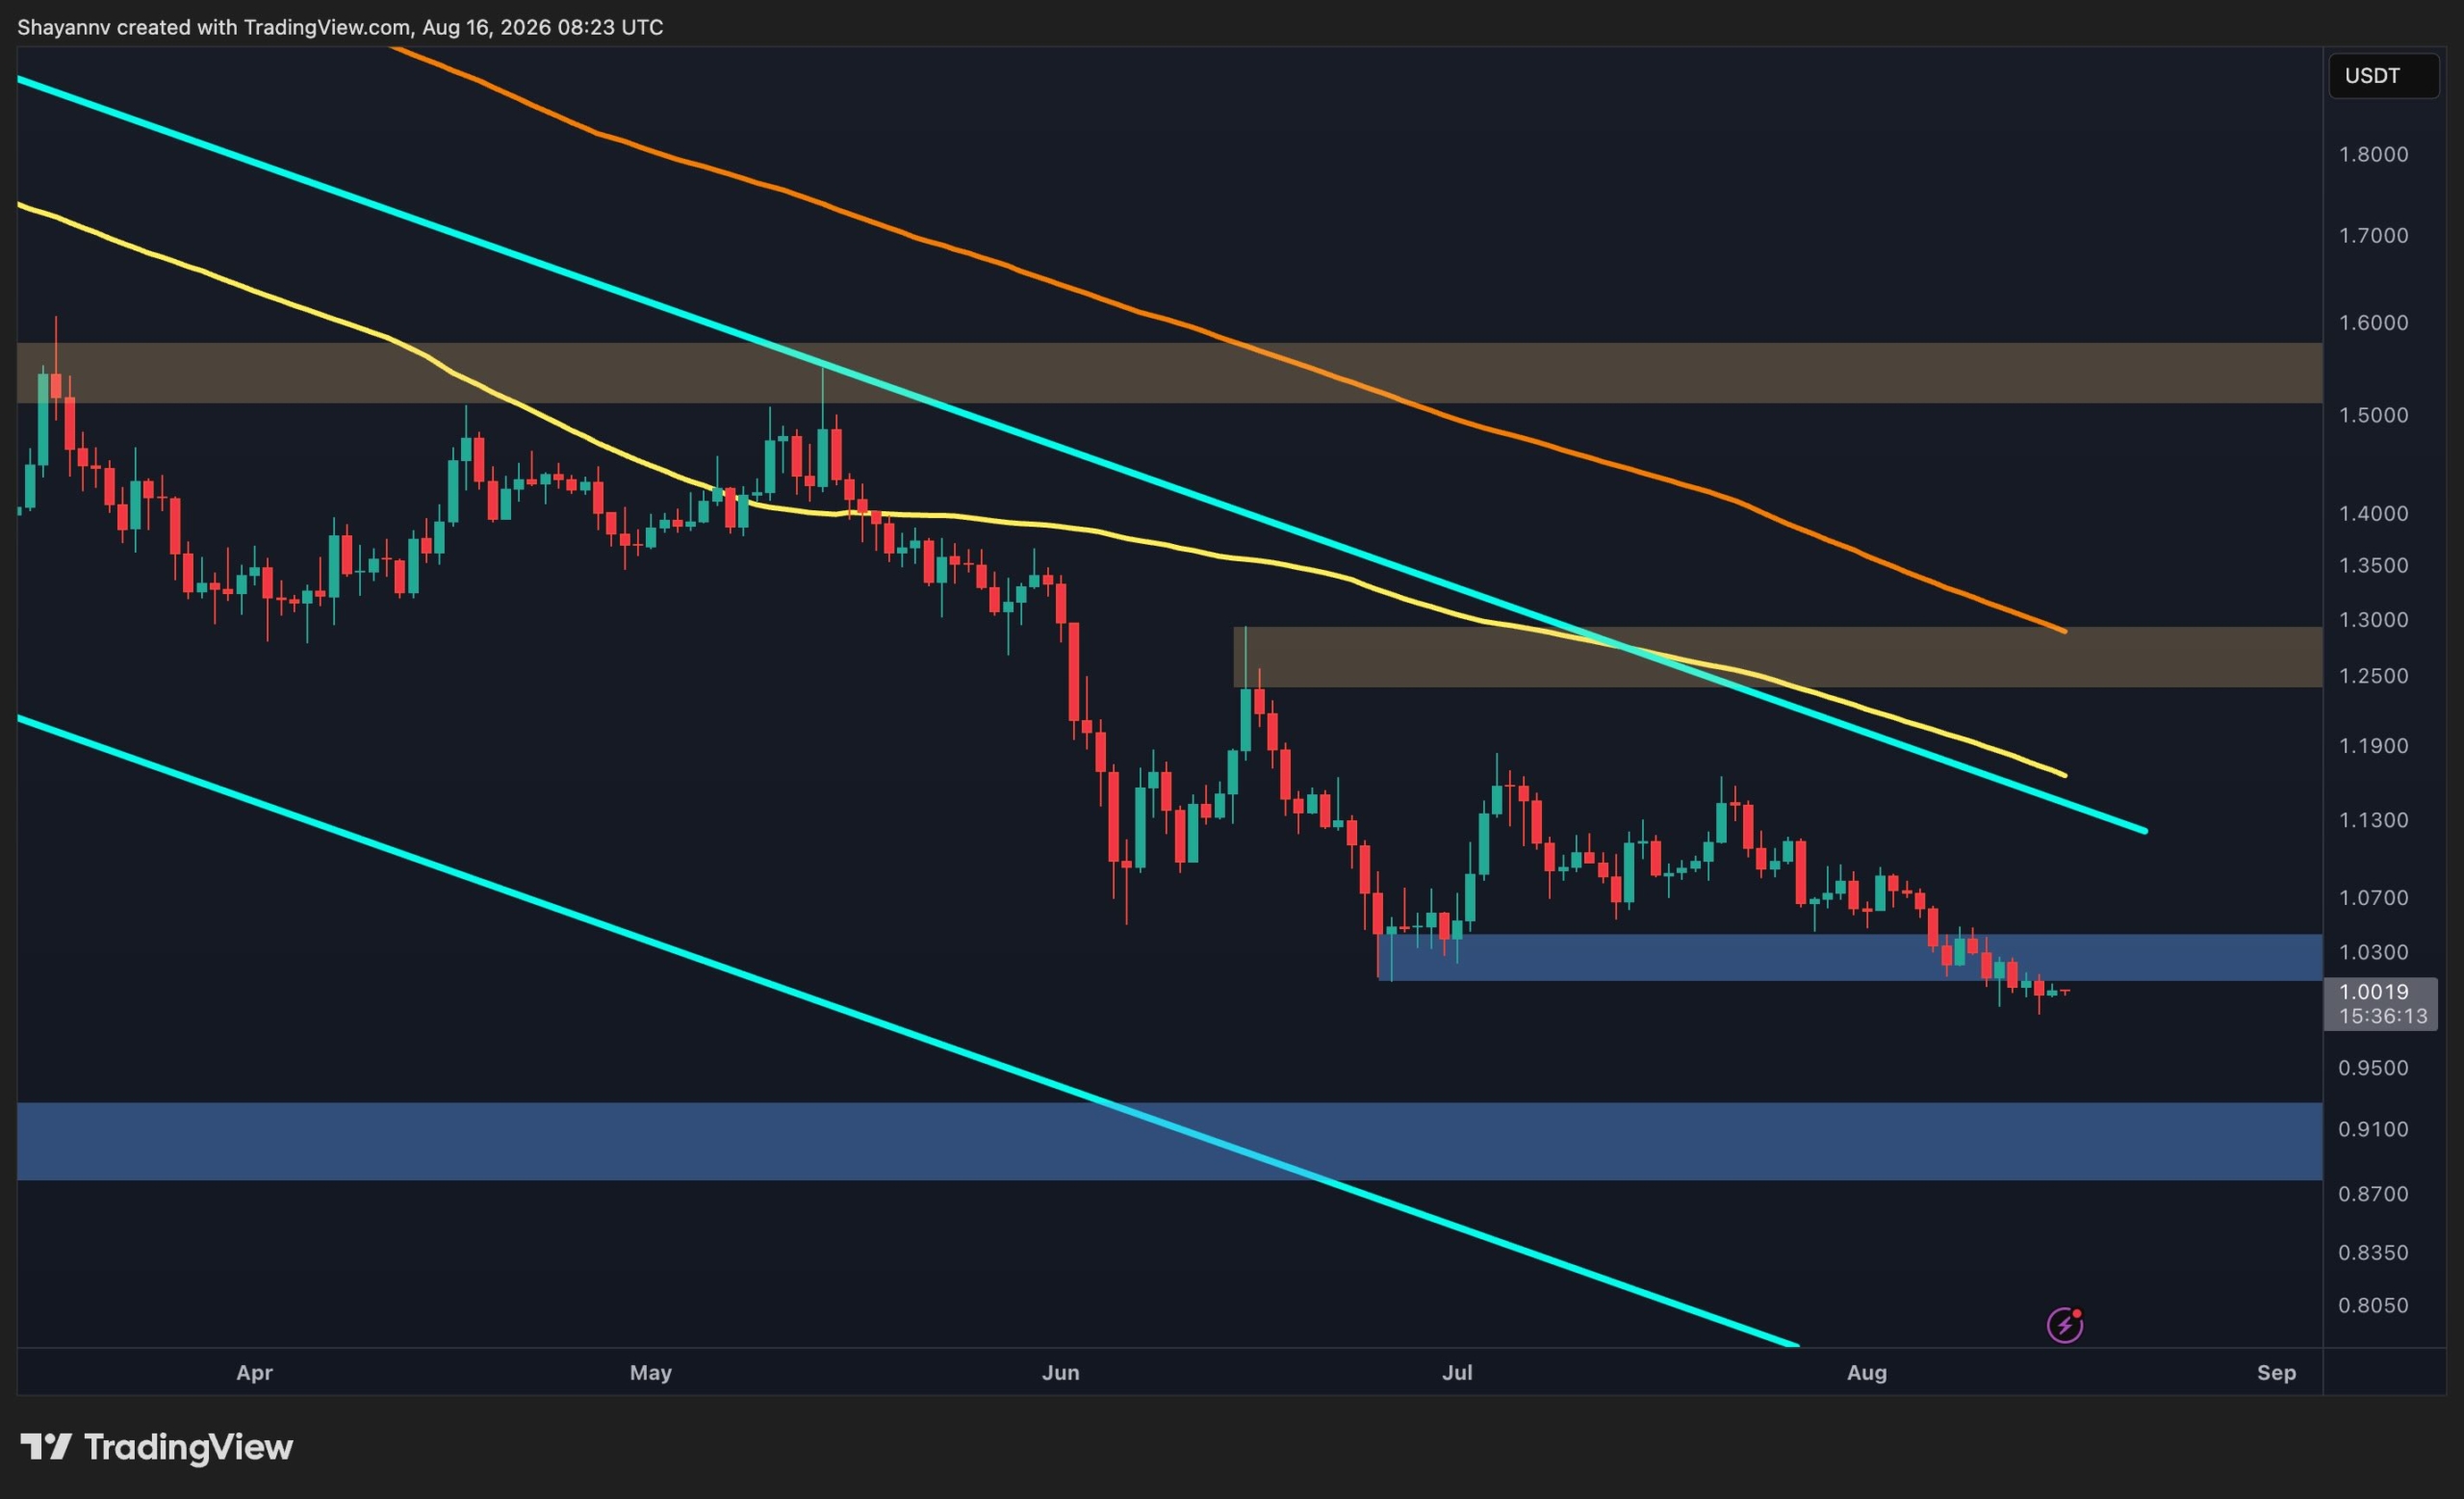
    XRP is currently trading near the $1.00 level, with prevailing technical indicators suggesting a bearish outlook. The asset is experiencing pressure, and a potential additional weakness is possible if key support levels are breached, according to market analysis.

    Bearish Structure and Momentum Observations
    The broader market structure appears to favor bears, with XRP trading below major moving averages on the daily timeframe. On the 4-hour chart, XRP has been forming lower highs beneath a descending trendline, reinforcing the bearish trend. This technical setup indicates that the market has lost momentum following previous declines, and a sustained recovery has yet to develop.

    Key Technical Levels: Resistance and Support
    Immediate resistance is identified in the $1.02-$1.04 area. XRP has recently moved below the $1.02-$1.03 support area on the 4-hour chart, suggesting that this former support may now act as resistance. The descending trendline overhead further reinforces the bearish structure.

    Immediate support is observed around the $1.00 level. However, if this level fails decisively, the next major downside reference is the demand zone between $0.91 and $0.97. This region represents the next significant support visible on the daily chart and could become relevant if the current consolidation resolves to the downside. A sustained move below the $1.00 area could expose this demand zone.

    Consolidation and Potential Scenarios
    The current consolidation just below $1.00 suggests that sellers have not completely lost control, although momentum is becoming compressed. The 4-hour chart presents a more immediate bearish picture, with recent rebound attempts repeatedly failing to produce a meaningful structural move. The lack of a strong bullish reversal suggests that the market may still be in a corrective phase.

    For the bearish setup to weaken, a sustained recovery above the $1.02-$1.04 resistance zone and a break above the descending trendline would be necessary to materially improve the daily structure. A stronger recovery above the $1.06-$1.08 area would provide a more convincing signal that the current downtrend is losing momentum. Until such a break occurs, the path of least resistance appears tilted to the downside, with the potential for another test of lower support levels remaining a possibility.

    Why This Matters

    The current market analysis indicates that XRP is trading below major moving averages and within a descending structure, suggesting a bearish trend. The uncertainty remains regarding whether XRP can defend the $1.00 level.

    Broader Context

    This market analysis is presented in the context of discussions surrounding XRP’s price movements. The post Ripple Price Prediction: Can XRP Defend $1 or Will $0.90 Come Into Play Next? appeared first on CryptoPotato.