Tag: Market Trends

  • US Spot Ethereum ETFs Face Redemptions; ETHA Outflows Significant

    US Spot Ethereum ETFs Face Redemptions; ETHA Outflows Significant

    Clients of BlackRock’s iShares Ethereum Trust (ETHA) withdrew $75.07 million on October 12, 2026, contributing to the $85.4 million in net outflows across all US spot Ethereum ETFs that day. This marked the continuation of a nine-day streak of redemptions for Ethereum ETFs.

    Key Outflow Figures and Trends

    For the week ending October 9, 2026, spot Ethereum ETFs collectively saw net redemptions totaling $542.1 million, the largest weekly outflow since January 2026. The iShares Ethereum Trust (ETHA) was responsible for approximately 88% of these weekly redemptions, highlighting its significant influence on the overall Ethereum ETF market.

    These outflows from ETHA follow previous notable withdrawals, including roughly $110 million on September 16, 2026, and approximately $201.9 million on October 6, 2026. Despite these redemptions, Ethereum was trading around $2,500 on October 12, 2026.

    Comparative Market Context

    In contrast to the outflows from Ethereum ETFs, Bitcoin ETFs experienced mixed to positive inflows during the same periods. According to the article, this divergence may suggest a potential tactical rotation among digital asset investors rather than a wholesale retreat from the crypto market.

    Historical Performance and Fund Details

    Spot Ethereum ETFs were introduced in the US in mid-2024, with the iShares Ethereum Trust (ETHA) launching in July 2024. Since its inception, ETHA has accumulated over $12.7 billion in cumulative net inflows. As of October 12, 2026, total assets under management across all US spot Ethereum ETFs stood at approximately $15.86 billion, representing about 5.15% of Ethereum’s total market capitalization. The ETHA fund has a sponsor fee of 0.25%.

    Uncertainty and Future Outlook

    The significant role of ETHA in recent outflows raises questions about the broader health and stability of the US spot Ethereum ETF market. The long-term behavior of BlackRock’s ETHA clients and its subsequent impact on the Ethereum ETF category remain an area of uncertainty. While recent outflows are a notable data point, their full implications for the market are still unfolding.

  • Bybit Expands Trading to Over 1,000 U.S. Stocks and ETFs

    Bybit Expands Trading to Over 1,000 U.S. Stocks and ETFs

    Bybit has enabled eligible users to trade over 1,000 U.S.-listed stocks and Exchange Traded Funds (ETFs) directly within their existing cryptocurrency trading accounts. This new service connects stablecoin balances with underlying securities, allowing users to trade U.S. equities.

    The platform’s expansion into U.S. securities signifies a diversification beyond its core digital asset offerings. By offering trading for a broad selection of over 1,000 U.S. stocks and ETFs, Bybit is creating a more integrated trading environment.

    This development blurs the lines between the cryptocurrency and traditional financial markets, potentially offering investors access to both digital assets and traditional securities through a single platform.

    Why This Matters

    Bybit’s move to integrate U.S. stocks and ETFs into its crypto trading accounts represents a significant step in blurring the lines between traditional finance and the cryptocurrency ecosystem. This expansion extends Bybit’s platform beyond digital assets into conventional investments, potentially setting a precedent for other platforms.

    Broader Context

    This development signifies a notable step in the evolution of digital asset platforms, integrating traditional financial assets with digital asset trading infrastructure. The service connects stablecoin balances with underlying securities, allowing eligible cryptocurrency traders to buy more than 1,000 U.S.-listed stocks and ETFs.

  • Bitcoin Dips Below $81.5K, Ethereum Falls Under $2,425 Amid $770M Liquidations

    Bitcoin Dips Below $81.5K, Ethereum Falls Under $2,425 Amid $770M Liquidations

    Crypto Market Sees Significant Pullback, Bitcoin Drops Below $81.5K

    The cryptocurrency market experienced a notable downturn on December 13th, with Bitcoin falling below the $81,500 mark. The digital asset saw a 2.9% decline in the past 24 hours, trading at $81,510. Ethereum also slipped below $2,425, experiencing a steeper drop of 4.8%. Solana (SOL) and XRP (XRP) followed suit, with both cryptocurrencies plummeting between 6% and 7%.

    The broad market correction led to over $770 million in liquidations across crypto derivatives markets, predominantly affecting long positions which accounted for $685 million of the total. This indicates a significant unwinding of leveraged bets on price increases, signaling a cooling of market sentiment from the “greed” territory.

    Liquidation Surge Highlights Leveraged Position Unwinding

    Data from CoinGlass revealed that as of 9 AM on December 13th, total 24-hour liquidations reached $770 million. The overwhelming majority, $685 million, comprised long positions, while short positions accounted for only $85 million. This stark imbalance underscores the heavy impact on bullish leveraged positions during the current pullback.

    Bitcoin has been on a downward trend since reaching a high of $86,790 on October 2nd, accumulating a decline of over 6% in the past two weeks. Ethereum has also retreated from its peak of $2,754. Both major cryptocurrencies have broken key psychological levels this week, triggering a cascade of liquidations.

    Broader Market Influences and Risk-Off Sentiment

    The downturn in the crypto market appears to be influenced by broader financial market trends. U.S. stocks closed mixed on Monday, December 12th, with the S&P 500 down 0.09% and the Nasdaq Composite falling 0.49%, while the Dow Jones Industrial Average rose 0.34%. This divergence saw capital shift away from large-cap tech stocks towards industrial and financial sectors.

    Concurrently, a strengthening U.S. dollar and elevated U.S. Treasury yields have continued to suppress risk assets. In the absence of significant new buying interest, cryptocurrencies have mirrored the correction seen in U.S. tech stocks.

    Altcoins Suffer Deeper Losses Amidst Risk Aversion

    Major altcoins experienced substantial declines. Solana was trading at $103.18, down 7.6% in the last 24 hours and briefly touching a low of $101.69. XRP was priced at $1.3233, a 6.2% decrease. The current sell-off has disproportionately affected high-beta cryptocurrencies, indicating a clear contraction in market risk appetite and a continued withdrawal from leveraged and speculative positions.

    Technical Indicators Suggest Weakening Momentum

    On a daily candlestick basis, Bitcoin closed at $81,850. Its 14-day Relative Strength Index (RSI) stands at 47.2, placing it in neutral territory. The moving average arrangement shows the closing price below the 20-day Simple Moving Average (SMA20) at $84,046, but above the 50-day SMA (SMA50) at $81,047 and the 200-day SMA (SMA200) at $72,083. The Moving Average Convergence Divergence (MACD) is in bearish territory, with its histogram widening compared to the previous day, suggesting continued weakening momentum.

    Immediate overhead resistance levels for Bitcoin are at the SMA20 ($84,046), the upper Bollinger Band ($86,404), and the 30-day high ($87,396). Downside support is found at the lower Bollinger Band ($81,688), the SMA50 ($81,047), and the 30-day low ($74,968). The current closing price is hovering near the lower Bollinger Band, indicating a potential battleground in this zone in the short term.

    Ethereum closed at $2,447. Its 14-day RSI is at 37.6, indicating a weaker position. The closing price is below the SMA20 ($2,636) and SMA50 ($2,556), but above the SMA200 ($2,137). The MACD is also in bearish alignment with an expanding histogram, further signaling weakening momentum.

    Key resistance for Ethereum includes the lower Bollinger Band ($2,456), the SMA50 ($2,556), and the SMA20 ($2,636). Downside support is located at the 30-day low ($2,359) and the SMA200 ($2,137).

    Fear and Greed Index Cools, Market Shifts Towards Neutral

    The Fear and Greed Index registered 57 on December 13th, a significant drop from the previous day’s 69. Over the past eight days, the index has fluctuated between 57 and 73, suggesting a shift from the “greed” zone towards a more neutral market sentiment.

    Bitcoin has retraced approximately 6% from its early October high. The ability of the cryptocurrency to reclaim the $84,000 level (SMA20 resistance) will be a key focus for bulls. Until pressures from the U.S. dollar and yields abate, risk appetite in the market is expected to remain cautious.


  • Bitcoin Drops Below $82K Amid $120M Crypto Long Liquidation

    Bitcoin Drops Below $82K Amid $120M Crypto Long Liquidation

    Bitcoin’s recent price dip below $82,000 triggered immediate losses for leveraged traders, with approximately $120 million in long positions across the cryptocurrency market being liquidated within a mere 15 minutes.

    Rapid Liquidation Event

    The sharp decline saw Bitcoin fall below the $82,000 threshold during intraday trading on October 12. As the price tumbled, cryptocurrency exchanges began to forcibly close leveraged long positions – bets placed by traders anticipating further price increases. This forced selling, known as liquidation, can create a cascading effect, as each automatic sell order adds downward pressure to the market.

    Data from analytics platforms like CoinGlass and Hyperliquid indicated a significant concentration of long positions among traders leading up to this market move. CoinGlass reported that these long positions constituted the majority of liquidations in recent events, suggesting that short-sellers, who bet on price declines, experienced a more favorable trading period.

    At the time of reporting, Bitcoin was trading in the low $82,000s. Traders were closely monitoring a support zone between $81,300 and $82,000, an area where buying interest has historically emerged.

    Previous Market Volatility

    This recent event follows a more substantial liquidation episode on October 8, when Bitcoin dropped below $81,000, reaching intraday lows between $80,400 and $80,500. That earlier slide resulted in over $1 billion in liquidations within a 24-hour period, predominantly affecting long positions, with an additional $696 million in related liquidations occurring concurrently.

    While Sunday’s $120 million liquidation figure may appear modest in comparison, the speed at which it occurred is noteworthy. The October 8 liquidations accumulated over a full day, whereas the latest event transpired in just a quarter of an hour.

    Both recent price drops followed a rally that had propelled Bitcoin to highs between $85,000 and $87,000 earlier in October. Profit-taking near the $87,000 peak is believed to have initiated the subsequent retreat.

    ETF Outflows and Market Dynamics

    Adding to the selling pressure, U.S. spot Bitcoin Exchange-Traded Funds (ETFs) reportedly experienced outflows totaling $487 million in a single day, diminishing a significant source of consistent buying demand.

    No major regulatory actions or protocol changes were reported in connection with this period of price volatility. The market swings appear to be primarily driven by traders unwinding leverage rather than any specific fundamental news.

    Following earlier sharp declines, Bitcoin has shown resilience, rebounding at one point to trade above $83,000.

    Key Levels to Watch

    The $81,300 to $82,000 support band remains a critical near-term level to monitor. A decisive break below this zone could trigger another wave of forced selling if traders continue to hold substantial leveraged positions.

    While a single day of $487 million in ETF outflows does not necessarily signal a sustained trend, continued redemptions would imply reduced institutional demand to absorb selling pressure when leveraged traders are liquidated.

    The October 8 low around $80,400 also serves as a key reference point. A return to this level would place the market back at the bottom reached during the day of over $1 billion in liquidations.

  • Sweeney Mocks Bets on Underwear, Dictator Deaths in New Novig Ad

    Sweeney Mocks Bets on Underwear, Dictator Deaths in New Novig Ad

    Sydney Sweeney Stars in New Novig Ad Targeting Industry Rivals

    Sydney Sweeney has returned for a new advertisement promoting Novig, a sports-only prediction market. The 30-second spot retains the “just sports” slogan introduced during the platform’s September launch. This latest campaign, however, sharpens its focus on what Novig describes as insider trading, bot activity, and the controversial inclusion of “war bets” on other industry platforms.

    The ad positions Novig as a dedicated space for sports predictions, implicitly contrasting it with competitors that offer a broader, and in Novig’s view, less focused, range of speculative markets. The “sports-only” approach is presented as a cleaner, more focused alternative for users interested solely in athletic contests.

  • Solana Treasury Firm Buys SOL Amid Record CHAD Preferred Stock

    Solana Treasury Firm Buys SOL Amid Record CHAD Preferred Stock

    DeFi Development Corp Boosts Solana Holdings Amid Market Volatility

    DeFi Development Corp (DFDV), a Nasdaq-listed entity focused on Solana, significantly expanded its treasury last week by acquiring approximately 22,070 SOL tokens, valued at around $2.37 million, along with other “SOL equivalents,” according to a press release issued Monday.

    This latest acquisition brings DFDV’s total holdings to roughly 2,586,282 SOL tokens, currently worth approximately $287 million, with SOL trading near $111. The company’s weekly SOL purchases have shown a declining trend, decreasing from 101,381 SOL (approximately $11.4 million) in mid-September to 47,706 SOL ($5.8 million), and most recently to 26,202 SOL ($3.1 million).

    DFDV operates as a digital asset treasury company, enabling public investors to gain exposure to cryptocurrency without direct account ownership. The firm was formerly known as Janover, a real estate software company, before pivoting to a Solana-centric strategy in April 2025 and adopting a model similar to Strategy’s Bitcoin approach.

    Perpetual Preferred Stock Reaches New Highs

    The company’s perpetual preferred stock, branded as CHAD, achieved an all-time high in the week ending October 9, nearing the $10 mark. Perpetual preferred shares do not have a maturity date and receive dividends before common stockholders. CHAD offers a variable annual dividend of 13% on its $10 stated value, equating to $1.30 per share, with declarations made daily.

    “CHAD reaching new highs and approaching $10.00 even as SOL pulled back is an encouraging sign that investors are recognizing its distinct income proposition,” stated Dan Kang, Chief Strategy Officer. He added, “For common shareholders, CHAD provides a funding source that can support accretive SOL per share growth without issuing additional common shares. For CHAD holders, it offers daily income supported by that growing, productive treasury.”

    However, the significance of this record price is tempered by the fact that CHAD shares were priced at $8 during their initial public offering in September, below their stated par value. Last week, DFDV also authorized share buybacks for instances where CHAD trades below its $10 par value, suggesting a concerted effort to support its price.

    Funding Strategy and Market Pressures

    DFDV finances its SOL acquisitions through a $300 million at-the-market program, which involves the gradual sale of new CHAD shares at prevailing market prices. The closer CHAD’s trading price is to $10, the more SOL can be purchased with each newly issued share.

    “Short-term volatility has not changed our conviction or our commitment to accumulating SOL,” commented CEO Joseph Onorati in the press release.

    The broader cryptocurrency market has experienced significant fluctuations. SOL saw a decline of approximately 9% over the past seven days, and nearly $1 billion in long positions were liquidated within a 24-hour period. Liquidation occurs when traders using leverage face margin calls due to price drops, leading to automatic selling that can further depress prices.

    Dividend Sustainability and Company Valuation

    While a 13% dividend may appear attractive, CHAD is backed by a company whose primary asset, SOL, is trading approximately 62% below its January 2025 peak of around $295. The company’s own press release acknowledges that staking rewards may not be sufficient to cover dividend payments.

    DFDV’s common stock was trading near $4.41 on Monday, giving it a market capitalization of approximately $140 million. This valuation is roughly half the value of its SOL holdings, although the company also carries debt. When a treasury company’s stock trades below the value of its cryptocurrency reserves, the rationale for selling shares to acquire more tokens diminishes, contributing to pressure within the sector.

    CHAD holders are set to continue receiving a daily dividend of $0.00516 per share through October 30. The next significant economic indicator for the market is expected on Wednesday with the release of the U.S. September inflation report.

  • ICP Surges 14% Daily, Further Gains Expected

    ICP Surges 14% Daily, Further Gains Expected

    Internet Computer (ICP) Surges 14% in a Day, Analysts Eye Further Gains

    New York, NY – October 12, 2023 – The popular altcoin Internet Computer (ICP) is experiencing a significant surge today, marking one of the best-performing cryptocurrencies with a double-digit increase pushing its price to approximately $3.40. This notable upward movement has captured the attention of prominent analysts, who suggest the token could be poised for further appreciation in the near future, bolstered by supportive technical indicators.

    Analyst Optimism and Technical Signals

    Among those bullish on ICP is X user Lucky, who pointed to the cryptocurrency’s robust uptrend and ample room for growth, projecting a potential climb beyond $8. Lucky, who commands a following of nearly two million, also highlighted ICP’s “loudest and most passionate communities in crypto.”

    Analyst CW echoed this sentiment, having previously predicted that a break above the $3.39 mark, which has now occurred, would signal a return to bullish territory for ICP. Meanwhile, EliZ stated that the price action has unfolded precisely as forecasted, anticipating an ascent past $4.

    Adding to the optimistic outlook, WIZZ noted that Internet Computer historically performs well in the final quarter of the year. WIZZ confirmed their own investment in the asset, indicating no plans to divest in the coming months.

    However, a closer examination of historical data reveals a mixed performance for ICP in Q4. While the token has finished the fourth quarter in negative territory in three out of the last five years, the final quarter of 2023 has already proven exceptionally strong, with its price skyrocketing by over 320%.

    RSI and Exchange Netflow Support Bullish Case

    Further reinforcing the optimistic projections, ICP’s Relative Strength Index (RSI) suggests that the price may indeed align with the analysts’ expectations. This technical analysis tool, which measures the speed and magnitude of price changes, is currently positioned just above the 70 mark, a level typically interpreted as indicating strong upward momentum and potentially signaling an impending correction, but currently supporting the bullish narrative.

    The asset’s exchange netflow also warrants attention. In recent weeks, outflows from exchanges have consistently outnumbered inflows. This trend suggests a shift among investors towards self-custody, thereby reducing immediate selling pressure on the market.

  • Bitfinex Securities Launches Tokenized Funds with Tether’s Hadron

    Bitfinex Securities Launches Tokenized Funds with Tether’s Hadron

    Bitfinex Securities has launched capital raises for two tokenized funds managed by CMCC Global, broadening its platform with dollar and Bitcoin-denominated investment strategies.

    New Tokenized Funds Expand Investment Options

    The new offerings encompass the Crest Fund and the Liberty Bitcoin Accumulation Fund (LBAF). Both funds are being tokenized utilizing Tether’s Hadron platform, according to a press release. Subscriptions are open to eligible investors until October 29, with secondary trading anticipated to commence after the capital raises conclude. Bitfinex Securities stated these products mark the debut of tokenized funds of funds issued under El Salvador’s digital asset regulatory framework.

    CMCC Global, in partnership with Bitcoin analyst Willy Woo, co-founded both funds. Crest was launched in March 2022, while LBAF began operations in April 2025. Both funds allocate capital to quantitative managers employing strategies such as funding rate arbitrage, market making, and cross-exchange arbitrage within decentralized finance (DeFi).

    Investment Strategies and Return Targets

    The Crest Fund is denominated in U.S. dollars and aims to achieve returns exceeding those of U.S. Treasury bills. The LBAF, conversely, measures its returns in Bitcoin and targets net annualized returns between 8% and 12%, as detailed by Martin Baumann, Managing Partner at CMCC Global.

    “Both funds leverage diversified portfolios of quantitative, market-neutral strategies, rather than relying primarily on the directional performance of digital-asset markets,” Baumann explained. CMCC Global has previously characterized LBAF as a strategy designed to generate Bitcoin-denominated yield through quantitative trading, with its return targets expressed in Bitcoin rather than U.S. dollars.

    Token Details and Investor Benefits

    CREST tokens will be issued at $10 each, and LBAF tokens at 0.0001 BTC each. The minimum investment requirement is one token, subject to investor eligibility and verification.

    The offerings include a six-month period post-listing during which performance fees will be reduced by 50%, and redemption fees will be waived. These benefits will extend to tokens traded on the secondary market for the remainder of this introductory period.

    Fund Structure and Compliance

    Both funds are structured as segregated portfolios under CMCC Global SPC in the Cayman Islands. The tokens represent economic interests in underlying participating shares held in trust by BFXS (PTC) Limited. Tokens will be minted against these underlying shares and subsequently burned upon redemption. All transfers will be subject to identity verification and anti-money laundering controls. Eligible investors will have the ability to hold tokens in approved wallets and trade them 24/7 on Bitfinex Securities.

    Tether introduced Hadron in November 2024 as a platform for the issuance and management of tokenized assets, including equities, debt, and funds. The platform’s capabilities include token issuance and burning, compliance, and lifecycle management.

    These new offerings enhance Bitfinex Securities’ product suite, which already includes tokenized debt, Bitcoin hashrate contracts, and U.S. Treasury bills. The company reports listing over $500 million in assets and recently concluded a $50 million capital raise for Alkemya Metacore, its largest to date.

  • XRP Faces Uncertainty After Resistance Rejection

    XRP Faces Uncertainty After Resistance Rejection

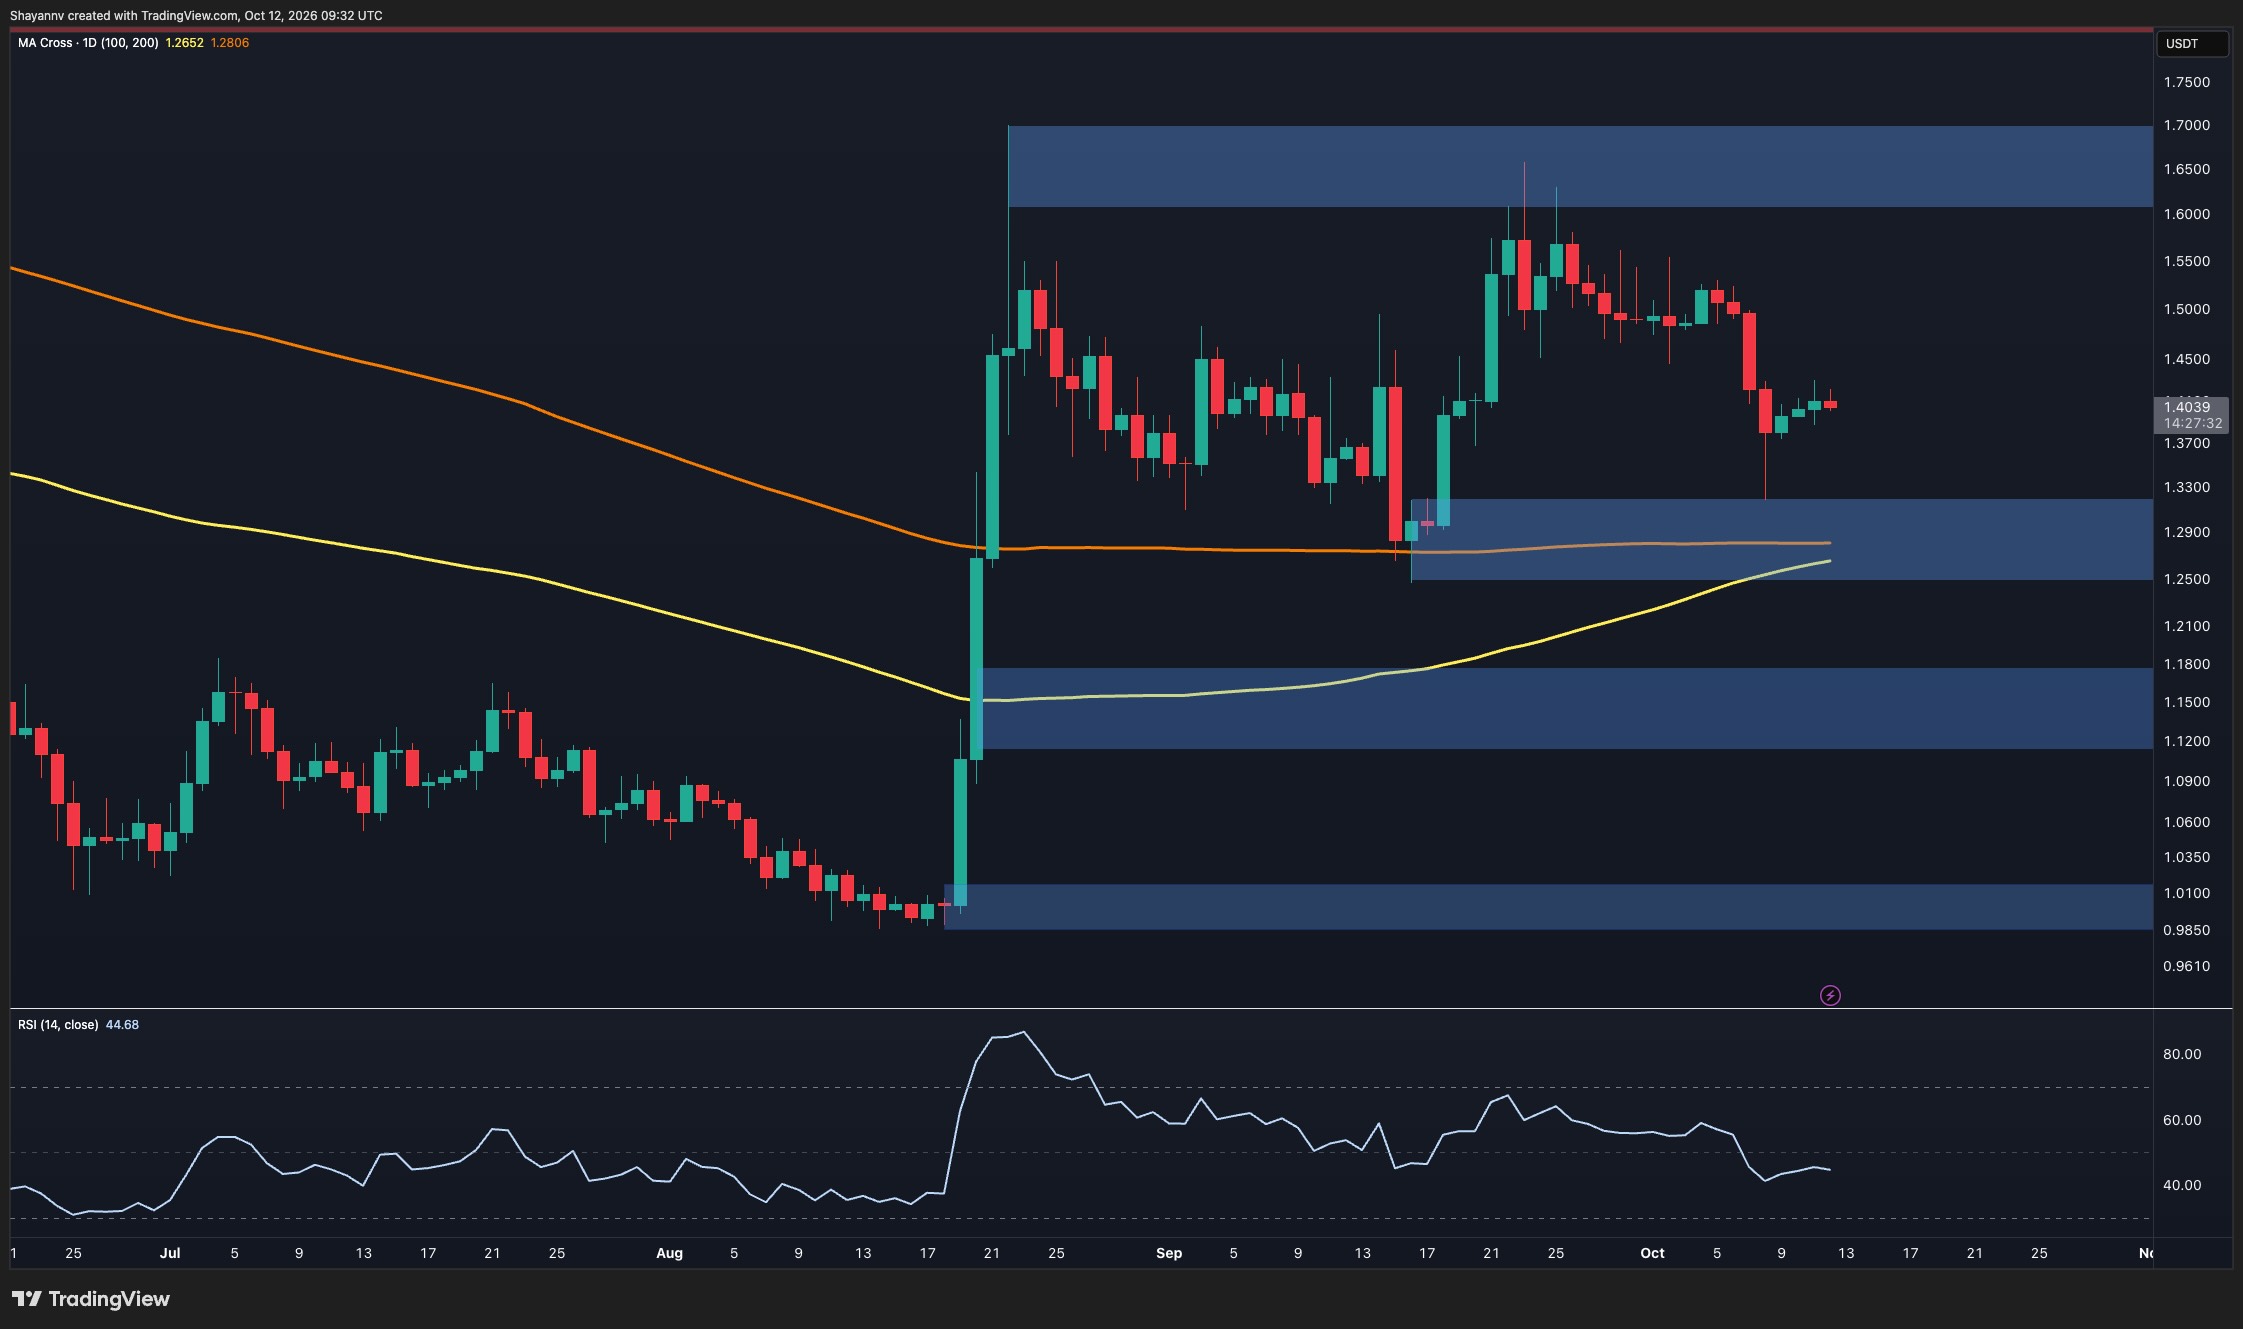
    XRP’s recent surge has faltered near the $1.40 mark, following a significant downturn from its prior consolidation phase. While buyers have shown interest around a key demand area, the cryptocurrency’s price is currently struggling to overcome immediate resistance and remains within a corrective pattern.

    On the daily chart, Ripple’s native token has continued its corrective move after being rejected from the $1.61-$1.70 resistance zone. The latest sell-off saw the price dip below the $1.48-$1.50 consolidation range, with a notable lower wick extending to approximately $1.32 before buyers intervened. Subsequent trading sessions have shown stabilization around $1.40, though the recovery has lacked sustained momentum.

    The $1.25-$1.32 demand zone is proving to be a critical level. This area coincides with the 100-day and 200-day moving averages, which are situated near $1.265 and $1.281, respectively. The upward trajectory of the 100-day average, as it approaches the 200-day average from below, hints at a potential bullish crossover, though this remains unconfirmed. Concurrently, the daily Relative Strength Index (RSI) hovers around 45, indicating that momentum is still below the neutral mark despite the recent bounce.

    Sustaining the current demand zone could help preserve the broader recovery trend and pave the way for another attempt at the $1.48-$1.52 resistance area. Beyond that, the $1.61-$1.70 supply zone stands as the primary obstacle to further upside. Conversely, a decisive break below $1.25 would undermine the recovery structure and expose the next significant support zone, located between $1.11 and $1.18.

    Technical Outlook on Shorter Timeframes

    The 4-hour chart illustrates XRP trading within a descending channel, characterized by a series of lower highs that reinforce the corrective trend. The recent decline saw the price breach the $1.43-$1.45 support level before briefly touching the channel’s lower boundary near $1.32. Buyers then initiated a rebound, pushing the price back towards $1.42, where it encountered renewed selling pressure.

    The former $1.43-$1.45 demand zone has now transitioned into an overhead resistance area. Its proximity to the upper boundary of the descending channel presents a substantial hurdle for upward price movement. A sustained push above both these levels would offer an initial indication that selling pressure is abating and could potentially open the path towards the $1.48-$1.52 resistance region.

    Until such a breakout materializes, the current rebound appears to be a corrective phase. A loss of immediate support around $1.38 would bring the $1.34-$1.35 area back into focus, followed by the more significant $1.25-$1.32 demand zone. Consequently, the market’s reaction to the $1.43-$1.45 resistance area will be pivotal in determining whether XRP can break free from its descending channel or remains susceptible to further declines.

  • Bitcoin Exchange Inflows: A Mixed Signal Amid Data Ambiguity

    Bitcoin Exchange Inflows: A Mixed Signal Amid Data Ambiguity

    Centralized exchanges saw a net inflow of 11,593 Bitcoin (BTC) over a recent three-day period, a development that contrasts with a larger net outflow observed in the preceding month. However, the significance of this inflow remains uncertain due to considerable discrepancies in how different analytics providers report total exchange holdings.

    Broader Context

    Source materials place the factual news in this context: Different analytics providers report different totals for how much Bitcoin exchanges actually hold.

    Contrasting Flows: Short-Term In vs. Long-Term Out

    Over the 30 days leading up to approximately October 12, 2026, centralized exchanges experienced net outflows totaling 28,599 BTC. The recent three-day inflow of 11,593 BTC interrupts this trend, suggesting a potential shift in participant behavior. This movement implies that some market participants may be positioning their assets on exchanges for quicker access, potentially for trading, collateralization, or rebalancing purposes. However, the exact intent behind these movements cannot be definitively determined from wallet data alone.

    The Challenge of Data Discrepancies

    A significant challenge in interpreting these flows is the wide variation in estimates for total Bitcoin holdings on exchanges. While some providers estimate holdings as low as 2.68 million BTC, others place the figure as high as 3.67 million BTC. This discrepancy, which can be as large as 1 million BTC, arises from differing methodologies used by analytics firms to identify and label exchange wallets. Consequently, drawing firm conclusions about overall market liquidity based on any single provider’s total should be approached with caution.

    Historical Context and Volatility

    Historically, exchange balances have shown fluctuations. Between May and September 2026, exchange holdings increased by approximately 45,000 BTC, with a notable surge of around 28,000 BTC in August 2026. More recently, in late September 2026, exchange holdings were reported at 3,668,100 BTC, following a period where 33,839 BTC left exchanges in the week prior. In early October 2026, Santiment recorded a significant one-day outflow of 24,073 BTC, the largest in seven months, further illustrating the volatility in these balances.

    Ambiguous Signals for Liquidity

    The current situation highlights the inherent ambiguity in on-chain data when it comes to assessing market sentiment and liquidity. While coins on exchanges are generally considered more readily available for sale than those in private wallets, the recent inflow does not provide a clear signal of impending selling pressure or a change in market direction. The conflicting data points—a short-term inflow against a longer-term outflow, coupled with significant discrepancies in total holdings—make definitive interpretations difficult.

    Experts note that exchange balances are closely watched as they can indicate available liquidity. However, the wide range of estimates for these balances means that any conclusions drawn from them should be considered tentative. A more robust understanding of market liquidity would require consistent trends observed across multiple data sources over extended periods, rather than short-term movements that can be influenced by various tactical decisions by participants. Until such clarity emerges, the recent Bitcoin inflow onto exchanges remains an ambiguous signal.