XRP Faces Persistent Selling Pressure, Key Support Levels Tested
XRP continues to struggle against both the U.S. dollar and Bitcoin, trading within a persistent bearish pattern. While buyers have managed to defend crucial support zones in recent weeks, the overall trend has yet to signal a definitive reversal, with the token remaining below key moving averages and a descending trendline resistance.
XRP/USD Dynamics
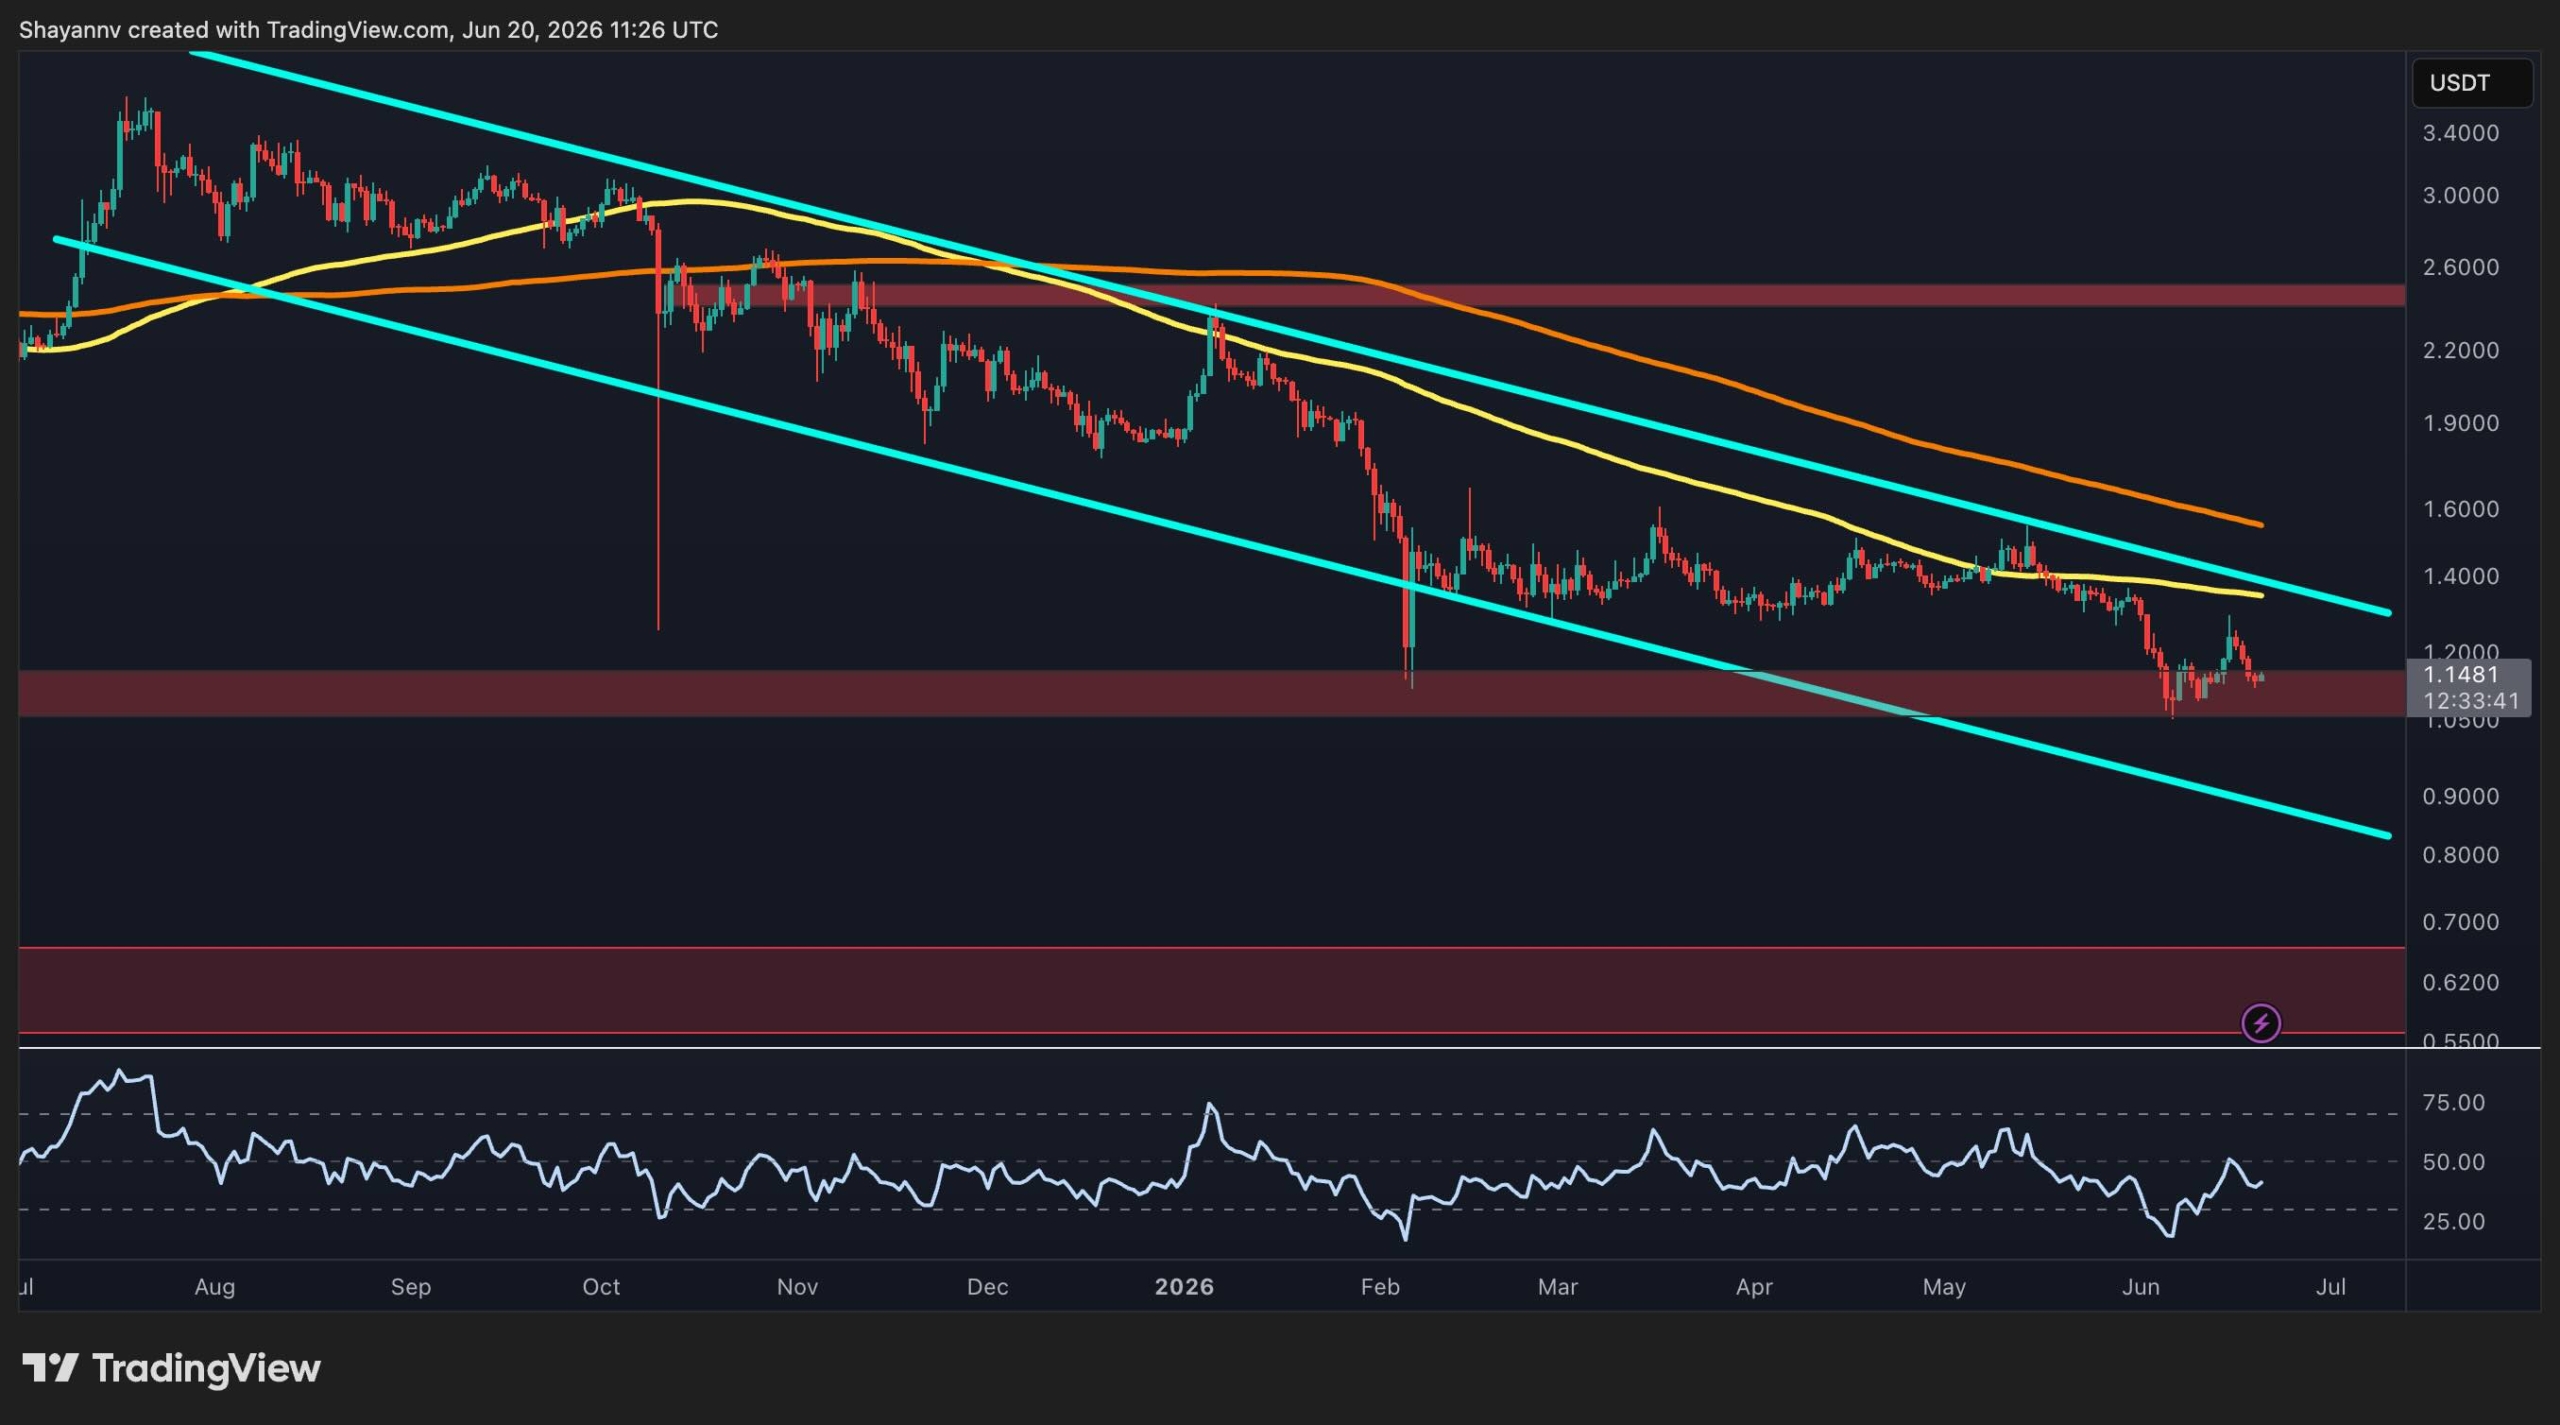
On the USDT pair, XRP is confined within a large descending channel that has dictated price action since the latter half of 2025. A recent downturn saw the asset retreat to a critical support zone near $1.1, where buying interest has once again emerged to stave off a steeper decline. This area has served as a significant demand region throughout the current correction and remains the most vital support level on the chart. A decisive breach of this zone could pave the way for a move towards the next major downside target around the $0.60 region, which represents the next discernible demand area on higher timeframes.
On the upside, XRP faces multiple resistance layers. The upper boundary of the descending channel currently aligns with the 100-day moving average, situated around $1.35. Higher still, the 200-day moving average sits at approximately $1.75. Beyond these technical indicators, the significant supply zone at $2.5 remains the pivotal level that buyers must reclaim to shift the long-term structure in their favor.
Meanwhile, overall momentum remains subdued. Although the Relative Strength Index (RSI) has stabilized above oversold territory, it has yet to exhibit the bullish divergence or strength typically associated with a sustainable trend reversal. As long as XRP remains below the descending channel resistance and major moving averages, the broader market structure will continue to favor sellers, despite recent stabilization.
XRP/BTC Performance
The BTC pair presents a similarly cautious outlook, underscoring XRP’s ongoing relative weakness against Bitcoin. Following an extended decline within a descending channel, XRP/BTC has recently entered a consolidation phase above a key support area around 1,720 SATs. This level has been tested multiple times since May and continues to attract demand, forming the base of the current trading range.
However, despite holding support, buyers have repeatedly failed to achieve a sustained breakout above the nearby resistance zone around 1,850 SATs. This area coincides with the 100-day moving average and has acted as a ceiling throughout June. A loss of the 1,720 SATs support floor could expose the next major demand area significantly lower, around 1,500 SATs. Conversely, a successful breakout above the 1,850 SATs level could open the possibility of a move towards the next resistance region near 2,000 SATs, where further supply is expected to emerge.
Ultimately, the BTC pair suggests that XRP has yet to establish meaningful relative strength, reinforcing the cautious sentiment observed on the USDT chart. Until buyers reclaim nearby resistance levels and break the broader descending structure, rallies are likely to be interpreted as corrective moves rather than the commencement of a new bullish trend.
Leave a Reply