XRP Faces Persistent Selling Pressure, Testing Key Support Levels
XRP continues to experience sustained selling pressure, with the broader market trend firmly favoring sellers. Analysis of the USDT chart indicates the cryptocurrency is on the verge of breaching a significant support area following another downward movement. Concurrently, the XRP/BTC pair has retreated towards a critical floor, underscoring the token’s ongoing weakness relative to Bitcoin.
XRP/USDT Analysis
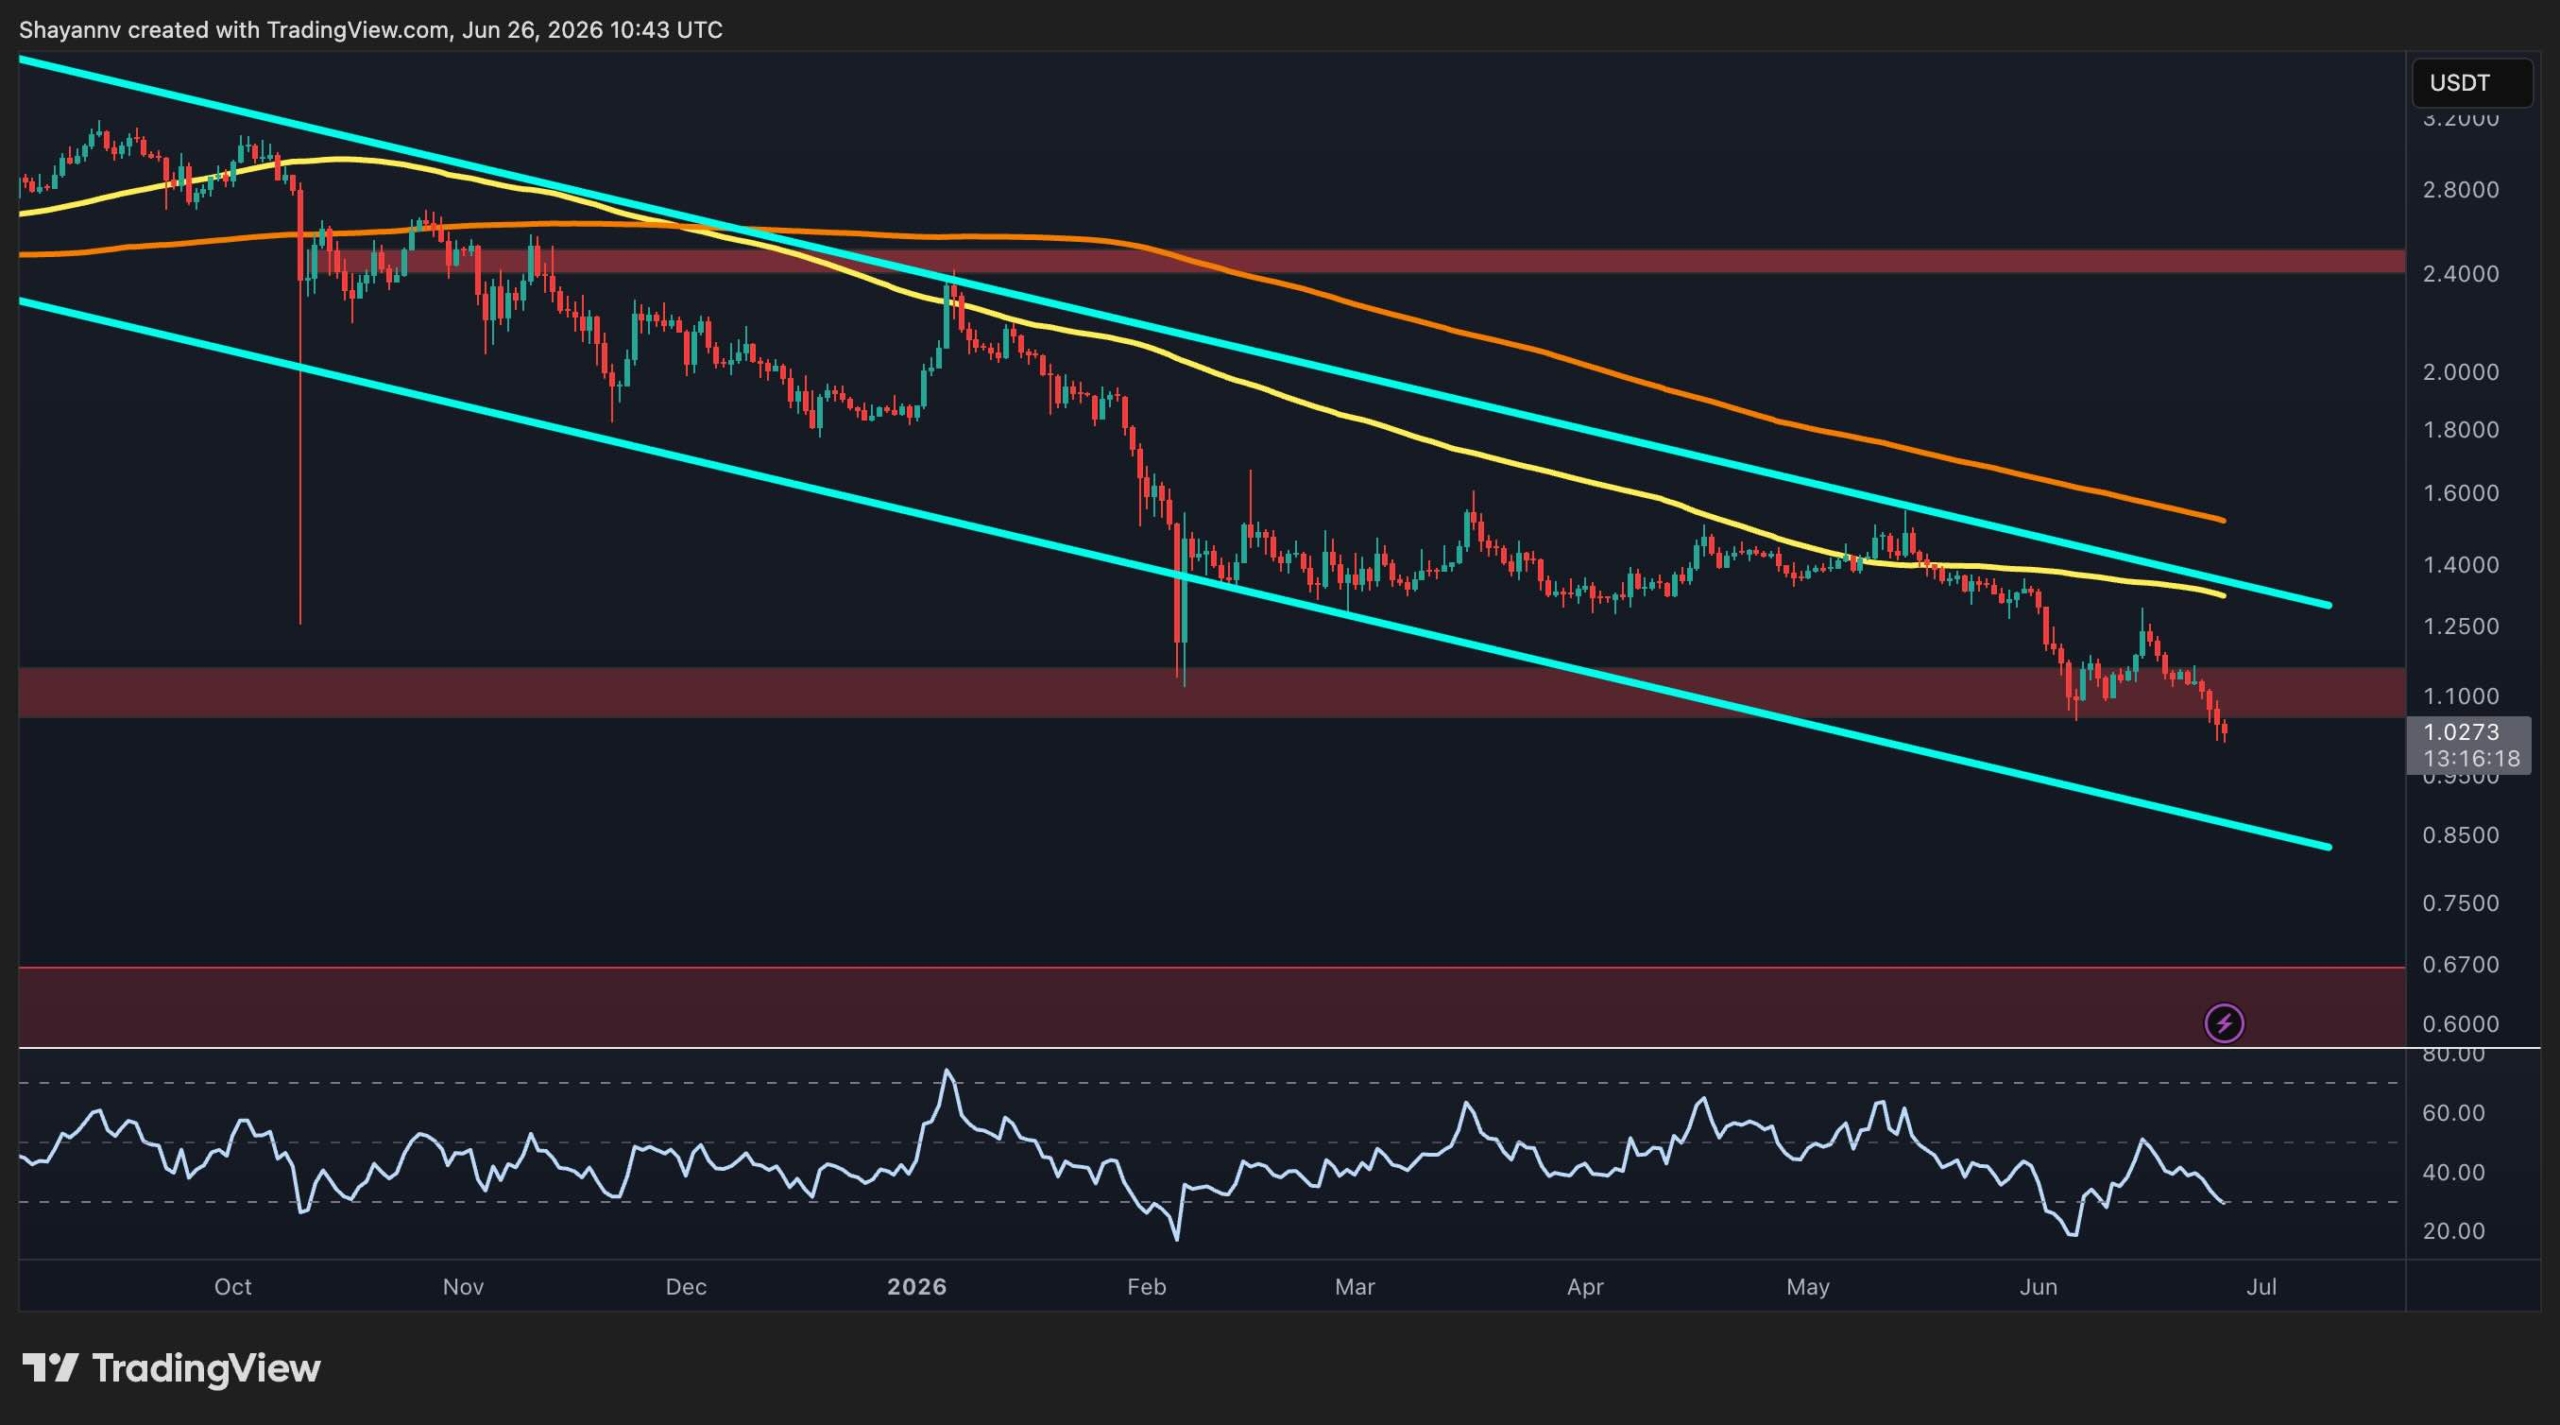
Against the USDT pair, XRP has extended its long-term downtrend, adhering to a descending channel that has capped price action for several months. The asset is currently trading around $1.04, having narrowly avoided a break below the crucial $1.10 support zone, which has now transitioned into immediate resistance.
XRP remains positioned below both its 100-day and 200-day moving averages, with the 100-day average situated near $1.25 and the 200-day average around $1.5. Both averages are exhibiting a downward slope, reinforcing the prevailing bearish market structure. The upper boundary of the descending channel is converging with these moving averages, forming a robust resistance cluster that buyers would need to overcome for any significant trend reversal to be considered.
On the downside, the current support zone around $1.00 is under intense scrutiny. A confirmed breach below this level could open the path to the next major demand region, located approximately at $0.60. Momentum indicators also show continued deterioration, with the Relative Strength Index (RSI) trending towards oversold territory, suggesting that bearish pressure remains dominant, although short-term relief bounces cannot be entirely discounted.
As long as XRP remains below the descending channel resistance and the key moving averages, the broader market structure will continue to favor sellers, irrespective of any recent stabilization.
XRP/BTC Analysis
Against Bitcoin, XRP is also trading within a clearly defined descending channel, reflecting persistent relative weakness over the past several months. The pair is currently trading around 1,720 satoshis, resting directly on a horizontal support level that has historically attracted buyers since May.
However, the broader technical outlook remains bearish. The price is trading below both the 100-day and 200-day moving averages, which are positioned around 1,850 satoshis and 2,000 satoshis, respectively, with both averages continuing their downward trajectory. Consequently, any recovery attempt is likely to encounter substantial resistance in the 1,850 to 2,000 satoshi range, followed by the upper boundary of the descending channel.
Should the current support at approximately 1,700 satoshis fail to hold, sellers could target the lower boundary of the channel, near the 1,500 satoshi area. Conversely, defending this level might facilitate another short-term rebound towards the channel resistance. Nevertheless, the overall structure would remain bearish unless XRP manages to reclaim the major moving averages and establish higher highs.
Leave a Reply