XRP Faces Intense Selling Pressure Amidst Broader Crypto Downturn
XRP is currently experiencing significant selling pressure, a trend that mirrors the broader cryptocurrency market. Both its trading pairs against Tether (USDT) and Bitcoin (BTC) are entrenched in clear downtrend structures. While the dollar-denominated pair is testing a critical demand zone, the BTC pair is hovering just above a key support level, placing the market at a pivotal juncture.
XRP/USD Analysis
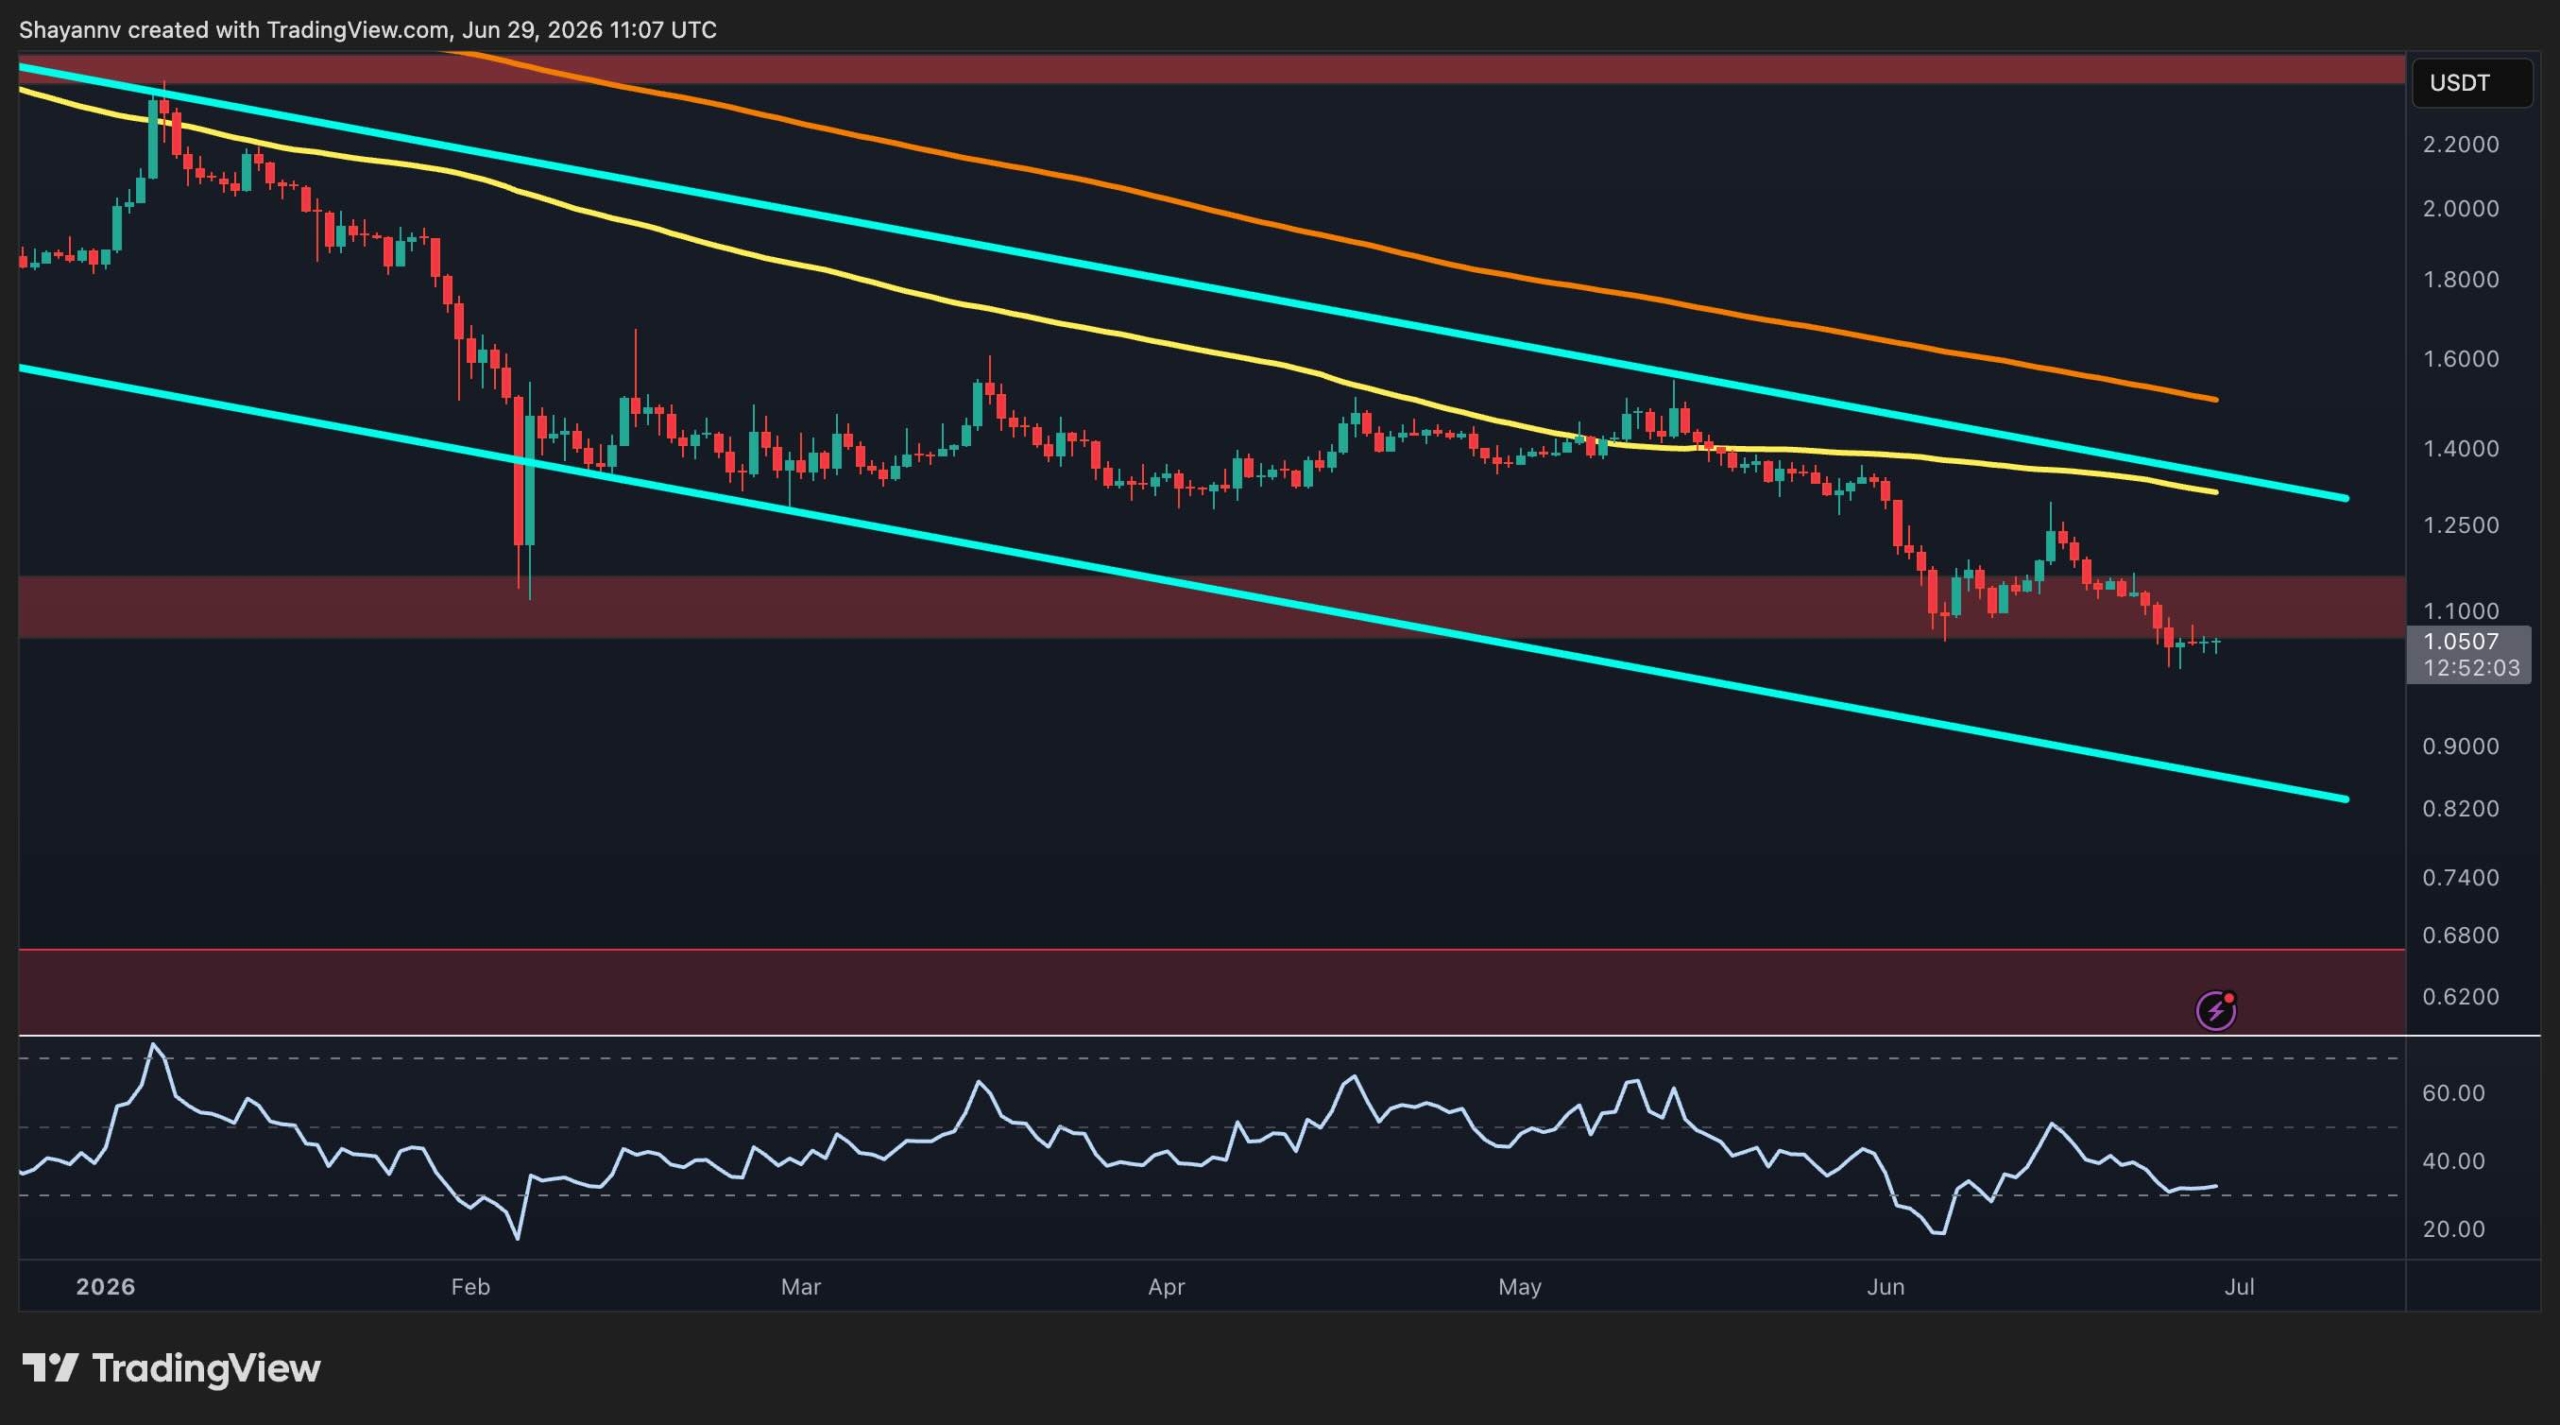
On the daily chart, XRP continues to exhibit its established bearish structure, remaining confined within a long-term descending channel. The digital asset is presently trading around the $1.05 mark, having failed to establish higher lows in recent weeks, a clear indication of sustained seller dominance on higher timeframes.
The most significant support for XRP/USD is now situated between $1.00 and $1.10, an area where the price is attempting to find stability. This zone has historically attracted buying interest and could potentially trigger a relief bounce if buyers successfully defend it. However, the overarching trend remains bearish, with XRP trading below both its 100-day and 200-day moving averages. These averages are both sloping downwards, serving as dynamic resistance levels.
Any attempt at a recovery is likely to encounter its initial hurdle around the 100-day moving average, which is positioned near the $1.30 level and aligns with the upper boundary of the descending channel. A decisive break above both this channel resistance and the moving average would be necessary to signal a meaningful shift in the market’s structure.
Conversely, a failure to hold the current support area could expose XRP to the lower boundary of the descending channel, located near the $0.80 region. This makes the current support zone particularly crucial for the medium-term outlook.
XRP/BTC Analysis
Against Bitcoin, XRP continues to underperform, with the XRP/BTC pair firmly entrenched within its own descending channel. The pair is currently trading at approximately 1,750 satoshis, sitting directly above a horizontal support level that has repeatedly halted deeper declines since May.
Despite this support holding on multiple occasions, none of the subsequent rebounds have resulted in a clear bullish breakout, underscoring persistent selling pressure and a lack of sustained upward momentum. Repeated rejections near the 100-day moving average further reinforce the bearish structure.
On the upside, the first major horizontal resistance is observed around 1,850 satoshis, which converges with the declining 100-day moving average. Above this, stronger resistance emerges near 2,000 satoshis, followed by the descending 200-day moving average and the upper channel resistance. As long as XRP remains below these resistance clusters, the trend against Bitcoin suggests continued relative weakness.
On the downside, a confirmed breakdown below the 1,700 satoshis support region would likely invalidate the current consolidation pattern and pave the way for another downward leg towards the psychological support level around 1,500 satoshis, and potentially lower. This positions XRP at a critical decision point on both its USDT and BTC charts, as buyers and sellers vie for dominance over the prevailing trend.
Leave a Reply