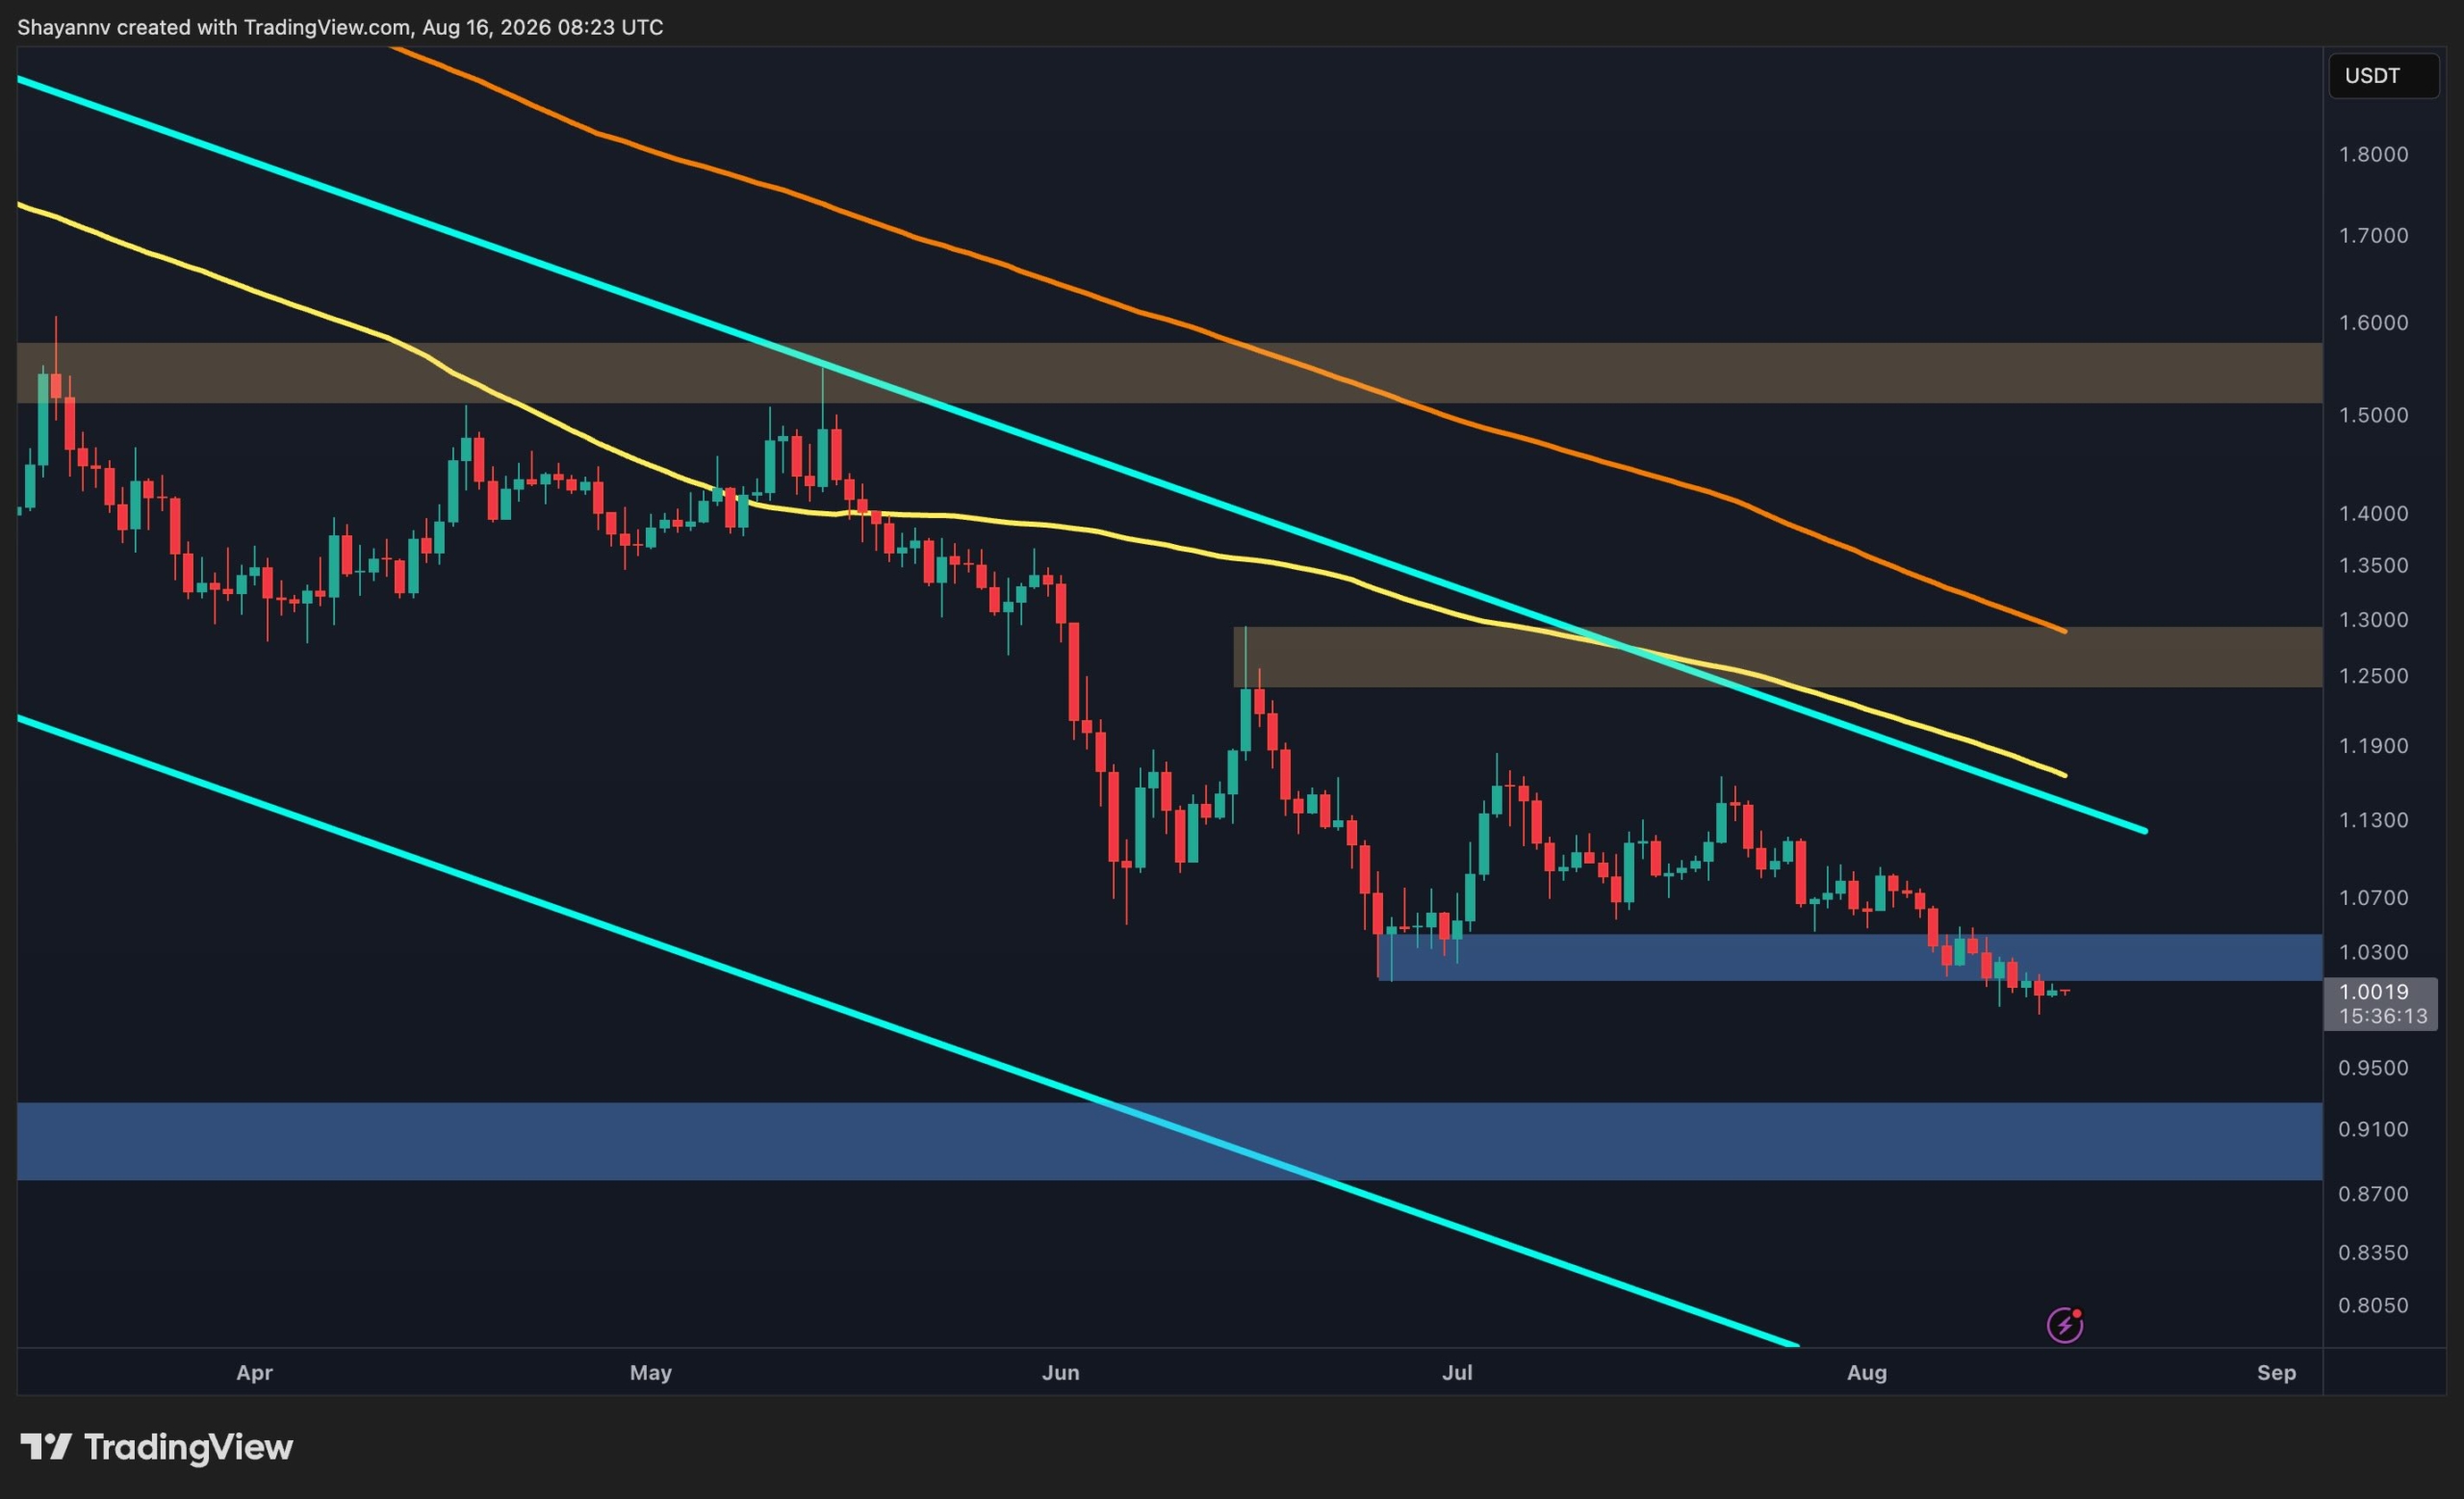
XRP is currently trading near the $1.00 level, with prevailing technical indicators suggesting a bearish outlook. The asset is experiencing pressure, and a potential additional weakness is possible if key support levels are breached, according to market analysis.
Bearish Structure and Momentum Observations
The broader market structure appears to favor bears, with XRP trading below major moving averages on the daily timeframe. On the 4-hour chart, XRP has been forming lower highs beneath a descending trendline, reinforcing the bearish trend. This technical setup indicates that the market has lost momentum following previous declines, and a sustained recovery has yet to develop.
Key Technical Levels: Resistance and Support
Immediate resistance is identified in the $1.02-$1.04 area. XRP has recently moved below the $1.02-$1.03 support area on the 4-hour chart, suggesting that this former support may now act as resistance. The descending trendline overhead further reinforces the bearish structure.
Immediate support is observed around the $1.00 level. However, if this level fails decisively, the next major downside reference is the demand zone between $0.91 and $0.97. This region represents the next significant support visible on the daily chart and could become relevant if the current consolidation resolves to the downside. A sustained move below the $1.00 area could expose this demand zone.
Consolidation and Potential Scenarios
The current consolidation just below $1.00 suggests that sellers have not completely lost control, although momentum is becoming compressed. The 4-hour chart presents a more immediate bearish picture, with recent rebound attempts repeatedly failing to produce a meaningful structural move. The lack of a strong bullish reversal suggests that the market may still be in a corrective phase.
For the bearish setup to weaken, a sustained recovery above the $1.02-$1.04 resistance zone and a break above the descending trendline would be necessary to materially improve the daily structure. A stronger recovery above the $1.06-$1.08 area would provide a more convincing signal that the current downtrend is losing momentum. Until such a break occurs, the path of least resistance appears tilted to the downside, with the potential for another test of lower support levels remaining a possibility.
Why This Matters
The current market analysis indicates that XRP is trading below major moving averages and within a descending structure, suggesting a bearish trend. The uncertainty remains regarding whether XRP can defend the $1.00 level.
Broader Context
This market analysis is presented in the context of discussions surrounding XRP’s price movements. The post Ripple Price Prediction: Can XRP Defend $1 or Will $0.90 Come Into Play Next? appeared first on CryptoPotato.
Leave a Reply