XRP Faces Critical Resistance After Sharp Recovery
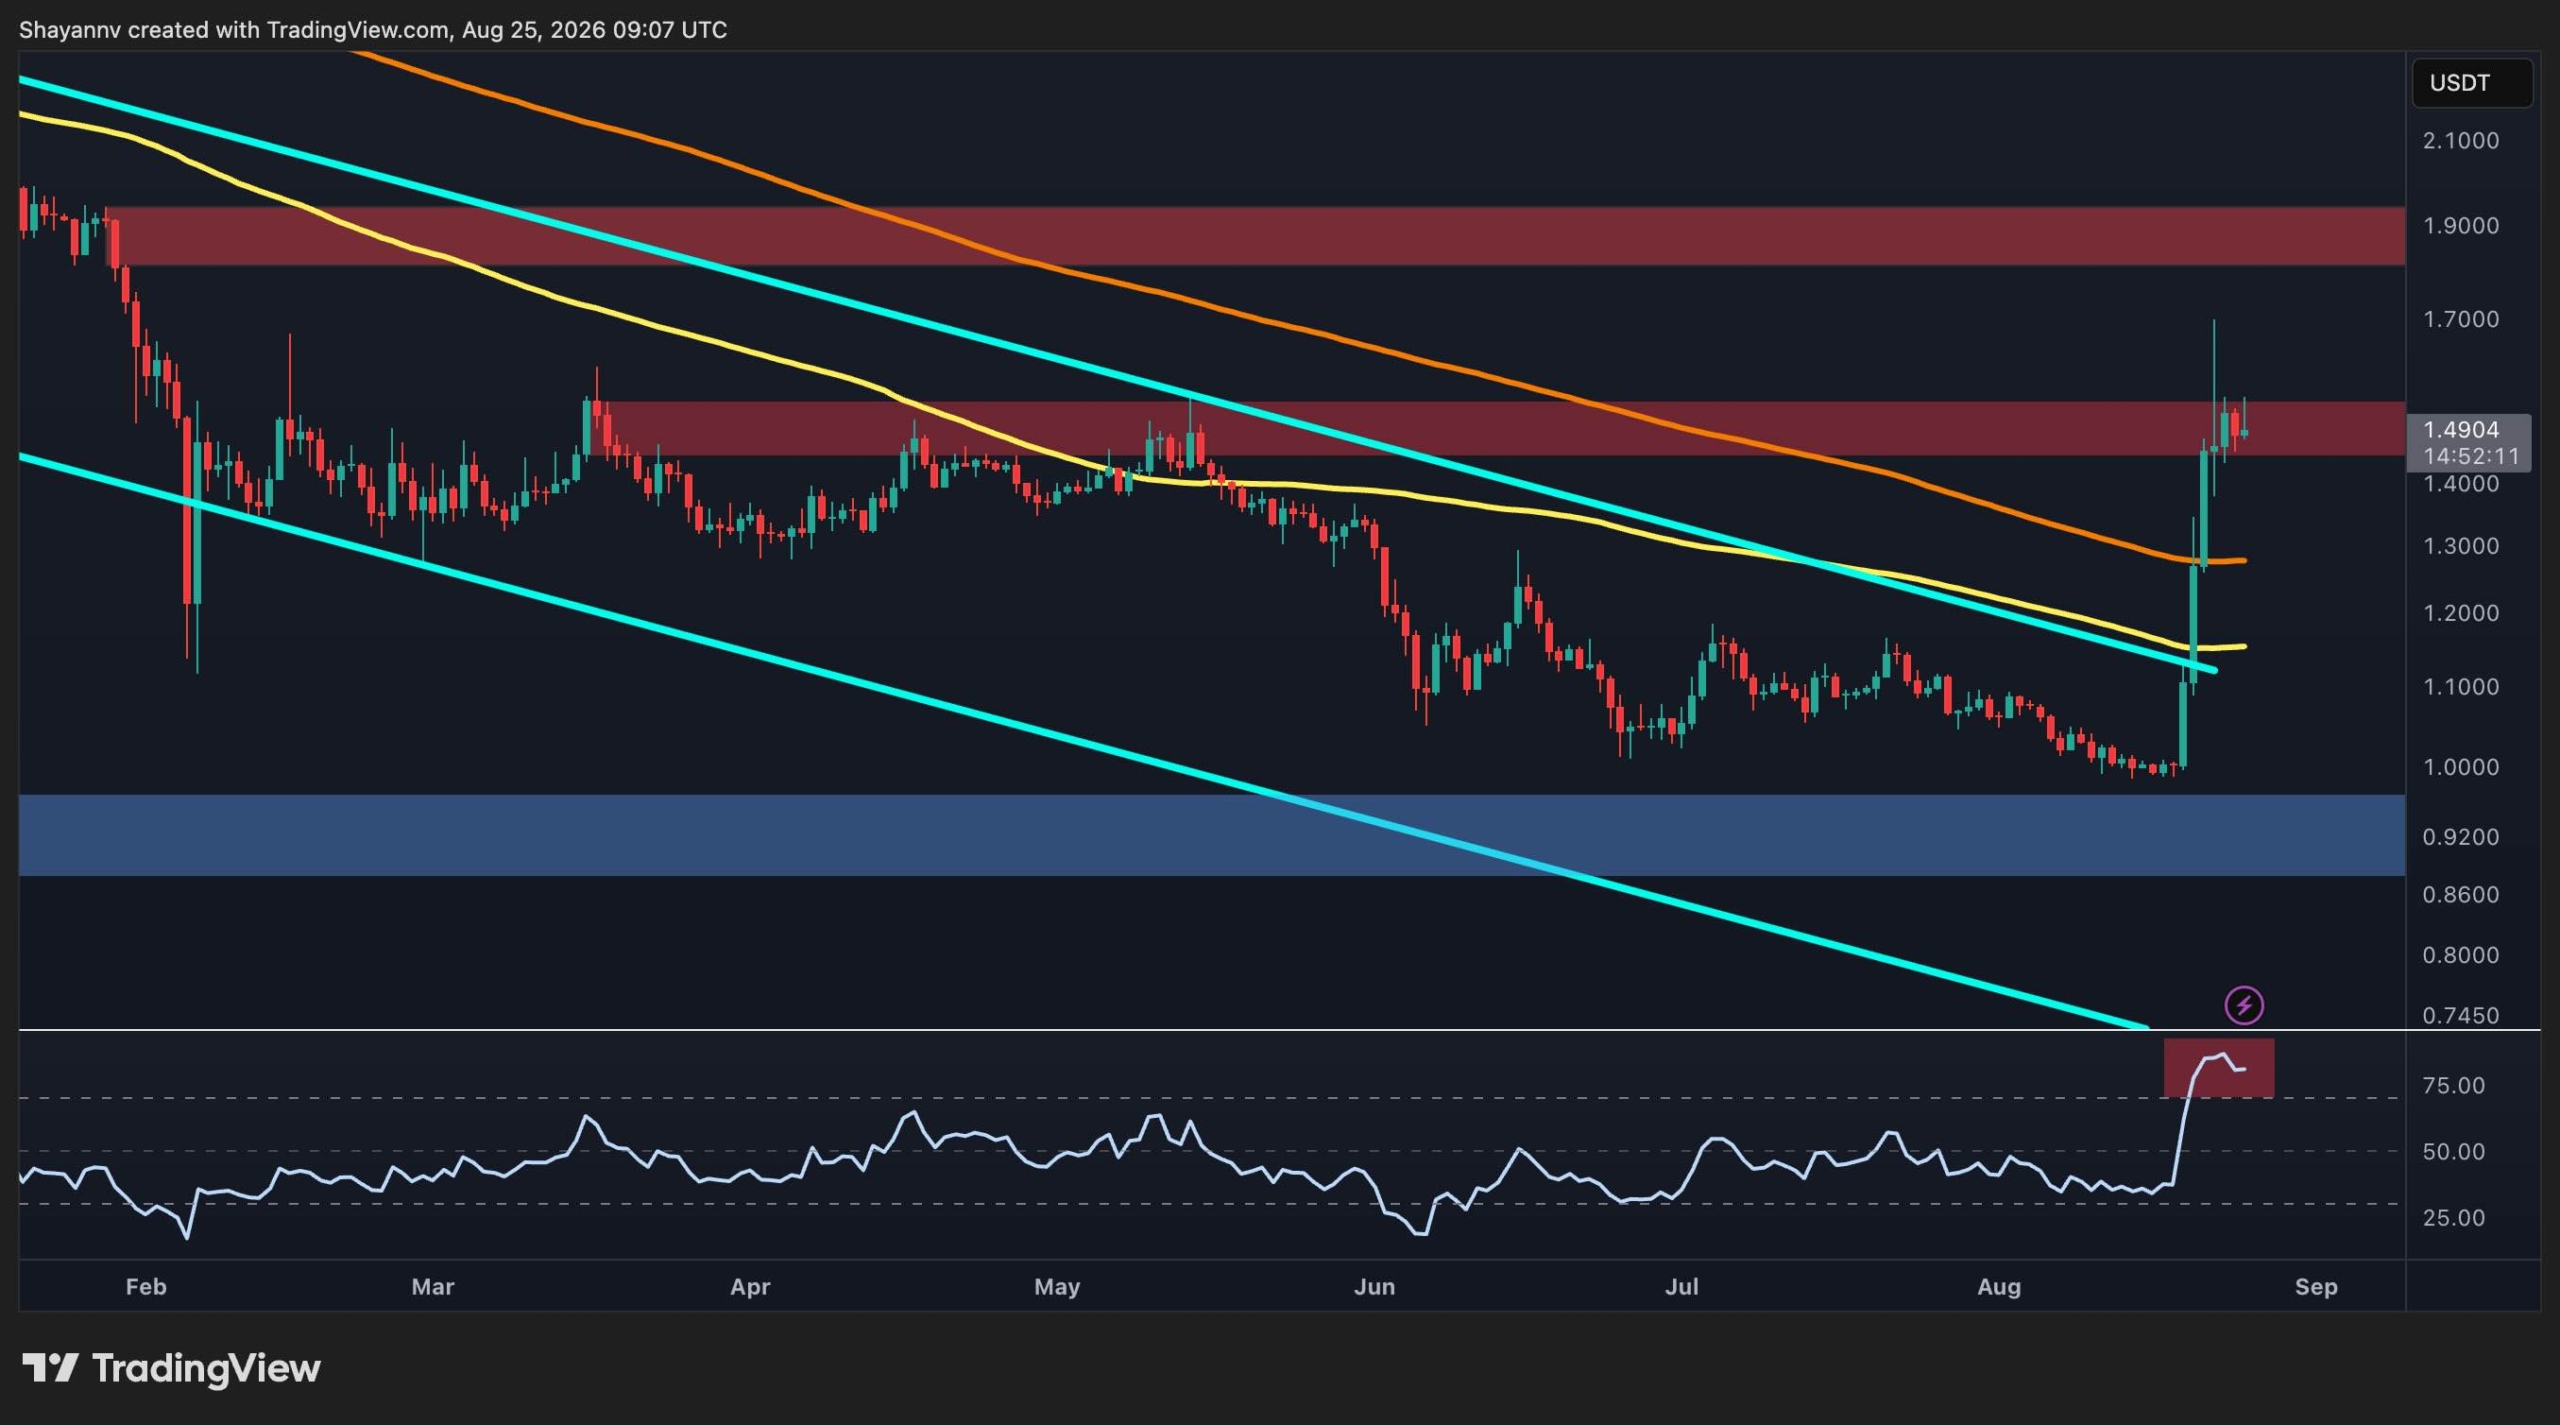
XRP has experienced a significant rebound, climbing back from the $1.00 mark and successfully breaking through long-standing descending trendlines on both USD and BTC charts. However, the cryptocurrency’s recent rally has now encountered major resistance levels, placing current price action at a crucial juncture for determining its next directional move.
The digital asset found support around the $1.00 level before breaching its broader descending channel. Subsequently, XRP has re-established its position above both the 100-day and 200-day moving averages, which were previously situated around $1.2 and $1.3, respectively. The move beyond $1.3 has effectively transformed these former resistance points into immediate support zones.
Currently, XRP is testing the critical $1.50 resistance area, where price consolidation has begun. A decisive daily close above $1.50 could pave the way for a potential advance towards the $1.80-$1.90 range. Conversely, a rejection at this level, followed by a descent below $1.30, would undermine the recent breakout structure and increase the likelihood of a more substantial correction, potentially pushing prices back towards the $1.00 area.
The Relative Strength Index (RSI) has surged past the 70 mark, remaining in overbought territory. While this indicates strong upward momentum, it also suggests the possibility of a short-term cooldown, which could lead to a retest of the 200-day moving average.
XRP/BTC Pair Shows Mixed Signals
On the XRP/BTC daily chart, the price has attempted to break out of its descending channel after reaching a low near 1,500 satoshis. However, unlike its USDT counterpart, this breakout has so far been unsuccessful. The pair briefly traded above the channel’s upper boundary before experiencing a significant rejection wick, indicating persistent selling pressure around this resistance level.
XRP/BTC is now retracing towards the previously breached 200-day moving average, which is currently serving as a potential support level. The price action around this moving average will be a key determinant for the pair’s next move. If XRP/BTC can maintain its position above this average and solidify the former breakout area as support, another attempt at the 2,000 satoshis resistance zone may follow.
A successful breach above 2,000 satoshis would bolster the relative strength outlook for XRP against Bitcoin. Conversely, a decisive failure to hold the 200-day moving average would suggest that the recent breakout attempt was a false signal, potentially exposing the pair to further downward pressure. The RSI has also pulled back after a brief stint above 70, reflecting a loss of momentum following the failed breakout and hinting at potential consolidation or correction in the coming weeks.
Leave a Reply