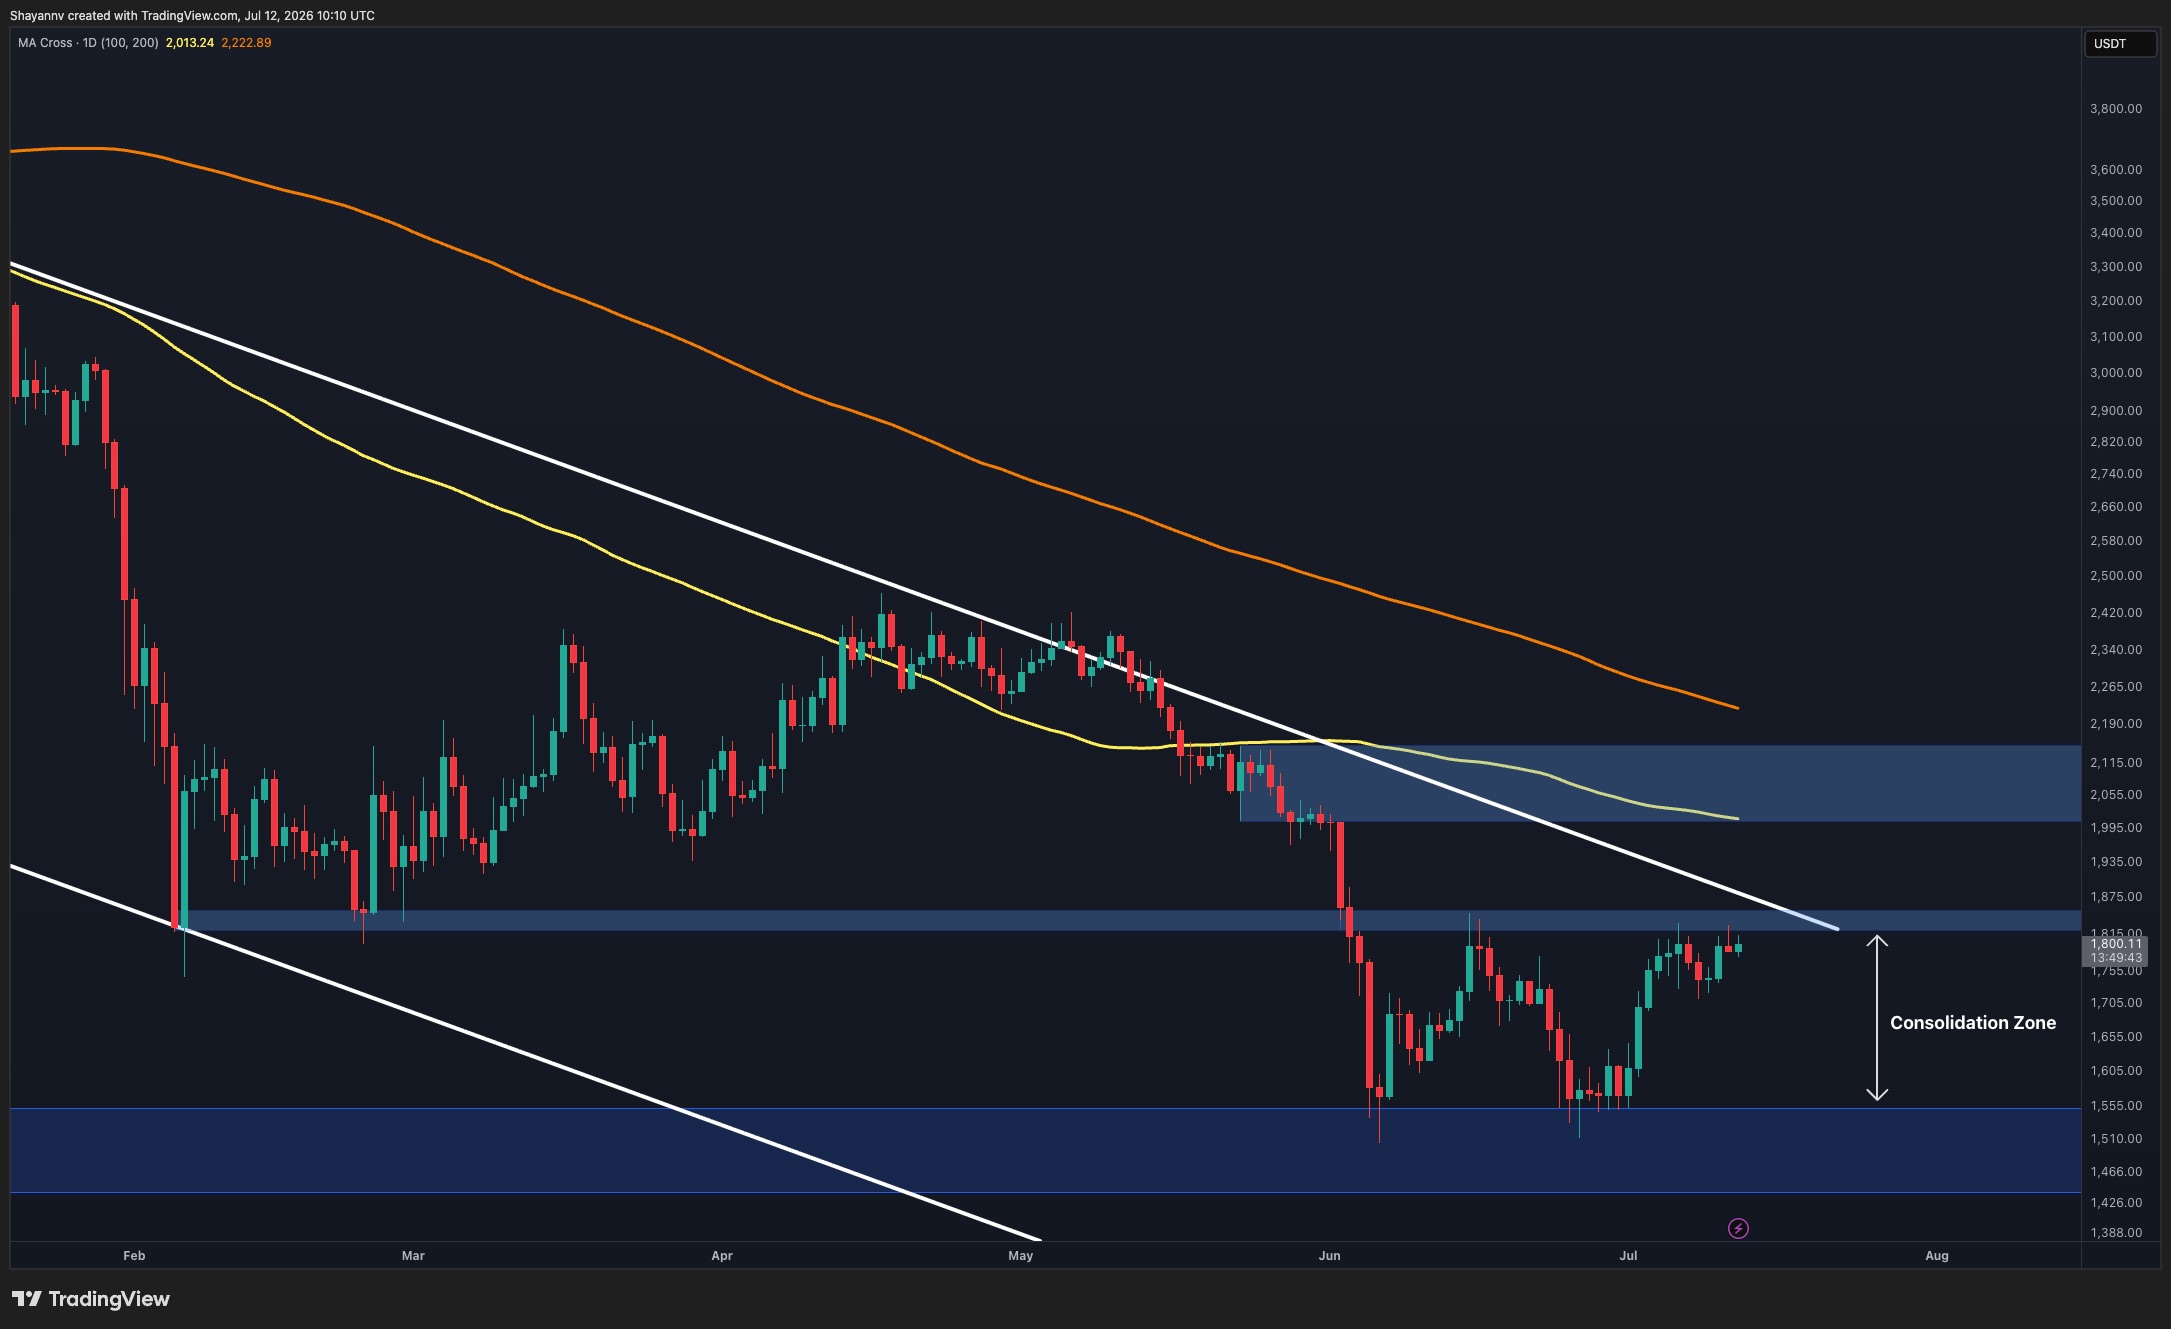
Ethereum is currently testing a critical technical resistance zone between $1.80K and $1.85K. This area is significant as it aligns with a descending trendline that has capped price action since May, and also represents a former horizontal support level that has now turned into resistance. The current price action is occurring below both the 100-day and 200-day moving averages, which are both trending downwards, indicating a broader bearish market structure.
The 4-hour chart, however, shows an ascending structure that has been developing since the late-June low. Within this structure, Ethereum has respected the rising channel boundaries, forming higher highs and higher lows, which suggests improving short-term momentum. Key demand zones around $1.62K-$1.64K and $1.72K-$1.74K have been reclaimed and established, respectively, providing support during recent pullbacks.
Despite this short-term constructive price action, the rally is now approaching the upper boundary of this ascending channel and the major resistance band around $1.80K-$1.85K. This confluence of factors creates a natural area where profit-taking and seller activity could emerge. As long as Ethereum remains below this descending trendline and the $1.80K-$1.85K resistance zone, the current upward movement can still be interpreted as a recovery rally within a larger downtrend.
Further complicating the outlook is the alignment of technical resistance with liquidity levels. A liquidation heatmap indicates a significant concentration of short-side liquidity situated above the current market price, particularly within the $1.95K-$2.1K region. This area also coincides with the 100-day moving average, which is positioned around $2K-$2.1K, and a broader supply area visible on higher timeframes. Conversely, substantial liquidity pools are noted below the market, around the $1.45K-$1.55K region, which aligns with a major daily demand zone.
The interplay between the liquidation map and the technical structure suggests that the market may first be drawn towards the overhead liquidity cluster in the $1.95K-$2.1K range. A move into this area would effectively sweep a large concentration of short liquidations while simultaneously testing a significant resistance zone.
The reaction at the $2K-$2.1K region is expected to be pivotal in determining the next major directional move for Ethereum. If buyers manage to break through and establish acceptance above this resistance area, the recovery could potentially evolve into a broader bullish trend reversal. However, if this liquidity sweep is followed by strong selling pressure and rejection from resistance, Ethereum could enter another notable decline. In such a scenario, the price might target the large liquidity pools resting beneath the market around the $1.45K-$1.55K support zone.
Ultimately, the path forward for Ethereum remains uncertain. While short-term momentum has shown improvement, the asset is still contending with significant long-term resistance and the potential for liquidity-driven price discovery. A decisive move above the $1.80K-$1.85K zone would shift focus toward the $2K-$2.1K resistance, but rejection could signal a continuation of the broader downtrend.
Why This Matters
The current situation presents an uncertain outlook for Ethereum. Whether a larger trend reversal is underway or another corrective leg lower remains ahead, with the market’s next major directional move likely to be determined by the reaction at the $2K-$2.1K region.
Broader Context
Ethereum has continued its recovery from the June lows and is now approaching a major technical inflection point. The asset is testing a key resistance region around $1.80K-$1.85K, which coincides with a descending trendline and previous horizontal support turned resistance. The outcome of this test remains uncertain.
Leave a Reply