XRP Faces Persistent Selling Pressure, With Bitcoin Pair Showing Significant Weakness
XRP is currently under pressure across both its USDT and BTC trading pairs, with the broader market structure continuing to favor sellers. While the token has managed to find some stability above immediate support on its dollar chart, its Bitcoin counterpart is consistently printing lower highs and lower lows, underscoring its ongoing relative weakness.
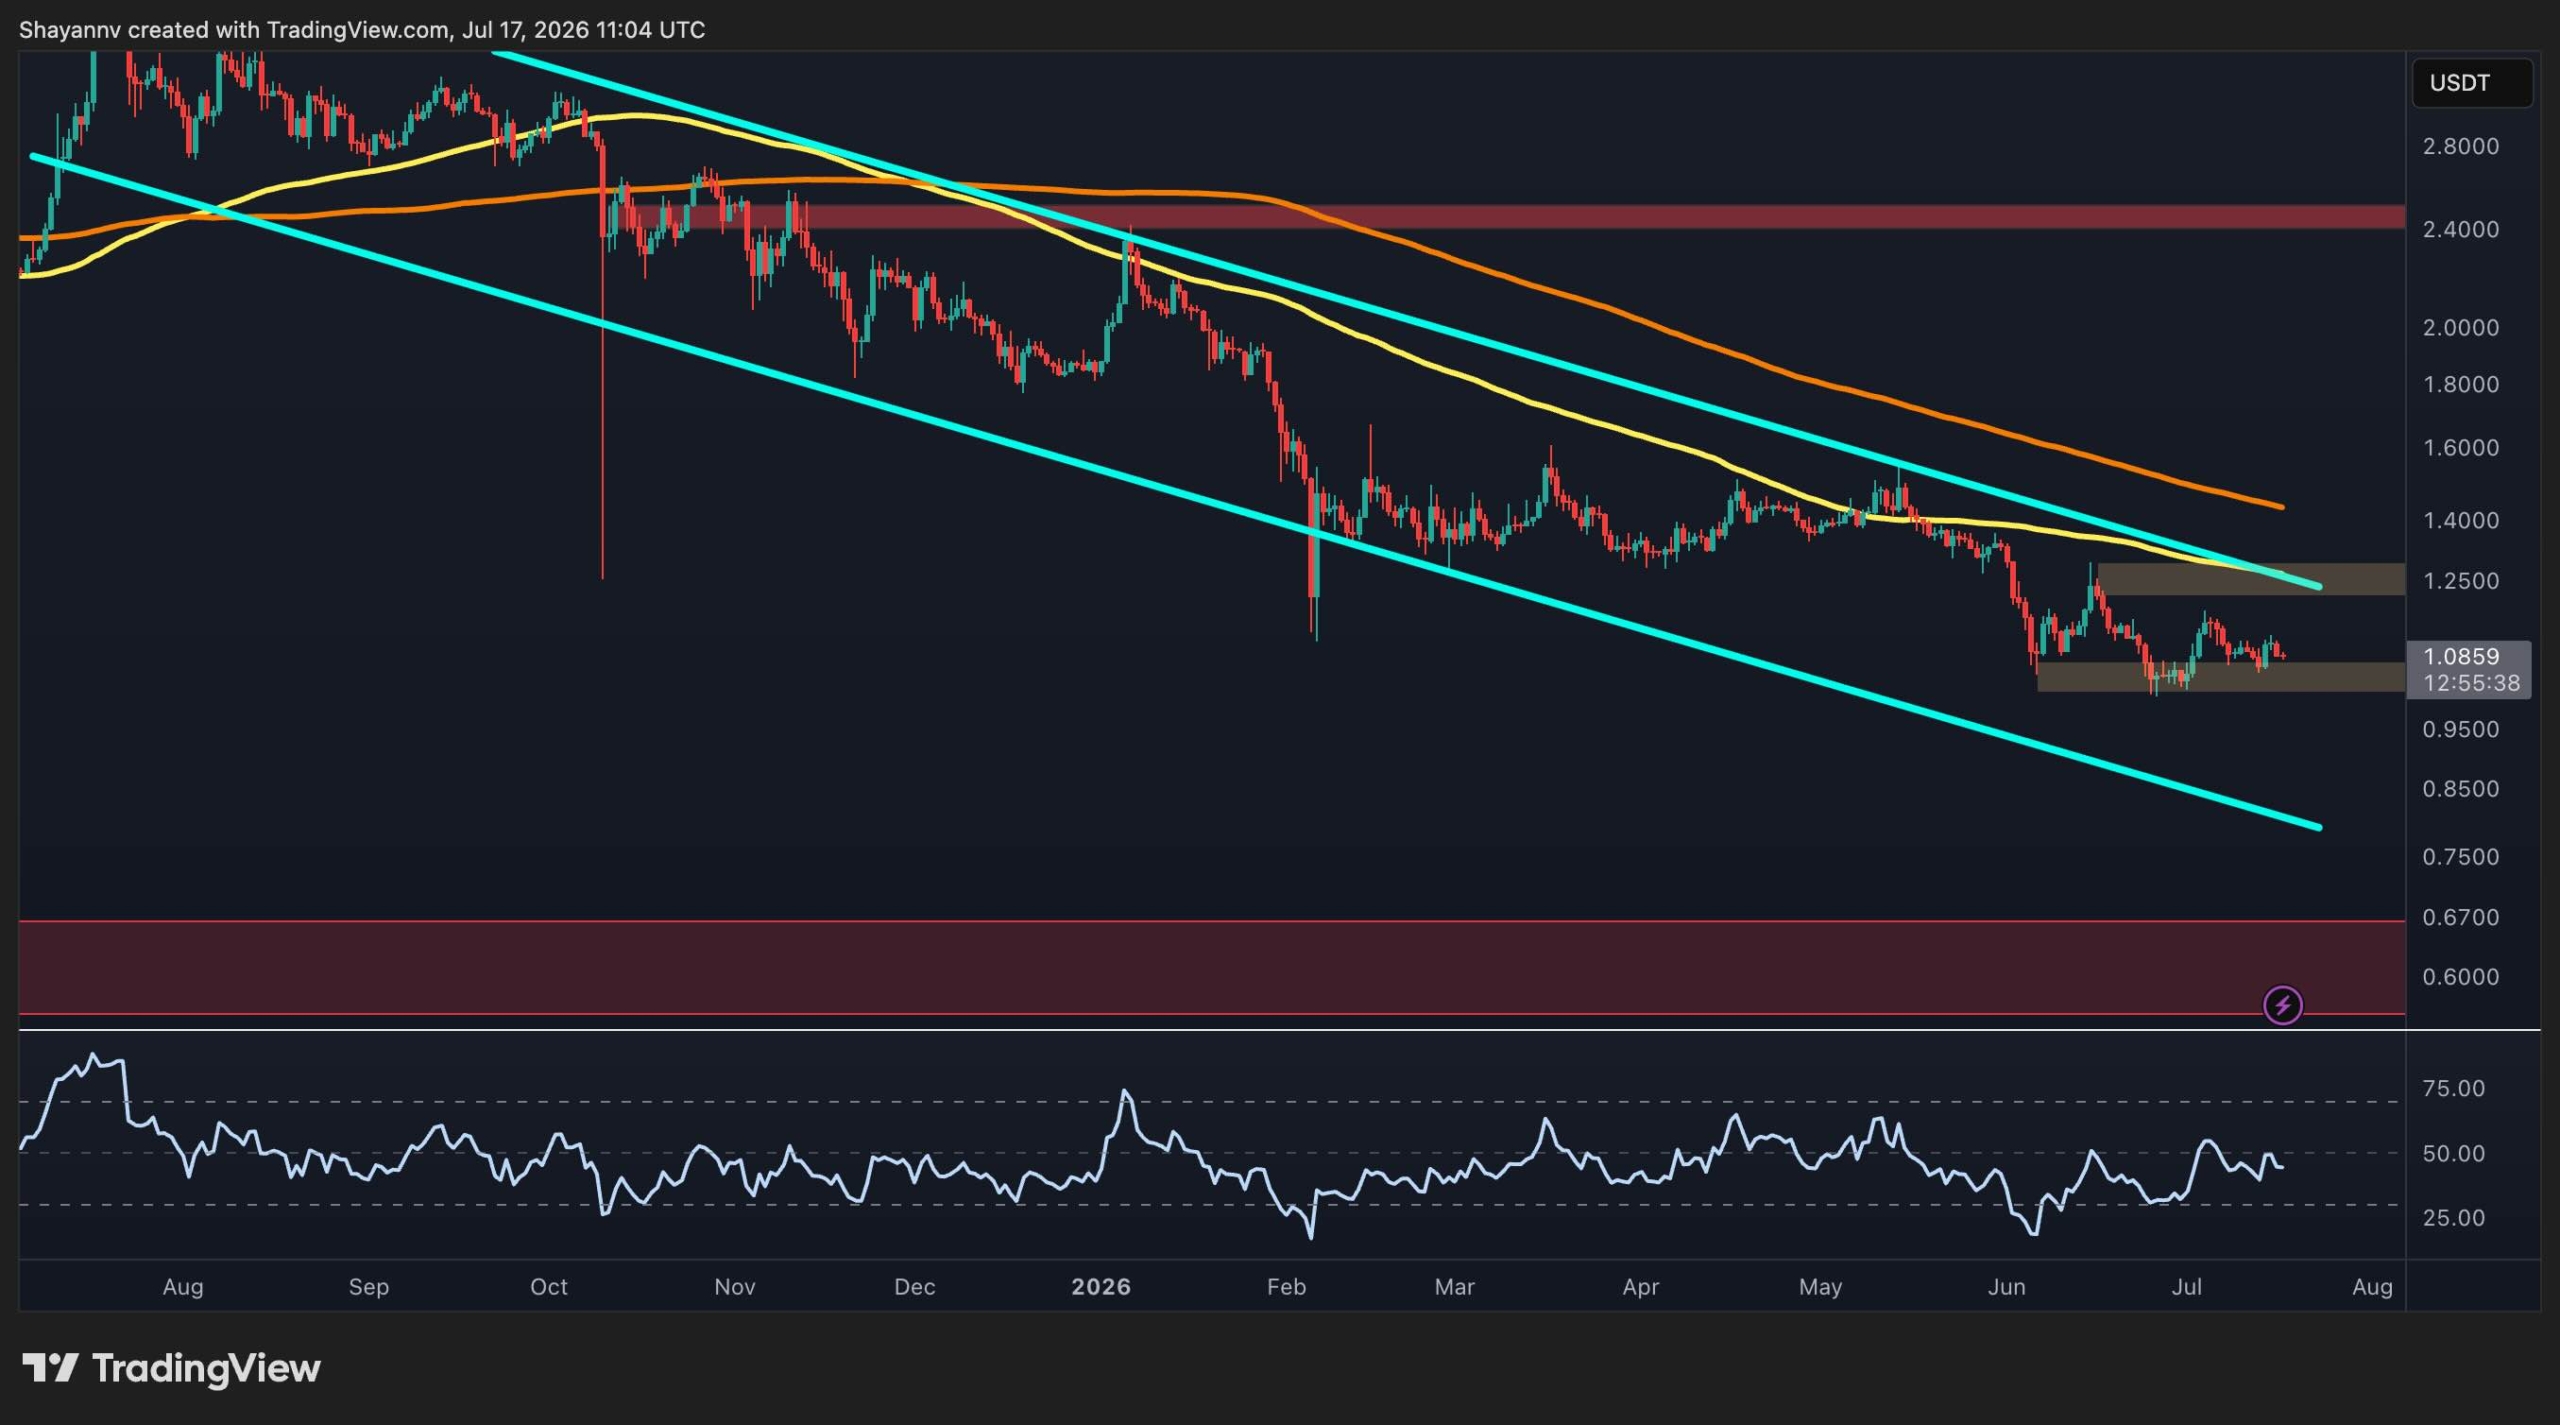
On the daily chart, XRP is trading around $1.08 following an extended decline within a clearly defined descending channel. Although the asset has recently moved sideways rather than continuing its downward trajectory, the overall trend remains bearish. XRP is trading below both its 100-day and 200-day moving averages, both of which are also sloping downwards, reinforcing the prevailing negative momentum.
Since a significant breakdown in June, XRP has established a consolidation range between the $1 support zone and the $1.25 resistance area. Buyers have repeatedly defended the lower boundary, but every attempt at recovery has been rejected before reclaiming the declining 100-day moving average or breaking above the channel’s upper boundary. This indicates that bullish momentum remains constrained.
A breakout above the $1.25 resistance would be the first indication that buyers are regaining control and could open the path towards the descending channel’s upper boundary, which represents the next major hurdle. Until then, the broader structure continues to suggest further downside, with a loss of the $1 support potentially leading to significantly lower demand zones.
The Relative Strength Index (RSI) is hovering near the neutral 50 level, reflecting a current balance between buyers and sellers after weeks of intense selling pressure. However, without a decisive bullish breakout, the indicator does not yet signal a meaningful shift in the trend.
XRP/BTC Pair Shows Deeper Weakness
The XRP/BTC daily chart presents an even more concerning picture. The pair has been confined within a long-term descending channel for nearly a year, consistently trading below both the 100-day and 200-day moving averages, highlighting sustained underperformance against Bitcoin.
Following several unsuccessful recovery attempts in May and June, XRP/BTC has now fallen below the crucial horizontal support level of approximately 1,720 satoshis. This level had previously attracted buyers multiple times over recent months, but each rebound has resulted in another lower high, signaling that selling pressure continues to dominate.
On the upside, the next significant resistance is located around the 1,850 satoshis region, where previous support has now transitioned into resistance. A move above this area would improve the short-term outlook, but the descending channel and the 200-day moving average, currently near 2,000 satoshis, remain the primary obstacles to a broader trend reversal.
Meanwhile, the RSI remains below the midpoint, suggesting that momentum still favors sellers. Unless XRP/BTC can reclaim key resistance levels and break its long-standing bearish structure, the pair appears vulnerable to another test of the channel’s lower boundary, which is now situated around 1,500 satoshis.
Leave a Reply