Author: Admin_Up

  • ‏ریپل ۸٪ افت کرد، اما نهنگ‌ها ۷۱ میلیون توکن خریدند.

    ‏ریپل ۸٪ افت کرد، اما نهنگ‌ها ۷۱ میلیون توکن خریدند.

    ‏داده‌های درون‌زنجیره‌ای نشان می‌دهد که نهنگ‌های XRP طی هفته گذشته به یک خرید گسترده ۷۱ میلیون کوینی دست زده‌اند، حتی با وجود کاهش قیمت این دارایی.

    نهنگ‌های XRP اخیراً دارایی‌های خود را افزایش داده‌اند

    در یک پست جدید در X، تحلیلگر علی مارتینز در مورد آخرین روند عرضه در اختیار نهنگ‌ها در شبکه XRP صحبت کرده است. منظور از “نهنگ‌ها” نهادهایی هستند که مقدار قابل توجهی از این دارایی را در موجودی کیف پول خود نگهداری می‌کنند. این سرمایه‌گذاران به دلیل دارایی‌های بزرگ خود می‌توانند تا حدی در بازار نفوذ داشته باشند، بنابراین رفتار آن‌ها اغلب ارزش پیگیری دارد. اقدامات انجام شده توسط نهنگ‌ها ممکن است همیشه مستقیماً بر دارایی تأثیر نگذارد، اما همچنان می‌تواند در مورد احساسات موجود در میان آن‌ها روشنگر باشد. راه‌های زیادی برای ردیابی رفتار نهنگ‌ها وجود دارد که یکی از این راه‌ها از طریق دارایی‌های آن‌ها است. در زیر نموداری که توسط مارتینز به اشتراک گذاشته شده است، روند عرضه دارندگان بزرگ XRP نشان داده شده است. همانطور که در نمودار قابل مشاهده است، نهنگ‌های XRP اخیراً دارایی‌های خود را گسترش داده‌اند. به طور خاص، این سرمایه‌گذاران عظیم‌الجثه طی هفته گذشته بیش از ۷۱ میلیون توکن از این ارز دیجیتال (به ارزش حدود ۹۷.۸ میلیون دلار در حال حاضر) به عرضه خود اضافه کرده‌اند. این هجوم انباشت از سوی نهنگ‌ها به طور جالبی در حالی رخ داده است که قیمت این دارایی در همین بازه زمانی بیش از ۸٪ کاهش یافته است. با توجه به این زمان‌بندی، این احتمال وجود دارد که سرمایه‌گذاران بزرگ، این کاهش قیمت را به عنوان فرصتی سودآور برای خرید بیشتر XRP در نظر گرفته باشند. البته، تنها زمان مشخص خواهد کرد که آیا این شرط‌بندی از سوی نهنگ‌ها نتیجه خواهد داد یا خیر.

    پیش‌بینی نوسانات قیمت XRP

    در اخبار دیگر، XRP ممکن است در حال آماده شدن برای یک حرکت پرنوسان باشد، همانطور که این تحلیلگر در پست دیگری در X برجسته کرده است. شاخصی که توسط مارتینز ذکر شده، باندهای بولینگر است، ابزاری که عموماً برای اندازه‌گیری نوسانات یک دارایی استفاده می‌شود. این شاخص دارای سه باند است: یک خط میانگین متحرک ۲۰ روزه (MA) و دو سطح در دو طرف آن که با انحرافات استاندارد مشخصی به سمت بالا و پایین مطابقت دارند. از نمودار، مشخص است که باندهای بولینگر اخیراً در اطراف قیمت ۳ روزه XRP فشرده شده‌اند. این نشان می‌دهد که این ارز دیجیتال، عملکرد قیمتی راکدی را تجربه کرده است. به گفته این تحلیلگر، فشرده‌سازی فعلی در این معیار، شدیدترین فشرده‌سازی در بیش از یک سال گذشته است. مارتینز خاطرنشان کرد: “هنگامی که نوسانات این‌چنین فشرده می‌شود، این سیگنالی است که یک گسترش قیمت شدید در حال نزدیک شدن است.”

    قیمت XRP

    XRP به طور خلاصه یک هفته پیش از مرز ۰.۵۴ دلار عبور کرد، اما از آن زمان شاهد کاهش قابل توجهی بوده است و قیمت آن به ۱.۳۷ دلار بازگشته است.
    تصویر برجسته از Dall-E، نمودار از TradingView.com.
  • XRP Price Faces Mounting Breakout Pressure

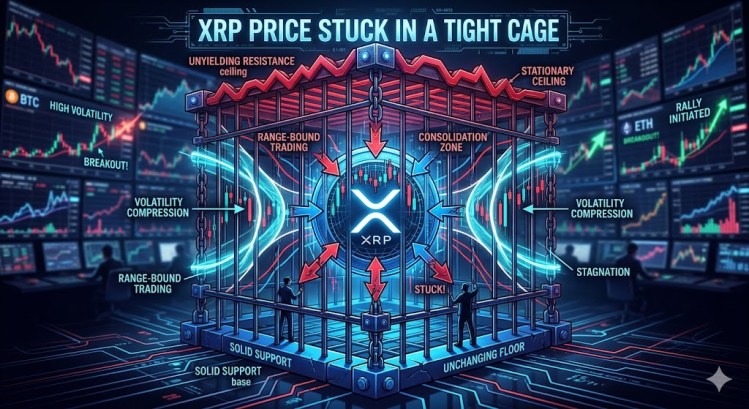
    XRP Price Faces Mounting Breakout Pressure

    XRP Price Consolidates, Eyes Further Gains

    XRP’s price has begun a recovery, trading above $1.3620 and $1.3650. The cryptocurrency is currently consolidating and could attempt another upward move if it surpasses $1.3840.

    Technical Analysis

    XRP has initiated a recovery wave, trading above the $1.3640 zone. The price is currently below $1.3820 and the 100-hourly Simple Moving Average. A contracting triangle is forming, with resistance at $1.380 on the hourly chart for the XRP/USD pair, according to data from Kraken. The pair could continue its upward trajectory if it settles above $1.3840.

    Potential Gains

    Supported above $1.350, XRP has initiated a recovery wave, mirroring trends seen in Bitcoin and Ethereum. The price has climbed above $1.3580 and $1.3620, entering a short-term positive zone. However, it remains below $1.3850 and the 23.6% Fibonacci retracement level of the downward movement from the $1.5495 swing high to the $1.3465 swing low.

    A contracting triangle is also forming, with resistance at $1.380 on the hourly chart of the XRP/USD pair. The price is currently trading below $1.3750 and the 100-hourly Simple Moving Average.

    If the price moves upward, it may encounter resistance near $1.3780. The primary resistance level is near $1.380. A close above $1.380 could push the price to $1.3840, with the next hurdle at $1.3940. A clear break above the $1.3940 resistance could send the price towards the $1.420 resistance. Further gains could see the price targeting the $1.4480 resistance or the 50% Fibonacci retracement level of the downward move from the $1.5495 swing high to the $1.3465 swing low.

    Potential Decline

    If XRP fails to break above the $1.3840 resistance zone, a fresh decline could ensue. Initial support on the downside is near the $1.360 level. The next major support is near $1.3580. A break below $1.3580 could lead to a further decline towards $1.340. The subsequent major support is near the $1.3380 zone, below which the price could continue to fall towards $1.3250.

    Technical Indicators

    • Hourly MACD: The MACD for XRP/USD is losing momentum in the bullish zone.
    • Hourly RSI: The RSI for XRP/USD is above the 50 level.

    Key Levels

    • Major Support Levels: $1.3600 and $1.3580.
    • Major Resistance Levels: $1.3840 and $1.3940.
  • Zcash Surges to Six-Month High, Eyes $700 Mark

    Zcash Surges to Six-Month High, Eyes $700 Mark

    Zcash (ZEC) has reached its highest level since 2025, but the recent surge is now approaching a significant technical hurdle. While some analysts are observing the first “constructive signs” in months, others are cautioning about potential signs of market exhaustion.

    ZEC Rally Faces Key Barrier

    Zcash has been a leader in the cryptocurrency market amidst recent volatility, gaining over 21% in the past week and 110% over the last 30 days. Throughout May, the cryptocurrency has risen from the $350 level to reclaim the $670 area, reaching a six-month high of $690 on Wednesday.

    Market analyst Ali Martinez highlighted a multi-month horizontal channel that has been forming since October between the $192 and $698 levels. After retesting the channel’s bottom in March, ZEC has jumped approximately 250% towards the upper zone of the channel, nearing a retest of the macro resistance. Martinez stated that the next step “is seeing whether buyers step in hard enough to force a breakout” from the crucial resistance zone.

    However, he noted that Zcash may be showing signs of exhaustion as it approaches the “same resistance zone that triggered a major rejection back in November,” between $700 and $730. According to the analysis, ZEC’s TD Sequential indicator is currently flashing a sell signal on the weekly chart, while momentum indicators “are starting to look stretched again,” making it an important setup to watch.

    Martinez noted that the 250% move from the bottom to the top of the channel was anticipated by a TD Sequential buy signal on the weekly chart, asserting that the correction could be more significant since the sell signal has appeared in the weekly timeframe. He suggested that Zcash could see a 25% correction towards the $500 area as the initial target, adding that a 45% drop towards the $380 support may follow if a deeper retracement occurs. “So, while both HYPE and Zcash remain in strong uptrends, they are also entering zones where risk increases significantly,” he warned.

    Zcash Shows ‘Constructive Signs’

    While the price holds the December highs as support in the weekly timeframe, analyst Rekt Capital pointed out that Zcash is “showing initial Bull Flag tendencies similar to what developed a few weeks prior, with positive pressure building at $528.951.” The market observer affirmed that the recent performance is “the first opportunity to see whether ZEC can hold these levels in a durable way,” adding that “so far the early signs are constructive.”

    Continuing to hold this area would contradict the prior failed retest and suggest a real shift in market dynamics, with buyers willing to accumulate here. He explained that if Zcash continues to retest the $698 resistance and produces shallower rejections, it would signal that the $700 psychological barrier is weakening, which could, over time, open the path for price discovery.

    Nonetheless, he noted that price stability at current levels is crucial, and continued weekly closes above the $530 area would confirm the shift in market dynamics from last year’s attempt. On the monthly timeframe, Rekt Capital affirmed that a close above $514 is also critical, as it marks the three-month resistance zone that capped its breakout attempts between late 2025 and early 2026. “A Monthly Close above it, followed by a successful retest as new support, would be a compelling setup,” he concluded.

  • Nexpace Launches NXPC Buyback to Boost MapleStory Ecosystem

    Nexpace Launches NXPC Buyback to Boost MapleStory Ecosystem

    Nexpace Launches $10 Million NXPC Buyback Program

    Abu Dhabi, UAE – May 22nd, 2026 – Nexpace, the Abu Dhabi-based blockchain company behind MapleStory Universe (MSU), today announced a buyback program for its native token, NXPC, valued at up to $10 million. The initiative aims to strengthen the token’s circulation structure and support the long-term sustainability of the MSU ecosystem.

    NXPC is the utility token within MSU, the blockchain-integrated expansion of Nexon’s popular MapleStory intellectual property. It facilitates user engagement through rewards and item unlocks.

    Program Details

    Nexpace will purchase up to $10 million worth of NXPC on global digital asset exchanges through open market operations. To mitigate potential market impact, the purchases will be executed in multiple tranches over a three-month period and managed by an external execution partner.

    Rationale and Performance

    The buyback program is informed by insights gathered during MSU’s first year of operation. Over the past year, more than 850,000 wallets have engaged with the platform, with approximately two-thirds utilizing NXPC monthly. This activity has generated 49.1 million NXPC in ecosystem revenue, equivalent to $31 million. By the first quarter of 2026, player spending surpassed distributed rewards, indicating robust organic engagement within the ecosystem.

    Combined with the 8.32 million NXPC already burned, the buyback program is designed to support healthy token circulation as MSU evolves into a broader IP-driven ecosystem. It also reinforces the long-term alignment of NXPC for active participants and contributors.

    Executive Commentary

    Sun Young Hwang, Chief Executive Officer at Nexpace, stated, “As MapleStory Universe continues to evolve, our focus remains on building an ecosystem where participation and utility remain closely connected. This program reflects our ongoing commitment to supporting healthier long-term ecosystem dynamics as engagement continues to grow. Year one gave us confidence that we are on the right path, and we want to ensure long-term users, builders, and contributors are meaningfully rewarded for what they help build.”

    NXPC acquired through the program will be retained within the treasury to support the long-term sustainability of the ecosystem.

    About Nexpace

    Nexpace is a blockchain company based in Abu Dhabi that is pioneering an IP-expansion initiative powered by blockchain technology and NFTs to build a community-driven ecosystem. Nexpace aims to redefine interactive entertainment by creating a space for exploring, sharing, and engaging with diverse content and gameplay crafted by community members. The company emphasizes transparency, security, and trust to empower builders and provide immersive experiences for users.

    Disclaimer

    This press release contains forward-looking statements regarding MapleStory Universe, MSU 2.0, and related plans. It does not constitute an offer, solicitation, or recommendation to buy or sell NXPC or any digital asset; availability may be restricted in certain jurisdictions. All metrics are based on internal data or third-party sources as indicated and measured under the definitions and periods specified.

  • ‏بازگشت سولانا در آستانه آزمونی بزرگ

    ‏بازگشت سولانا در آستانه آزمونی بزرگ

    حمایت سولانا و آغاز روند اصلاحی
    سولانا پس از رسیدن به سطح حمایتی ۸۳.۵۰ دلار، بخشی از ضررهای خود را جبران کرد.

    قیمت SOL در حال حاضر در زیر ۸۸.۵۰ دلار در حال تثبیت است و ممکن است برای ادامه روند صعودی با مشکل مواجه شود.

    روند صعودی قیمت

    قیمت SOL یک موج بازیابی مناسب را بالای ۸۵ و ۸۶ دلار در برابر دلار آمریکا آغاز کرد. در حال حاضر، قیمت بالای ۸۶ دلار و میانگین متحرک ساده ۱۰۰ ساعته قرار دارد. یک کانال صعودی با مقاومت ۸۸.۵۰ دلار در نمودار ساعتی جفت ارز SOL/USD (منبع داده از Kraken) در حال شکل‌گیری است. اگر قیمت از سطوح ۸۸.۵۰ و ۹۰.۰۰ دلار عبور کند، می‌تواند به حرکت صعودی خود ادامه دهد.

    آغاز بازیابی قیمت سولانا

    قیمت سولانا پس از رسیدن به سطح ۸۳.۵۰ دلار، مانند بیت‌کوین و اتریوم، ثبات خود را حفظ کرد و یک موج بازیابی مناسب را آغاز کرد. SOL توانست از سطح ۸۵ دلار عبور کند. همچنین، حرکتی بالای سطح اصلاحی ۳۸.۲٪ فیبوناچی از حرکت نزولی از سقف ۹۳.۶۳ دلار تا کف ۸۳.۳۵ دلار مشاهده شد. با این حال، خرس‌ها در زیر ۸۸ دلار فعال باقی ماندند. یک کانال صعودی با مقاومت ۸۸.۵۰ دلار در نمودار ساعتی جفت ارز SOL/USD نیز در حال شکل‌گیری است. سولانا در حال حاضر بالای ۸۶ دلار و میانگین متحرک ساده ۱۰۰ ساعته معامله می‌شود. مقاومت فوری در سمت بالا نزدیک به سطح ۸۸.۰۰ دلار است. مقاومت اصلی بعدی نزدیک به سطح ۸۸.۵۰ دلار یا سطح اصلاحی ۵۰٪ فیبوناچی از حرکت نزولی از سقف ۹۳.۶۳ دلار تا کف ۸۳.۳۵ دلار است. مقاومت اصلی می‌تواند ۹۰ دلار باشد. بسته شدن موفقیت‌آمیز بالای منطقه مقاومت ۹۰ دلار می‌تواند زمینه را برای افزایش پایدار دیگری فراهم کند. مقاومت کلیدی بعدی ۹۲ دلار است. هر گونه افزایش بیشتر ممکن است قیمت را به سمت سطح ۹۴ دلار سوق دهد.

    احتمال کاهش مجدد قیمت SOL

    اگر SOL نتواند از مقاومت ۸۸.۵۰ دلار عبور کند، ممکن است به حرکت نزولی خود ادامه دهد. حمایت اولیه در سمت پایین نزدیک به منطقه ۸۶.۲۰ دلار است. اولین حمایت اصلی نزدیک به سطح ۸۵.۰۰ دلار است. شکست زیر سطح ۸۵.۰۰ دلار ممکن است قیمت را به سمت منطقه حمایتی ۸۳.۵۰ دلار سوق دهد. اگر زیر حمایت ۸۳.۵۰ دلار بسته شود، قیمت می‌تواند در کوتاه‌مدت به سمت منطقه ۸۰ دلار کاهش یابد.

    شاخص‌های فنی

    • MACD ساعتی: MACD برای SOL/USD در حال از دست دادن سرعت در منطقه نزولی است.
    • شاخص قدرت نسبی (RSI) ساعتی: RSI برای SOL/USD بالای سطح ۵۰ قرار دارد.

    سطوح حمایت و مقاومت اصلی

    • سطوح حمایت: ۸۶.۲۰۰ و ۸۵.۰۰ دلار
    • سطوح مقاومت: ۸۸.۵۰ و ۹۰.۰۰ دلار
  • ‏زِکَش به بالاترین سطح شش ماهه رسید؛ آیا از مرز ۷۰۰ دلار عبور می‌کند؟

    ‏زِکَش به بالاترین سطح شش ماهه رسید؛ آیا از مرز ۷۰۰ دلار عبور می‌کند؟

    ‏Zcash (ZEC) به بالاترین سطح خود از سال ۲۰۲۵ رسیده است، اما این افزایش در حال نزدیک شدن به یک مانع فنی مهم است. در حالی که برخی از تحلیلگران به اولین “نشانه‌های سازنده” در ماه‌ها اشاره می‌کنند، دیگران نسبت به نشانه‌های احتمالی فرسودگی هشدار می‌دهند.

    افزایش ۱۱۰ درصدی ZEC با مانع کلیدی روبرو است

    Zcash در میان رهبران بازار ارزهای دیجیتال در نوسانات اخیر بوده است و در هفته گذشته بیش از ۲۱ درصد و در ۳۰ روز گذشته ۱۱۰ درصد افزایش یافته است. در طول ماه می، این ارز دیجیتال از مانع ۳۵۰ دلاری عبور کرد و به منطقه ۶۷۰ دلاری بازگشت و در روز چهارشنبه به بالاترین سطح شش ماهه خود یعنی ۶۹۰ دلار رسید. علی مارتینز، ناظر بازار، در میان این عملکرد، یک کانال افقی چند ماهه را برجسته کرد که از اکتبر بین سطح ۱۹۲ و ۶۹۸ دلار در حال شکل‌گیری بوده است. پس از آزمایش مجدد کف کانال در ماه مارس، ZEC حدود ۲۵۰ درصد به سمت منطقه بالایی کانال جهش کرد و به آزمایش مجدد مقاومت کلان نزدیک شد. این تحلیلگر تأیید کرد که گام بعدی “مشاهده این است که آیا خریداران به اندازه کافی وارد عمل می‌شوند تا یک شکست” از منطقه مقاومت حیاتی را رقم بزنند. با این وجود، او خاطرنشان کرد که Zcash ممکن است نشانه‌هایی از فرسودگی را در حالی که به “همان منطقه مقاومتی که باعث رد شدن عمده در نوامبر شد” بین ۷۰۰ تا ۷۳۰ دلار نزدیک می‌شود، نشان دهد. طبق این پست، TD Sequential ZEC در حال حاضر یک سیگنال فروش را در نمودار هفتگی نشان می‌دهد، در حالی که شاخص‌های مومنتوم “دوباره شروع به کشیدگی می‌کنند”، که این یک تنظیم مهم برای مشاهده است. مارتینز خاطرنشان کرد که حرکت ۲۵۰ درصدی از پایین به بالای کانال توسط یک سیگنال خرید TD Sequential در نمودار هفتگی پیش‌بینی شده بود و تأکید کرد که اصلاح می‌تواند قابل توجه‌تر باشد زیرا سیگنال فروش در بازه زمانی هفتگی ظاهر شده است. او پیشنهاد کرد که Zcash می‌تواند یک اصلاح ۲۵ درصدی را به سمت منطقه ۵۰۰ دلاری به عنوان هدف اولیه ببیند و افزود که اگر یک عقب‌نشینی عمیق‌تر رخ دهد، ممکن است یک افت ۴۵ درصدی به سمت حمایت ۳۸۰ دلاری دنبال شود. او هشدار داد: “بنابراین، در حالی که هم HYPE و هم Zcash در روندهای صعودی قوی باقی می‌مانند، آنها همچنین وارد مناطقی می‌شوند که در آن خطر به طور قابل توجهی افزایش می‌یابد.”

    Zcash “نشانه‌های سازنده” را نشان می‌دهد

    در حالی که قیمت حمایت‌های دسامبر را در بازه زمانی هفتگی حفظ می‌کند، تحلیلگر Rekt Capital خاطرنشان کرد که Zcash “تمایلات اولیه پرچم صعودی را نشان می‌دهد مشابه آنچه چند هفته قبل توسعه یافت، با فشار مثبت در ۵۲۸.۹۵۱ دلار.” ناظر بازار تأیید کرد که عملکرد اخیر “اولین فرصت برای دیدن این است که آیا ZEC می‌تواند این سطوح را به روشی پایدار حفظ کند” و افزود که “تا کنون نشانه‌های اولیه سازنده هستند.” حفظ این منطقه با آزمایش مجدد ناموفق قبلی مغایرت دارد و نشان‌دهنده یک تغییر واقعی در پویایی بازار است، با خریدارانی که مایل به انباشت در اینجا هستند. او توضیح داد که اگر Zcash به آزمایش مجدد مقاومت ۶۹۸ دلاری ادامه دهد و رد شدن‌های کم‌عمق‌تری را ایجاد کند، این نشان می‌دهد که مانع روانی ۷۰۰ دلاری در حال تضعیف است، که می‌تواند به مرور زمان راه را برای کشف قیمت باز کند. با این وجود، او خاطرنشان کرد که ثبات قیمت در سطوح فعلی بسیار مهم است و بسته شدن‌های هفتگی مداوم بالای منطقه ۵۳۰ دلار، تغییر در پویایی بازار را از تلاش‌های سال گذشته تأیید می‌کند. Rekt Capital در بازه زمانی ماهانه تأیید کرد که بسته شدن بالای ۵۱۴ دلار نیز حیاتی است، زیرا این منطقه مقاومت سه ماهه را نشان می‌دهد که تلاش‌های شکست آن را بین اواخر سال ۲۰۲۵ و اوایل سال ۲۰۲۶ محدود کرده است. او نتیجه‌گیری کرد: “بسته شدن ماهانه بالای آن، به دنبال یک آزمایش مجدد موفقیت‌آمیز به عنوان حمایت جدید، یک تنظیم قانع‌کننده خواهد بود.”

  • ‏تحلیلگر هشدار داد: XRP پیش از جهش بزرگ، معامله‌گران را “تکان” می‌دهد.

    ‏تحلیلگر هشدار داد: XRP پیش از جهش بزرگ، معامله‌گران را “تکان” می‌دهد.

    ‏XRP برای شروع یک جهش واقعی باید از مرز ۱.۵۱ دلار عبور کند، این نظر مت هتز، تحلیلگر بازار است. یک تحلیلگر دیگر معتقد است که این اتفاق ممکن است این هفته رخ دهد، اما نه قبل از اینکه بازار ضعیف‌ترین دارندگان را از دور خارج کند.

    الگویی که سال‌ها در حال شکل‌گیری است

    مایکل ایکس‌بی‌تی، تحلیلگر مشهور ارزهای دیجیتال، می‌گوید XRP ماه‌هاست که در نمودار هفتگی خود یک الگوی “گوه نزولی” را تشکیل داده است؛ ساختاری که معمولاً پس از عبور قیمت از مرز بالایی، به سمت بالا حرکت می‌کند.

    این ارز دیجیتال از ژوئیه ۲۰۲۵ در این الگو گرفتار شده است، زمانی که به اوج ۳.۶۶ دلار رسید. از آن زمان تاکنون حدود ۶۰ درصد از ارزش خود را از دست داده و در بحبوحه یک ریزش گسترده‌تر بازار که در اکتبر همان سال آغاز شد، به حدود ۱.۳۷ دلار رسیده است.

    مرز بالایی این گوه چندین بار جلوی XRP را گرفته است. تلاش‌ها در نزدیکی ۳ دلار در اواخر سال ۲۰۲۵ با شکست مواجه شد. یک تلاش در ژانویه ۲۰۲۶ در ۲.۴۱ دلار متوقف شد. اکنون، با نزدیک شدن قیمت به باریک‌ترین قسمت این ساختار، مایکل ایکس‌بی‌تی معتقد است که حرکت بعدی – “تکان” – نزدیک است.

    مایکل ایکس‌بی‌تی در توییتر نوشت: “XRP این هفته شما را بیرون خواهد انداخت. سپس جهش آغاز خواهد شد. این یک طراحی است. آن‌ها می‌خواهند توده‌ها بیرون بروند.”

    سیگنال‌های یک گوه نزولی

    یک گوه نزولی زمانی شکل می‌گیرد که قیمت بین دو خط شیب‌دار به سمت پایین حرکت می‌کند که به تدریج باریک می‌شوند. فشار فروش با توسعه این الگو تمایل به کاهش دارد. هنگامی که قیمت در نهایت از خط بالایی عبور می‌کند، اغلب یک حرکت صعودی شدید را آغاز می‌کند.

    در حال حاضر، این خط بالایی در محدوده قیمت ۱.۵۰ تا ۱.۵۱ دلار برای XRP قرار دارد – سطحی که هتز آن را به عنوان آستانه‌ای توصیف کرد که این دارایی باید قبل از تأیید جهش از آن عبور کند. XRP نتوانسته است به طور قطعی بالای این ناحیه بسته شود.

    این الگو به خودی خود، جهش را تضمین نمی‌کند. اما تحلیلگرانی که این ساختار را دنبال می‌کنند، می‌گویند موقعیت قیمت در راس – نوک گوه – تمایل دارد که یک تصمیم را در یک جهت یا جهت دیگر تحمیل کند.

    تکان قبل از حرکت

    هشدار مایکل ایکس‌بی‌تی کمتر در مورد خود جهش است و بیشتر در مورد اتفاقی است که درست قبل از آن رخ می‌دهد. او می‌گوید که بازار احتمالاً ابتدا XRP را پایین‌تر می‌کشد و دارندگانی را که اعتقاد راسخ ندارند، از دور خارج می‌کند. از نظر او، این نوع حرکت عمدی است – برای پاکسازی سرمایه‌گذاران خرد قبل از شروع حرکت اصلی طراحی شده است.

    تحلیلگران دیگر در ماه مارس نگرانی مشابهی را مطرح کردند و استدلال کردند که حرکت بزرگ بعدی قیمت می‌تواند عزم اکثر خریداران معمولی XRP را بشکند.

    اینکه آیا این تکان همانطور که پیش‌بینی شده است این هفته اتفاق می‌افتد یا خیر، کسی نمی‌داند. در حال حاضر، XRP در یک دوراهی قرار دارد و به ساختاری فشرده شده است که تقریباً یک سال است در حال شکل‌گیری است.

    تصویر برجسته از Unsplash، نمودار از TradingView

  • Analyst Predicts XRP to Capture 31% of Crypto Market.

    Analyst Predicts XRP to Capture 31% of Crypto Market.

    XRP’s Market Dominance Shows Bullish Structure, Analyst Says

    Crypto analyst Will Taylor, known as Cryptoinsightuk on X, believes XRP’s market capitalization dominance still indicates a bullish structure, despite its recent pullback from a key range high. His latest chart of XRP.D suggests a potential long-term move toward 31.26% dominance, significantly above the current level near 3.315%.

    Taylor’s analysis focuses on market structure rather than short-term sentiment. The chart shows XRP dominance holding above a major horizontal level around 3.315% after breaking out from a multi-year range and failing to fully clear the 6.127% area. The weekly setup then compresses into a descending wedge, with Taylor suggesting the retracement has not invalidated the broader breakout.

    “As I look at $XRP.D, I still struggle to feel bearish here,” Taylor wrote. “What I think we’re seeing is: a completed Wyckoff accumulation, a breakout above the major 3.315% resistance, a failed attempt to fully break through the 6.127% range high, then a pullback into a compressed descending wedge.”

    The Path to 31% Market Dominance for XRP

    The chart identifies 6.127% as the next major range high, while 31.26% is marked as a possible upside objective. This implies a significant expansion in XRP’s share of the total crypto market if the analyst’s continuation thesis plays out. This doesn’t necessarily require XRP to rise in isolation; dominance can also increase if XRP outperforms other major crypto assets during a broader rotation.

    Taylor’s analysis centers on the behavior after the failed push through 6.127%. Rather than viewing the rejection as evidence of distribution, he describes the current structure as compression. He believes a decisive bearish breakdown would likely exhibit stronger downside momentum and heavier sell pressure.

    “To me, that matters,” he said. “Because descending wedges are often reversal / continuation structures, especially when they’re paired with diminishing volume. If sellers were truly in control, I’d expect to see expanding downside volatility and aggressive sell volume, not compression.”

    The chart also includes the Relative Strength Index (RSI), which has been trending lower alongside price compression. Taylor argues this does not represent a full structural breakdown. Instead, the indicator appears to be compressing in its own downtrend while XRP dominance holds above the breakout zone. This distinction is central to his thesis. A market that breaks out, rejects at a higher resistance, then consolidates above former resistance can still be considered constructive, provided the former breakout level is defended. In this case, the 3.315% zone is the key reference point. A sustained loss of that area would weaken the continuation argument, while a breakout from the wedge could bring the 6.127% range high back into focus.

    The Wyckoff Thesis

    The Wyckoff labels on Taylor’s chart are central to the bullish reading. The structure marks a long accumulation sequence beginning with preliminary support, or PS, followed by a selling climax and secondary test around the 2020–2021 lows. The subsequent automatic rally, secondary test, and “spring” are presented as the base-building phase before XRP dominance reclaimed higher ground.

    From there, the chart identifies a move over the “creek,” a Wyckoff term often used to describe the transition out of an accumulation range, followed by a sign of strength near the 6.127% range high. The latest pullback is labeled as an LPS, or last point of support, which in Wyckoff analysis is typically watched as a potential higher-low area before continuation. That makes the 31.26% marker more than a loose upside arrow in Taylor’s framing. The chart is effectively arguing that XRP dominance has moved from accumulation into markup, with the current descending wedge serving as a possible consolidation above the breakout zone rather than evidence of failed demand. The bullish case depends on that LPS interpretation holding; if the structure breaks back below the reclaimed 3.315% level, the Wyckoff continuation thesis would become harder to defend.

    Taylor also framed the setup as one that may need a catalyst. “It honestly feels like XRP dominance is waiting for a catalyst before attempting another move higher,” he wrote. “I know this goes against a lot of current sentiment and market interpretation, but I’d genuinely love to hear the bearish argument from here structurally, because right now I still see more signs pointing toward bullish continuation than full distribution.”

    The 31.26% marker gives the chart its most striking implication, but the nearer technical question is whether XRP dominance can continue to hold the reclaimed 3.315% level and resolve the wedge to the upside. For now, Taylor’s read is clear: the structure has pulled back, but in his view, it has not yet broken.

  • ‏تحلیلگر مسیر XRP به سوی ۳۱٪ از کل بازار ارزهای دیجیتال را ترسیم کرد.

    ‏تحلیلگر مسیر XRP به سوی ۳۱٪ از کل بازار ارزهای دیجیتال را ترسیم کرد.

    ‏تحلیلگر ارزهای دیجیتال، ویل تیلور، که با نام کاربری Cryptoinsightuk در X شناخته می‌شود، اعلام کرد که تسلط بازار XRP همچنان ساختار صعودی را نشان می‌دهد، با وجود عقب‌نشینی اخیر از یک سقف محدوده کلیدی. نمودار اخیر او از XRP.D یک حرکت بالقوه بلندمدت به سمت تسلط 31.26 درصدی را نشان می‌دهد که بسیار بالاتر از محدوده فعلی نزدیک به 3.315 درصد است. استدلال تیلور بر ساختار بازار متمرکز است تا احساسات کوتاه‌مدت. در این نمودار، تسلط XRP پس از خروج از یک محدوده چند ساله و عدم موفقیت در عبور کامل از محدوده 6.127 درصدی، بالای یک سطح افقی اصلی در حدود 3.315 درصد حفظ شده است. سپس این ساختار هفتگی به یک گوه نزولی فشرده می‌شود و تحلیلگر معتقد است که اصلاح هنوز خروج گسترده‌تر را باطل نکرده است. تیلور نوشت: «همانطور که به XRP.D نگاه می‌کنم، هنوز در اینجا احساس نزولی بودن برایم دشوار است. چیزی که فکر می‌کنم در حال مشاهده آن هستیم: تکمیل انباشت وایکوف، خروج از مقاومت اصلی 3.315 درصدی، تلاش ناموفق برای عبور کامل از سقف محدوده 6.127 درصدی و سپس عقب‌نشینی به یک گوه نزولی فشرده.»

    مسیر به سمت تسلط 31 درصدی بازار برای XRP

    این نمودار 6.127 درصد را به عنوان سقف محدوده اصلی بعدی نشان می‌دهد، در حالی که 31.26 درصد بسیار بالاتر در مقیاس تسلط به عنوان یک هدف صعودی احتمالی مشخص شده است. این چارچوب، در صورت تحقق فرضیه ادامه تحلیلگر، حاکی از گسترش تهاجمی سهم XRP از کل بازار ارزهای دیجیتال است. این امر مستلزم افزایش XRP به تنهایی نیست. تسلط می‌تواند در صورت عملکرد بهتر XRP نسبت به سایر دارایی‌های اصلی ارزهای دیجیتال در طول یک چرخش گسترده‌تر نیز افزایش یابد.

    تمرکز تیلور بر رفتار پس از تلاش ناموفق برای عبور از 6.127 درصد است. او به جای دیدن این رد شدن به عنوان شواهدی از توزیع، ساختار فعلی را به عنوان فشرده‌سازی توصیف کرد. از نظر او، یک شکست نزولی قاطع احتمالاً متفاوت به نظر می‌رسید، با حرکت نزولی قوی‌تر و فشار فروش بیشتر. او گفت: «از نظر من، این مهم است. زیرا گُوه‌های نزولی اغلب ساختارهای معکوس/ادامه هستند، به خصوص زمانی که با کاهش حجم همراه باشند. اگر فروشندگان واقعاً کنترل را در دست داشتند، انتظار داشتم نوسانات نزولی در حال گسترش و حجم فروش تهاجمی را ببینم، نه فشرده‌سازی.»

    این نمودار همچنین شامل RSI است که همراه با فشرده‌سازی قیمت در حال کاهش بوده است. تیلور استدلال کرد که این هنوز نشان‌دهنده یک فروپاشی ساختاری کامل نیست. در عوض، او گفت که به نظر می‌رسد این شاخص در روند نزولی خود فشرده می‌شود، در حالی که تسلط XRP بالای منطقه خروج حفظ می‌شود. این تمایز برای فرضیه او اساسی است. بازاری که از آن خارج می‌شود، در یک مقاومت بالاتر رد می‌شود، سپس بالای مقاومت قبلی تثبیت می‌شود، همچنان می‌تواند سازنده تلقی شود، به شرطی که سطح خروج قبلی حفظ شود. در این مورد، منطقه 3.315 درصد نقطه مرجع کلیدی است. از دست دادن پایدار این منطقه، استدلال ادامه را تضعیف می‌کند، در حالی که خروج از گوه می‌تواند سقف محدوده 6.127 درصدی را دوباره در کانون توجه قرار دهد.

    فرضیه وایکوف

    برچسب‌های وایکوف در نمودار تیلور برای خوانش صعودی اساسی هستند. این ساختار یک توالی انباشت طولانی را نشان می‌دهد که با پشتیبانی اولیه یا PS آغاز می‌شود، و به دنبال آن یک اوج فروش و آزمایش ثانویه در حدود پایین‌ترین سطح 2020-2021 قرار دارد. رالی خودکار بعدی، آزمایش ثانویه و «جهش» به عنوان فاز ساخت پایه قبل از اینکه تسلط XRP زمین‌های مرتفع‌تری را پس بگیرد، ارائه شده است.

    از آنجا، این نمودار حرکتی را بر فراز «جویبار» شناسایی می‌کند، اصطلاحی از وایکوف که اغلب برای توصیف انتقال از یک محدوده انباشت استفاده می‌شود، و به دنبال آن نشانه‌ای از قدرت در نزدیکی سقف محدوده 6.127 درصدی قرار دارد. آخرین عقب‌نشینی به عنوان LPS یا آخرین نقطه پشتیبانی برچسب‌گذاری شده است که در تحلیل وایکوف معمولاً به عنوان یک منطقه بالقوه بالاتر از پایین قبل از ادامه، مشاهده می‌شود. این امر نشانگر 31.26 درصدی را بیش از یک فلش صعودی آزاد در چارچوب تیلور می‌کند. این نمودار در واقع استدلال می‌کند که تسلط XRP از انباشت به علامت‌گذاری منتقل شده است، و گوه نزولی فعلی به عنوان یک تثبیت احتمالی بالای منطقه خروج عمل می‌کند تا شواهدی از تقاضای ناموفق. پرونده صعودی به حفظ این تفسیر LPS بستگی دارد. اگر ساختار به زیر سطح 3.315 درصدی بازگردد، فرضیه ادامه وایکوف دفاع از آن دشوارتر می‌شود.

    تیلور همچنین این ساختار را به عنوان ساختاری که ممکن است به یک کاتالیزور نیاز داشته باشد، چارچوب‌بندی کرد. او نوشت: «صادقانه بگویم، احساس می‌کنم تسلط XRP منتظر یک کاتالیزور است تا تلاش دیگری برای افزایش انجام دهد. می‌دانم که این با بسیاری از احساسات فعلی و تفسیر بازار مغایرت دارد، اما من واقعاً دوست دارم استدلال نزولی را از اینجا به صورت ساختاری بشنوم، زیرا در حال حاضر هنوز نشانه‌های بیشتری را می‌بینم که به سمت ادامه صعودی اشاره دارند تا توزیع کامل.»

    نشانگر 31.26 درصدی چشمگیرترین پیامد را به نمودار می‌دهد، اما سؤال فنی نزدیک‌تر این است که آیا تسلط XRP می‌تواند همچنان سطح 3.315 درصدی را حفظ کند و گوه را به سمت بالا حل کند. در حال حاضر، برداشت تیلور روشن است: این ساختار عقب‌نشینی کرده است، اما از نظر او، هنوز شکسته نشده است. در زمان انتشار، XRP با قیمت 1.36 دلار معامله می‌شد.

  • Nakamoto Moves to Stabilize Stock Price

    Nakamoto Moves to Stabilize Stock Price

    Nakamoto Sells Bitcoin to Cover Costs Amidst Financial Struggles

    Nakamoto sold 284 Bitcoin on the last day of March to cover operational expenses, according to the company’s first-quarter financial results. This detail highlights the current situation of one of the country’s Bitcoin treasury companies.

    Mounting Losses and Shifting Strategy

    The Bitcoin accumulation strategy that once propelled Nakamoto’s stock above $25 per share has been replaced by selling Bitcoin to manage operating costs. The company reported a net loss of $238 million for the first quarter. Over $102 million of this loss stemmed from a 20% decline in the value of its Bitcoin holdings during the quarter. Despite a 500% increase in revenue quarter-over-quarter, the losses overshadowed these gains.

    Nakamoto currently holds 5,058 Bitcoin, making it the 20th largest corporate Bitcoin holder globally, just behind ProCap Financial. Michael Saylor’s strategy leads the list, holding over 843,000 Bitcoin.

    Reverse Stock Split to Maintain Nasdaq Listing

    The company is now focused on maintaining its listing on the Nasdaq. Last December, Nasdaq issued a warning to Nakamoto after its stock price fell below $1 for 30 consecutive trading days. The deadline to rectify this is June 8. The company’s chosen solution is a 1-for-40 reverse stock split, scheduled to take effect on Friday. Shareholders approved the move at a special meeting earlier this month.

    The reverse stock split will consolidate every 40 shares into one, reducing the total share count from 696 million to 17.4 million. The stock closed at 16 cents on Wednesday, down 7.5% for the day and more than 99% below its price a year ago. A reverse split does not affect a company’s overall market value; it is a structural adjustment designed to increase the price per share above the listing threshold.

    Broader Sector Downturn

    Nakamoto’s challenges are not isolated. Reports suggest that crypto treasury companies have generally experienced a downturn since 2025, with many trading below the value of their assets. Some companies have begun selling their Bitcoin holdings to address debt. For example, Genius Group liquidated its entire 84 Bitcoin reserve in February.