Author: Admin_Up

  • ‏زِکَش در ۳۰ روز ۸۸٪ صعود کرد: آیا ZEC برنده پنهان این چرخه رمزارزهاست؟

    ‏زِکَش در ۳۰ روز ۸۸٪ صعود کرد: آیا ZEC برنده پنهان این چرخه رمزارزهاست؟

    ‏آرتور هیز، از بنیانگذاران BitMEX، پیشنهاد کرده است که Zcash (ZEC) در نهایت می تواند به 10 درصد از ارزش بازار بیت کوین برسد. این یک تحلیل بلندمدت صعودی در مورد ارزهای دیجیتال حریم خصوصی است، نه یک پیش بینی قیمت در کوتاه مدت. بر اساس عرضه در گردش ZEC که حدود 16 میلیون توکن است، این سناریو به معنای قیمتی در محدوده چهار رقمی بالا، تقریباً 8000 تا 10000 دلار، بسته به ارزش بیت کوین خواهد بود.

    الگوی نموداری قابل توجه

    از نظر فنی، معامله گران به یک الگوی احتمالی فنجان و دسته اشاره می کنند، اما این یک شکل گیری نموداری ذهنی است که هیچ تضمینی برای نتیجه ندارد. مقاومت اغلب در حدود 625 تا 650 دلار ذکر می شود، با برخی پیش بینی های سفته بازانه که حاکی از حرکت به سمت 1000 دلار است، اگرچه این موضوع به شدت به شرایط گسترده تر بازار بستگی دارد و یک هدف تایید شده نیست. این هدف همچنین با گسترش 1.618 فیبوناچی ZEC، که از اوج 745 دلاری تا کف 185 دلاری ترسیم شده است، همخوانی دارد.

    ارزهای دیجیتال حریم خصوصی پیشتاز می شوند

    ZEC به تنهایی در حال حرکت نیست. Monero و Dash، هر دو توکن متمرکز بر حریم خصوصی، نیز در ماه گذشته افزایش قیمت داشته اند. اما Zcash پیشتاز است. گزارش ها نشان می دهد که این ارز در 30 روز بیش از 80 درصد افزایش یافته است، در حالی که ارزش کل بازار ارزهای دیجیتال به سختی تغییر کرده است – تنها 0.2 درصد در همین مدت افزایش داشته است.

    به روز رسانی $ZEC

    این ارز در حال حاضر بازار صعودی خود را دارد… من موقعیت فروش خود را بستم. به خصوص با توجه به اینکه $BTC روی حمایت در حدود 76 هزار دلار قرار دارد. حتی یک افزایش کوچک در بیت کوین باعث می شود ZEC در حال حاضر به شدت افزایش یابد.

    تنها در سه روز گذشته، ZEC 18 درصد افزایش یافت، در حالی که بازار گسترده تر 3 درصد کاهش یافت. این اختلاف باعث شده است که برخی از معامله گران بگویند Zcash در حال اجرای بازار صعودی خود است. به نظر می رسد تقاضای فزاینده برای حریم خصوصی مالی، نیروی اصلی محرک این حرکت است و علاقه جدیدی را به ارزی جذب می کند که سال ها نادیده گرفته شده بود.

    علاقه نهادی، سوخت اضافه می کند

    در اوایل ماه مه، صندوق پوشش ریسک Multicoin Capital فاش کرد که در ZEC موقعیت دارد. تقریباً در همان زمان، Robinhood این توکن را به پلتفرم خود اضافه کرد و آن را برای طیف وسیع تری از سرمایه گذاران خرد در دسترس قرار داد. هر دو تحول در زمانی رخ داد که روایت حریم خصوصی در حال شکل گیری بود. اظهار نظر هیز لایه دیگری اضافه کرد. برآورد او گمانه زنی بود – بر اساس مقایسه ارزش بازار با بیت کوین – اما توجه را به خود جلب کرد و طبق داده ها، ارزش ZEC از زمان اظهار نظر او حدود 20.5 درصد بر حسب بیت کوین افزایش یافته است. چه الگوی فنجان و دسته محقق شود یا نه، این ارز قبلاً ثابت کرده است که می تواند به طور مستقل حرکت کند.

    تصویر ویژه از Quicknode، نمودار از TradingView

  • Bitcoin Rally Fueled by Short Squeeze, $70,000s Possible.

    Bitcoin Rally Fueled by Short Squeeze, $70,000s Possible.

    Bitcoin’s Rally Fails Macro Test, Says Wintermute

    Wintermute has stated that Bitcoin’s recent rally has failed its first major macroeconomic test, arguing that the price increase was driven more by leverage and short covering than by sustained spot demand. In its May 18 market update, the trading firm attributed the sharp reversal across digital assets to factors including persistent inflation, rising Treasury yields, ETF outflows, and renewed expectations of interest rate hikes.

    “Last week we said we’d find out fast what kind of rally this was. We found out,” Wintermute wrote. “BTC failed at the 200-day on the first real macro shock, which tells you it was the squeeze driving it all along.” The firm’s analysis framed the week as a macro-driven repricing of assets.

    April’s Consumer Price Index (CPI) came in at 3.8% year-over-year, exceeding the 3.7% consensus estimate, while core CPI rose 0.4% month-over-month. Wintermute noted that the inflation shock has become more difficult for markets to ignore, pointing out that the prolonged energy shock is now impacting core inflation and that real wages turned negative for the first time in three years.

    Market Reacts to Inflation Data

    Markets reacted swiftly to the economic data. The 10-year Treasury yield increased by 28 basis points during the week, reaching 4.58%, its highest level since September 2025. Furthermore, fed funds futures reversed expectations of rate cuts for 2026 and began pricing in a 44% chance of a rate hike by December, up from 22.5% a week earlier. Wintermute observed that the market narrative shifted from “when do they cut” to “do they hike” in just five trading days.

    This repricing negatively impacted long-duration assets. Wintermute reported that 20-year-plus Treasuries fell 2.8%, while gold declined 3.8% despite the prevailing geopolitical backdrop. Brent crude rose 8.6%, leading the firm to conclude that “the only things that worked were the things causing the problem.”

    Bitcoin’s Price Action and Liquidation

    Bitcoin briefly surpassed $82,000 following the CLARITY Act vote but subsequently reversed sharply, closing Friday near $78,000, a 5.7% decrease for the week. The weekend slide towards $77,000 triggered $657 million in liquidations, including $584 million from long positions. Ethereum underperformed even more, falling 10.2% during the week.

    Wintermute noted that ETH continued to weaken in both spot and derivatives markets, with ETH/BTC trading at 0.0275, funding rates softening, and relative implied volatility increasing. The firm described ETH as the “wrong asset for this macro.”

    ETF Outflows and Institutional Selling

    ETF flows also turned negative. Bitcoin spot ETFs recorded $1 billion in outflows for the week, ending six consecutive weeks of inflows, while ETH ETFs saw $255 million in outflows. Wintermute cited Glassnode data indicating that institutions were “selling into strength,” with the seven-day moving average of net flows at negative $88 million per day, the weakest level since mid-February. “When leverage is the marginal buyer, the unwind is fast,” Wintermute wrote.

    Technical Outlook and Key Levels

    Bitcoin remains below its 200-day moving average near $82,200, having been rejected five times this month, according to Wintermute. The immediate support zone is between $76,000 and $78,000. A break below $75,000 could potentially lead to a decline towards the $70,000 to $72,000 range.

    Wintermute acknowledged the broader structural case for Bitcoin, noting that exchange reserves remain near multi-year lows, long-term holders continue to accumulate, and the CLARITY Act is progressing. The firm also highlighted that tokenized Treasuries reached $15 billion on-chain, identifying this segment as an area of continued growth.

    However, Wintermute emphasized that short-term flows are currently more significant than the structural narrative. “The flow data shows institutions used the rally to take profit rather than add, and in the short term that matters more than the structural story,” the firm wrote.

    The next test, according to the update, is whether Bitcoin can hold the $76,000 to $78,000 area through Nvidia earnings on Wednesday, May 20. A hold would “rebuild some confidence,” Wintermute said, but a break below $75,000 with funding resetting and ETF flows negative could bring the low $70,000s back into view quickly. At press time, BTC traded at $77,297.

  • ‏*   **XRP پس از مقاومت شدید در ۱.۵۰ دلار، به سمت ۱ دلار می‌رود؟**

    ‏* **XRP پس از مقاومت شدید در ۱.۵۰ دلار، به سمت ۱ دلار می‌رود؟**

    تلاش XRP برای حفظ یک ناحیه حیاتی
    در حالی که XRP در تلاش برای حفظ یک ناحیه حیاتی است، برخی از تحلیلگران به شاخص‌های کلیدی اشاره کرده‌اند که می‌توانند تعیین کنند آیا اصلاح اخیر موقتی است یا آغاز یک اصلاح عمیق‌تر.

    مقاومت حیاتی در برابر رالی XRP

    روز سه‌شنبه، XRP به روند نزولی اخیر خود ادامه داد و به محدوده ۱.۳۵ دلار رسید که پایین‌ترین سطح آن از اواخر آوریل است. این ارز دیجیتال در یک ماه گذشته بین ۱.۳۶ تا ۱.۵۰ دلار معامله شده و چندین بار تلاش کرده است از مرز بالایی عبور کند. هفته گذشته، این آلت‌کوین به دلیل پیشرفت قانون CLARITY، از این مقاومت کلیدی عبور کرد و به بالاترین سطح دو ماهه خود یعنی ۱.۵۴ دلار رسید. با این حال، قیمت به سرعت از این سطح رد شد و در پنج روز گذشته حدود ۱۲ درصد کاهش یافت.

    با آزمایش مجدد ناحیه ۱.۳۵ دلار توسط این آلت‌کوین، ناظر بازار ChartNerd اظهار داشت که XRP در معرض خطر اصلاح قیمت دیگری به سمت پایین‌ترین سطوح جدید است و تأیید کرد که “داده‌ها خود گویای همه چیز هستند”. این تحلیلگر به برخی از سیگنال‌های نگران‌کننده برای رالی این آلت‌کوین اشاره کرد، از جمله یک ناحیه مقاومت اصلی در بالا و تأیید تقاطع مرگ در شاخص RSI هفتگی Stoch. وی خاطرنشان کرد که میانگین‌های متحرک نمایی (EMA) ۲۰ و ۵۰ هفته‌ای، که در ۱.۵۰ و ۱.۸۰ دلار قرار دارند، دو سطح مقاومت حیاتی هستند که از زمان تقاطع آن‌ها در ژانویه ۲۰۲۶، که منجر به سقوط XRP به پایین‌ترین سطح خود در فوریه یعنی ۱.۱۱ دلار شد، دوباره آزمایش نشده‌اند. وی همچنین اشاره کرد که تقاطع RSI هفتگی Stoch قبلاً یک سقف محلی برای XRP را نشان داده است، به طوری که دو تقاطع آخر اصلاحات عمیق‌تری را ایجاد کرده و آخرین مورد با رالی تسکینی که منجر به تقاطع مرگ EMA هفتگی چهار ماه پیش شد، همزمان بوده است. پس از رالی اخیر به ۱.۵۴ دلار، قیمت اکنون برای اولین بار از زمان تقاطع ژانویه، EMA ۲۰ هفتگی را دوباره آزمایش کرده است. این تحلیلگر گفت که عدم موفقیت در عبور موفقیت‌آمیز از این سطح و تبدیل آن به یک حمایت پایدار “احتمالاً در اواخر سال جاری، گام بعدی به سمت پایین را باز خواهد کرد”.

    هدف “حرکت بزرگ بعدی” ۱ دلار است؟

    ChartNerd تأکید کرد که XRP باید هر دو EMA را بازیابد و آن‌ها را به حمایت تبدیل کند تا سناریوی نزولی را باطل کند، اما افزود که “هنوز احساس نمی‌کنم زمان مناسبی باشد”. حتی اگر این آلت‌کوین به سمت ۱.۸۰ دلار حرکت کند، این تحلیلگر معتقد است که قیمت احتمالاً نمی‌تواند آن را در بلندمدت حفظ کند و “حداقل به سمت پایین‌ترین سطوح دلاری باز خواهد گشت”. وی توضیح داده است که رد شدن از این EMA‌ها می‌تواند به طور بالقوه این آلت‌کوین را به سمت کف چرخه ۰.۷۰ دلار سوق دهد، زیرا این یک سطح مقاومت کلان قبلی است که هنوز دوباره آزمایش نشده است.

    در همین حال، تحلیلگر علی مارتینز تأیید کرد که XRP برای یک حرکت بزرگ قیمتی آماده است. وی خاطرنشان کرد که این آلت‌کوین در حال توسعه “فشرده‌ترین فشرده‌سازی باندهای بولینگر” در نمودار سه روزه در بیش از یک سال است و منطقه فشرده‌سازی فعلی را “منطقه عدم معامله قطعی” نامید. وی خاطرنشان کرد که وقتی نوسانات این‌گونه فشرده می‌شود، “این یک سیگنال است که یک انبساط قیمتی شدید در حال نزدیک شدن است”. بنابراین، ناظر بازار به سرمایه‌گذاران توصیه کرد که منتظر بسته شدن یک کندل سه روزه از محدوده فعلی XRP، بین ۱.۲۹ تا ۱.۵۰ دلار باشند تا جهت روند اصلی بعدی را تأیید کنند. بسته شدن بالای مرز بالایی نشان‌دهنده احتمال انبساط به سمت ۱.۸۰ دلار است. برعکس، شکست از مرز پایینی ساختار صعودی فوری را باطل می‌کند و در را برای یک اصلاح عمیق‌تر به سمت حمایت روانی ۱.۰۰ دلار باز می‌کند.

    تصویر ویژه از Unsplash.com، نمودار از TradingView.com.

  • ‏ریپل (XRP) از رِوُلت و پِرلِکسیتی در فهرست معتبر CNBC پیشی گرفت.

    ‏ریپل (XRP) از رِوُلت و پِرلِکسیتی در فهرست معتبر CNBC پیشی گرفت.

    فهرست به‌روزرسانی‌شده CNBC و جایگاه ریپل

    شبکه خبری CNBC فهرست به‌روزرسانی‌شده خود از ۵۰ شرکت برتر مختل‌کننده در سال ۲۰۲۶ را منتشر کرد که در این فهرست تنها یک شرکت مرتبط با بلاک‌چین یا ارزهای دیجیتال وجود دارد: ریپل.

    این شرکت که پشتوانه ارز دیجیتال XRP است، به‌عنوان «پول جدید» توصیف شده و در جایگاه شانزدهم شرکت‌های مختل‌کننده قرار دارد.

    شایان ذکر است که این اولین بار نیست که ریپل در این فهرست قرار می‌گیرد. در سال ۲۰۲۱، این شرکت در جایگاه سی‌وهشتم قرار داشت. از آن زمان، این شرکت به‌طور پیوسته پیشرفت کرده و رتبه‌بندی جدید که دیروز به‌روزرسانی شد، نشان می‌دهد که ریپل با توضیح مختصری از فعالیت خود، یعنی «پول جدید»، به جایگاه شانزدهم صعود کرده است.

    ریپل در مسیر صعود خود، از نام‌های برجسته‌ای مانند Samsara Eco، Canva، Carbon Robotics، Applied Intuition، Lila Sciences، Waabi، Revolut، Perplexity و WHOOP پیشی گرفته است. ریپل تنها شرکت یا پروژه از حوزه ارزهای دیجیتال/بلاک‌چین است که در این فهرست حضور دارد.

    تسلط هوش مصنوعی

    با توجه به رشد چشمگیر در بخش هوش مصنوعی، بخش بزرگی از شرکت‌های این فهرست از این صنعت هستند. در واقع، رهبر سال ۲۰۲۶ Anthropic است که به‌عنوان «شماره ۱ جدید هوش مصنوعی» توصیف شده است. OpenAI در رتبه بعدی قرار دارد و Databricks (زیرساخت شرکت‌های هوش مصنوعی) در جایگاه سوم است.

    «تسلط هوش مصنوعی به‌عنوان یک موضوع تغییر نکرده، بلکه تشدید شده و به‌طور فزاینده‌ای در ماهیت سنگین فهرست ۵۰ شرکت مختل‌کننده منعکس می‌شود. چهل و سه شرکت از ۵۰ شرکت حاضر در فهرست ۲۰۲۶، هوش مصنوعی را برای مدل‌های کسب‌وکار مختل‌کننده خود ضروری می‌دانند. کل بودجه در میان شرکت‌های مختل‌کننده ۲۰۲۶ به ۳۳۷ میلیارد دلار افزایش یافت که نسبت به ۱۲۷ میلیارد دلار در سال ۲۰۲۵، بیش از ۲.۵ برابر افزایش داشته است. کل ارزش ضمنی، که توسط مبالغ هنگفتی که توسط شرکت‌های برتر هوش مصنوعی جمع‌آوری می‌شود، منحرف شده، از ۷۹۸ میلیارد دلار به ۲.۴ تریلیون دلار افزایش یافت که تقریباً سه برابر نسبت به سال قبل است.»

    تحلیل‌های بازار و چشم‌انداز آینده ریپل

    اندکی پس از انتشار رتبه‌بندی به‌روزرسانی‌شده CNBC، Santiment Intelligence پستی را منتشر کرد که توضیح می‌داد چرا برخی از ارزهای دیجیتال در حال حاضر ترند شده‌اند. برای XRP، دلیل این امر «نقش بلندمدت آن در پرداخت‌های فرامرزی در مقابل جایگزینی توسط استیبل‌کوین‌ها یا مسیرهای جایگزین» عنوان شد.

    این شرکت تحلیلی اعلام کرد که بحث‌ها در Reddit بر روی اقدامات استراتژیک ریپل، مانند آزمایش‌های استیبل‌کوین مانند RLUSD، انتشار توکن، اکتساب‌ها و جمع‌آوری سرمایه، در برابر نگرانی‌ها در مورد پویایی عرضه، پذیرش سازمانی یا خروج و فروش احتمالی شرکتی متمرکز شده است.

  • XRP Faces Resistance After $1.50 Rejection, Possible Drop to $1.

    XRP Faces Resistance After $1.50 Rejection, Possible Drop to $1.

    XRP Struggles to Maintain Key Support as Analysts Weigh Potential Price Movements

    As XRP attempts to hold a critical support level, analysts are scrutinizing key indicators that could determine whether the recent price decline is temporary or the start of a more significant correction.

    Technical Indicators Signal Caution

    XRP continued its recent downward trend on Tuesday, falling to approximately $1.35, its lowest point since late April. The cryptocurrency has been trading between $1.36 and $1.50 for the past month, repeatedly attempting to break above the upper boundary. Last Thursday, the altcoin briefly surpassed this key resistance level, reaching a two-month high of $1.54, driven by developments related to the CLARITY Act. However, the price was quickly rejected from this level, resulting in a roughly 12% drop over the past five days.

    Market analyst ChartNerd observed that XRP risks further price correction towards new lows as the altcoin retests the $1.35 area, stating that “the data speaks for itself.” The analyst pointed to several concerning signals, including significant resistance levels above and the confirmation of a “death cross” on the weekly Stoch RSI.

    ChartNerd highlighted the weekly 20 and 50 EMAs, currently at $1.50 and $1.80, as crucial resistance levels that have not been retested since their January 2026 crossover, which preceded XRP’s decline to its February low of $1.11. He also noted that the weekly Stoch RSI crossover has historically marked local tops for XRP, with the last two crosses leading to deeper corrections. The most recent crossover coincided with the relief rally that preceded the weekly EMA death cross four months ago.

    Following the recent rally to $1.54, the price has now retested the weekly 20 EMA for the first time since the January crossover. ChartNerd suggested that failure to break above this level and establish it as sustained support “will likely open the next leg down later this year.”

    Potential Price Targets and Market Sentiment

    ChartNerd emphasized that XRP must reclaim both EMAs and convert them into support to invalidate the bearish outlook, but added that “it just doesn’t feel like the right time yet.” Even if the altcoin rallies towards $1.80, the analyst believes the price will likely fail to hold that level long-term and “at least come back to, at a minimum, fill in most of this wick back down towards the lower dollar levels.” He explained that a rejection from these EMAs could potentially push the altcoin towards a cycle bottom of $0.70, a previous level of macro resistance that has not yet been retested.

    Meanwhile, analyst Ali Martinez believes XRP is poised for a significant price movement. He noted that the altcoin has been developing the “tightest Bollinger Band squeeze” on the three-day chart in over a year, describing the current compression zone as a “definitive ‘no-trade zone.’” Martinez indicated that such tight volatility compression often precedes a “violent price expansion.” He advised investors to await a clear three-day candlestick close outside of XRP’s current range, between $1.29 and $1.50, to confirm the next major trend direction. A close above the upper boundary would likely signal an expansion towards $1.80. Conversely, a breakdown below the lower boundary would invalidate the immediate bullish structure and potentially lead to a deeper correction towards the $1.00 psychological support level.

  • Ripple (XRP) Tops Revolut, Perplexity in CNBC Ranking

    Ripple (XRP) Tops Revolut, Perplexity in CNBC Ranking

    CNBC recently released its updated list of the top 50 disruptive companies for 2026, with Ripple being the sole blockchain or crypto-related firm included.

    Ripple’s Ranking

    Ripple, the company associated with XRP, was designated as “new money” and ranked as the 16th most disruptive company. This marks a significant rise from its 38th position in 2021. The latest ranking, updated recently, reflects this upward trajectory.

    Competitive Landscape

    Ripple’s ascent has placed it ahead of several prominent companies, including Samsara Eco, Canva, Carbon Robotics, Applied Intuition, Lila Sciences, Waabi, Revolut, Perplexity, and WHOOP. Notably, Ripple is the only cryptocurrency or blockchain-focused entity on the list.

    AI Dominance

    The list is heavily influenced by the artificial intelligence sector, reflecting its significant growth. Anthropic leads the ranking, described as “AI’s new No 1,” followed by OpenAI and Databricks.

    “The domination of AI as a theme has not changed, but it has intensified and it is increasingly being reflected in the top-heavy nature of the Disruptor 50. Forty-three of the 50 companies in the 2026 list class say AI is essential to their disruptive business models. Total funding across the 2026 Disruptors rose to $337 billion, up from $127 billion in 2025 — an increase of more than 2.5x. Total implied valuation, skewed by the massive sums being raised by the top AI firms, climbed to $2.4 trillion from $798 billion, roughly tripling year over year.”

    Market Sentiment

    Following CNBC’s updated rankings, Santiment Intelligence analyzed the factors driving the current trends in certain cryptocurrencies. For XRP, the analysis cited its “long-term role in cross-border payments versus replacement by stablecoins or alternative rails.”

    The analytics firm also noted that discussions on Reddit have centered on Ripple’s strategic initiatives, such as stablecoin experiments like RLUSD, token issuance, acquisitions, and fundraising, alongside concerns about supply dynamics, institutional adoption, and potential corporate selling.

  • ‏سولانا وارد فاز نزولی شد، حمایت‌های کلیدی در خطر.

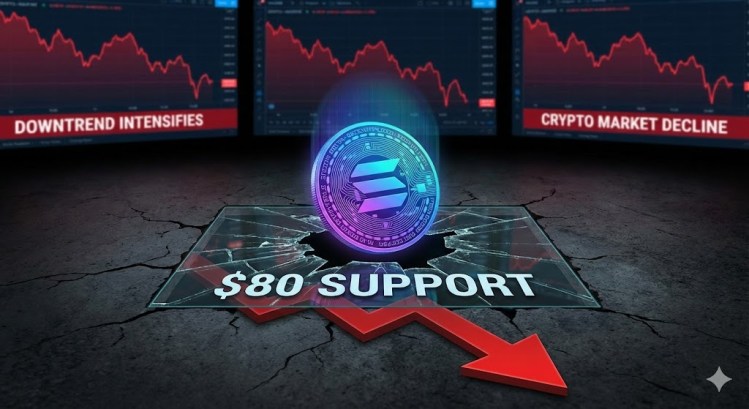
    ‏سولانا وارد فاز نزولی شد، حمایت‌های کلیدی در خطر.

    افت قیمت سُلانـا و تحلیل بازار
    سُلانـا نتوانست بالای ۹۲ دلار تثبیت شود و بیشتر سودهای خود را اصلاح کرد.

    قیمت SOL اکنون در حال تثبیت زیان‌های خود بالای ۸۴ دلار است و ممکن است تلاش دیگری برای افزایش داشته باشد. قیمت SOL یک کاهش جدید را زیر ۹۰ و ۸۸ دلار در برابر دلار آمریکا آغاز کرد. قیمت اکنون زیر ۸۷ دلار و میانگین متحرک ساده ۱۰۰ ساعته معامله می‌شود. یک خط روند نزولی در حال شکل‌گیری است که مقاومت آن در ۸۵ دلار در نمودار ساعتی جفت ارز SOL/USD (منبع داده از Kraken) قرار دارد. اگر خریداران از ۸۴.۰۰ یا ۸۲.۵۰ دلار دفاع کنند، قیمت می‌تواند یک موج بازیابی را آغاز کند.

    کاهش قیمت سُلانـا از ۹۴ دلار

    قیمت سُلانـا نتوانست بالای ۹۲ دلار پایدار بماند و یک کاهش جدید را آغاز کرد، درست مانند بیت‌کوین و اتریوم. SOL زیر سطوح ۹۰ و ۸۸ دلار کاهش یافت. فروشندگان حتی قیمت را به سمت ۸۳ دلار سوق دادند. یک کف در ۸۳.۳۵ دلار تشکیل شد و قیمت اکنون در حال تثبیت زیان‌ها است. قیمت همچنان علائم نزولی را زیر سطح اصلاح فیبوناچی ۲۳.۶٪ از حرکت نزولی از سقف نوسانی ۹۳.۶۳ دلار تا کف ۸۳.۳۵ دلار نشان می‌دهد. سُلانـا اکنون نزدیک ۸۵ دلار و میانگین متحرک ساده ۱۰۰ ساعته معامله می‌شود. علاوه بر این، یک خط روند نزولی در حال شکل‌گیری است که مقاومت آن در ۸۵ دلار در نمودار ساعتی جفت ارز SOL/USD قرار دارد. در سمت صعودی، مقاومت فوری نزدیک سطح ۸۵ دلار است. مقاومت اصلی بعدی نزدیک سطح ۸۵.۸۰ دلار است. مقاومت اصلی می‌تواند ۸۸.۵۰ دلار یا سطح اصلاح فیبوناچی ۵۰٪ از حرکت نزولی از سقف نوسانی ۹۳.۶۳ دلار تا کف ۸۳.۳۵ دلار باشد. بسته شدن موفقیت‌آمیز بالای منطقه مقاومت ۸۸.۵۰ دلار می‌تواند سرعت را برای افزایش پایدار دیگری تعیین کند. مقاومت کلیدی بعدی ۹۰ دلار است. هر گونه افزایش بیشتر ممکن است قیمت را به سمت سطح ۹۲ دلار سوق دهد.

    زیان‌های بیشتر در SOL؟

    اگر SOL نتواند از مقاومت ۸۸.۸۰ دلار فراتر رود، می‌تواند به حرکت رو به پایین خود ادامه دهد. حمایت اولیه در سمت نزولی نزدیک منطقه ۸۳.۵۰ دلار است. اولین حمایت اصلی نزدیک سطح ۸۲ دلار است. شکست زیر سطح ۸۲ دلار ممکن است قیمت را به سمت منطقه حمایت ۸۰ دلار سوق دهد. اگر بسته شدن زیر حمایت ۸۰ دلار وجود داشته باشد، قیمت می‌تواند در کوتاه‌مدت به سمت حمایت ۷۵ دلار کاهش یابد.

    شاخص‌های فنی

    • میانگین متحرک همگرایی-واگرایی ساعتی (MACD): MACD برای SOL/USD در حال افزایش سرعت در منطقه نزولی است.
    • شاخص قدرت نسبی (RSI) ساعتی: RSI برای SOL/USD زیر سطح ۵۰ است.
    • سطوح حمایت اصلی: ۸۳.۵۰ و ۸۲.۰۰ دلار.
    • سطوح مقاومت اصلی: ۸۵.۸۰ و ۸۸.۵۰ دلار.
  • ‏آیا جهش XRP در راه است؟ عبور از ۱.۵۰ دلار، جرقه صعودی قدرتمند را می‌زند.

    ‏آیا جهش XRP در راه است؟ عبور از ۱.۵۰ دلار، جرقه صعودی قدرتمند را می‌زند.

    ‏XRP در آستانه یک نقطه عطف حیاتی قرار دارد، زیرا نوسانات قیمت در محدوده تثبیت اصلی کاهش یافته و گمانه‌زنی‌ها مبنی بر نزدیک بودن یک جهش قیمتی را افزایش داده است. با افزایش تدریجی شتاب صعودی، تحلیلگران معتقدند که عبور قاطعانه از سطح مقاومت کلیدی ۱.۵۰ دلار می‌تواند یک رالی قدرتمند را به سمت اهداف بالاتر در جلسات آتی آغاز کند.

    سیگنال‌های فشرده‌سازی باندهای بولینگر، حرکت انفجاری را پیش‌بینی می‌کنند

    علی چارتز، تحلیلگر ارزهای دیجیتال، بر این باور است که XRP ممکن است در آستانه یک جهش بزرگ قرار داشته باشد، زیرا نوسانات در بازه‌های زمانی بالاتر همچنان در حال کاهش است. به گفته این تحلیلگر، باندهای بولینگر در نمودار ۳ روزه XRP، فشرده‌ترین حالت خود را در بیش از یک سال تجربه می‌کنند، شرایطی که اغلب پیش از یک گسترش شدید در نوسانات قیمت رخ می‌دهد.

    با وجود انتظارات فزاینده، او وضعیت فعلی را به عنوان یک منطقه بدون معامله توصیف کرد و تاکید کرد که معامله‌گران باید از اتخاذ موقعیت‌های زودهنگام خودداری کنند تا زمانی که بازار جهت بعدی خود را با یک جهش قاطعانه تایید کند. این تحلیلگر از نزدیک سطوح ۱.۵۰ و ۱.۲۹ دلار را برای تایید زیر نظر دارد. بسته شدن یک کندل ۳ روزه بالای ۱.۵۰ دلار، به احتمال زیاد یک رالی صعودی را به سمت هدف اصلی او در حدود ۱.۸۰ دلار آغاز می‌کند. چنین جهشی نشان می‌دهد که خریداران کنترل قوی بر شتاب را دوباره به دست آورده‌اند. از سوی دیگر، علی هشدار داد که بسته شدن زیر ۱.۲۹ دلار، ساختار صعودی فعلی را تضعیف کرده و احتمال اصلاح عمیق‌تر به سمت حمایت روانی کلیدی در نزدیکی ۱ دلار را افزایش می‌دهد. او تاکید کرد که صبر در شرایط فعلی همچنان حیاتی است و اشاره کرد که انتظار برای شکست باندهای بولینگر قبل از ورود به معاملات، یک فرصت خوب برای ریسک به ریوارد ارائه می‌دهد.

    XRP همچنان در داخل یک مثلث اصلاحی گسترده محبوس است

    XRP در حال حاضر در حال پیمایش یک ساختار مثلث اصلاحی گسترده پس از یک تلاش ناموفق برای جهش صعودی است. وبسایت More Crypto Online خاطرنشان کرد که این نوسانات قیمت اخیر فاقد ویژگی‌های ضربه‌ای لازم است و نشان می‌دهد که این دارایی در حال حاضر در یک محیط گسترده و محدود به دام افتاده است.

    سناریوی فنی ترجیحی، امکان توسعه مداوم این شکل‌گیری مثلث بزرگتر را فراهم می‌کند، که ممکن است در نهایت از یک حرکت صعودی دیگر به عنوان بخشی از یک موج C در حال توسعه پشتیبانی کند. بنابراین، خوشه‌های مقاومت اصلی در ۱.۵۵، ۱.۶۰ و ۱.۶۶ دلار قرار دارند که به عنوان سقف‌های احتمالی برای این حرکت عمل می‌کنند. در مقابل، یکپارچگی ساختاری این مثلث در صورت عبور قیمت از آستانه حمایت حیاتی ۱.۲۸ دلار به طور قابل توجهی تضعیف می‌شود. قبل از رسیدن به آن سطح، حمایت بعدی در حدود ۱.۳۰ دلار است و پس از آن یک منطقه نقدینگی عمیق‌تر بین ۱.۲۶ تا ۱.۱۶ دلار قرار دارد که به عنوان حمایت نهایی محدوده عمل می‌کند. XRP همچنان در داخل این محدوده اصلاحی در نوسان است. در حالی که یک گسترش صعودی همچنان یک احتمال است، بازار هنوز یک جهش قانع‌کننده و ضربه‌ای را نشان نداده است. با این وجود، بار اثبات بر عهده گاوها است تا یک تغییر روند قطعی را بالای سطوح مقاومت فعلی آغاز کنند.

    تصویر ویژه از Adobe Stock، نمودار از Tradingview.com.

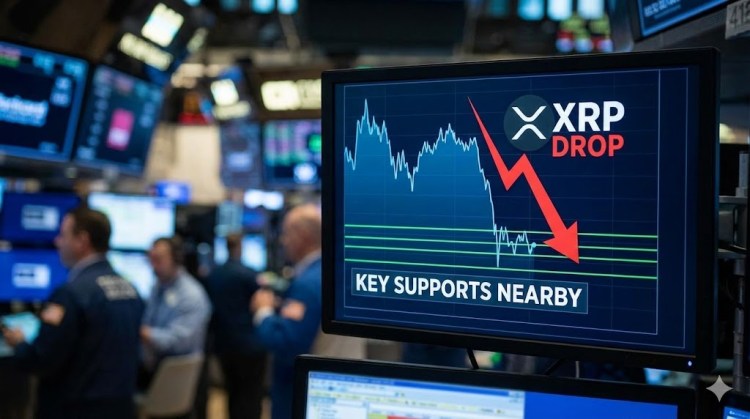
  • XRP Price Faces Further Downside Risk

    XRP Price Faces Further Downside Risk

    XRP Price Dips Below $1.40

    The price of XRP has continued its downward trend, trading below $1.40. The cryptocurrency is currently consolidating losses and facing resistance levels at $1.3650 and $1.3940.

    Technical Analysis

    XRP began another decline, falling below the $1.40 mark. It is now trading below $1.3880 and the 100-hourly Simple Moving Average. A bearish trend line is forming, with resistance at $1.3720 on the hourly chart of the XRP/USD pair, according to data from Kraken. The pair could continue to decline if it remains below $1.40.

    XRP failed to maintain its position above $1.4150 and extended its decline, mirroring the trends of Bitcoin and Ethereum. The price dropped below $1.4050 and $1.40, entering a short-term bearish zone and even extending losses below $1.380. A low of $1.3464 was established, and the price is currently consolidating losses well below the 23.6% Fibonacci retracement level of the downward move from the $1.5495 swing high to the $1.3464 low.

    The price is trading below $1.3880 and the 100-hourly Simple Moving Average. If a recovery occurs, the price may encounter resistance near the $1.3650 level. A bearish trend line is also forming, with resistance at $1.3720 on the hourly chart of the XRP/USD pair. The initial major resistance is near the $1.380 level, with the primary resistance at $1.3940. A close above $1.3940 could potentially push the price towards $1.40. The next hurdle is at $1.4250, which is also the 50% Fibonacci retracement level of the downward move from the $1.5495 swing high to the $1.3464 low. A clear move above the $1.4250 resistance could drive the price towards the $1.440 resistance, with further gains potentially leading to the $1.450 resistance.

    Potential for Further Losses

    If XRP fails to surpass the $1.40 resistance zone, a fresh decline could be triggered. Initial support on the downside is near the $1.3465 level, with the next major support near $1.3350. A break below $1.3350 could lead to a further decline towards $1.3220. The subsequent major support is near the $1.320 zone, below which the price could continue to fall towards $1.3120.

    Technical Indicators

    • Hourly MACD: The MACD for XRP/USD is gaining momentum in the bearish zone.
    • Hourly RSI (Relative Strength Index): The RSI for XRP/USD is currently below the 50 level.

    Key Levels

    • Major Support Levels: $1.3465 and $1.3350.
    • Major Resistance Levels: $1.3720 and $1.3940.
  • XRP Eyes Potential Rally Above $1.50

    XRP Eyes Potential Rally Above $1.50

    XRP Faces Critical Juncture Amidst Consolidation

    XRP is approaching a pivotal moment as its price action consolidates within a significant range, sparking speculation of an imminent breakout. With bullish momentum gradually building, analysts believe a decisive move above the key resistance level of $1.50 could trigger a substantial rally, potentially leading to higher targets in the coming sessions.

    Bollinger Band Squeeze Suggests Potential for Volatility

    Crypto analyst Ali Charts suggests that XRP may be on the verge of a major breakout, as volatility continues to tighten across higher timeframes. According to the analyst, the Bollinger Bands on XRP’s 3-day chart are experiencing their tightest squeeze in over a year, a condition often preceding a sharp expansion in price movement.

    Despite the growing anticipation, Ali Charts describes the current setup as a no-trade zone, advising traders to avoid premature positions until the market confirms its next direction with a decisive breakout. The analyst is closely monitoring the $1.50 and $1.29 levels for confirmation. A clear 3-day candlestick close above $1.50 would likely initiate an upward rally toward a primary target around $1.80, indicating that buyers have regained strong control of momentum.

    On the downside, Ali warns that a close below $1.29 would weaken the current bullish structure and increase the likelihood of a deeper correction toward the key psychological support near $1. He stresses the importance of patience, noting that waiting for the Bollinger Bands to break before entering trades offers a favorable risk-to-reward opportunity.

    XRP Remains Within a Broad Corrective Triangle

    XRP is currently navigating a broad, corrective triangle structure following a failed attempt at an upside breakout. More Crypto Online highlights that the recent price action lacks the necessary impulsive characteristics, suggesting the asset remains locked within a wide, range-bound environment.

    The preferred technical scenario allows for the continued development of this larger triangle formation, which may eventually support another move higher as part of a developing C-wave. Primary resistance clusters are located at $1.55, $1.60, and $1.66, serving as potential ceilings for the move. Conversely, the structural integrity of this triangle weakens significantly should the price breach the critical support threshold of $1.28. Before reaching that level, the next support is around $1.30, followed by a deeper liquidity zone situated between $1.26 and $1.16, which serves as the ultimate range support.

    XRP continues to oscillate within this corrective range. While an upside extension remains a possibility, the market has yet to demonstrate a convincing, impulsive breakout. The onus is on the bulls to initiate a definitive trend shift above current resistance levels.