Category: Uncategorized

  • PI Network Price Forecast for the Week

    PI Network Price Forecast for the Week

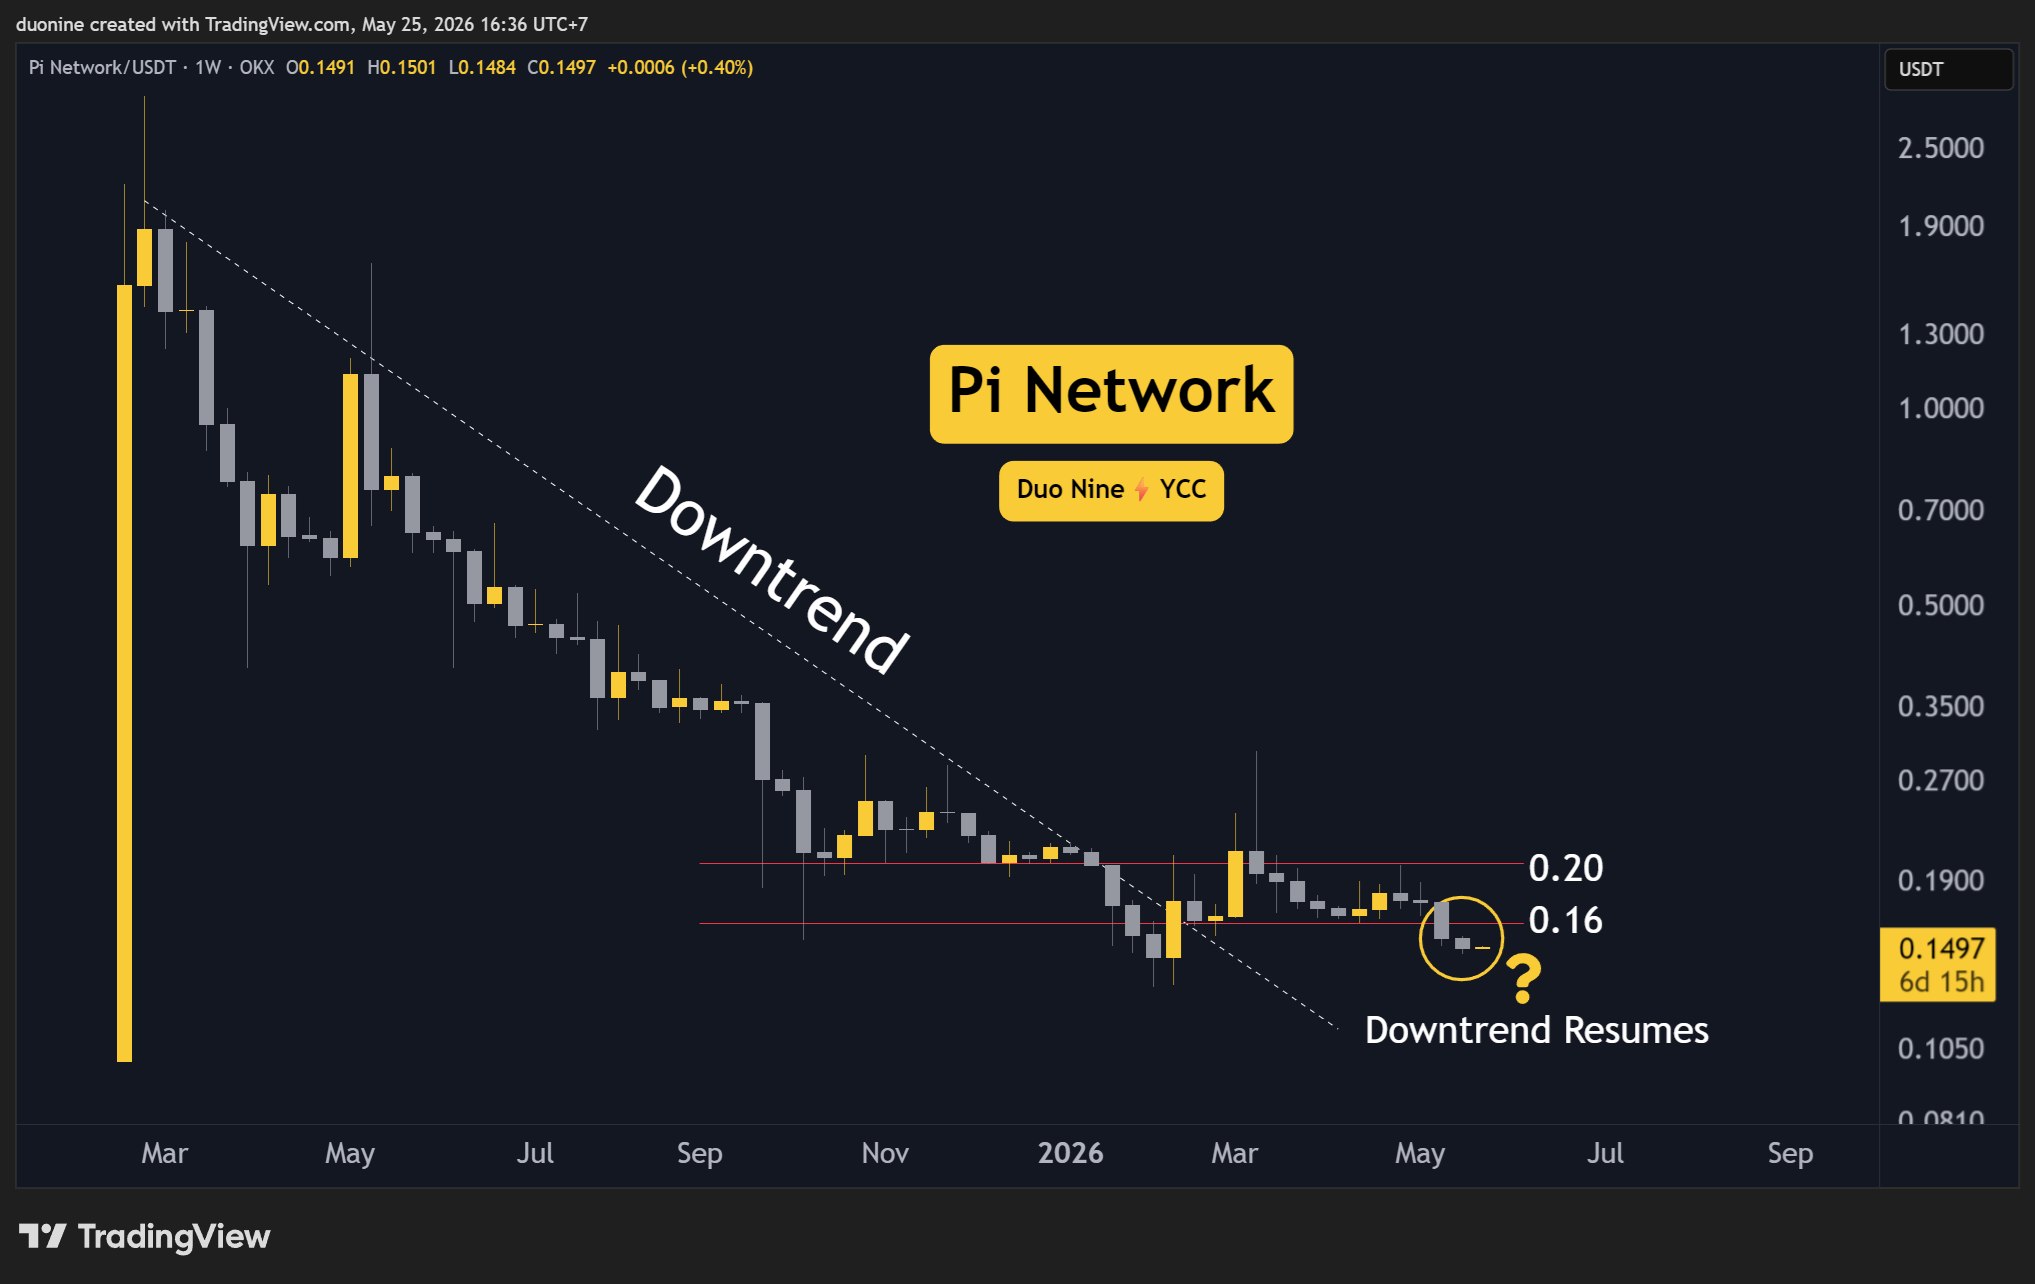
    Support at $0.15 Tested for Pi Network

    Key Support Levels: $0.15, $0.13
    Key Resistance Levels: $0.16, $0.20

    Following the loss of support at $0.16, the price of Pi Network (PI) quickly fell to $0.15, where some buying interest has emerged. However, it remains uncertain whether this support level will hold. A stronger support level is seen at $0.13, which has previously prevented further declines.

    With this recent breakdown, sellers have regained control, potentially driving PI lower, even as buyers attempt to halt the downtrend. This is notable given that PI has already corrected by 96% from its all-time high.

    Despite the current advantage for sellers, their trading volume remains low, creating lower highs. This suggests a lack of strong conviction or limited interest in pushing PI’s price significantly lower.

    If the $0.15 support level holds, buyers could attempt to reclaim $0.16 and regain momentum, potentially reversing the recent losses since the price action turned bearish.

    The 3-day Moving Average Convergence Divergence (MACD) continues to fall to new lows, as indicated by its histogram. While this is bearish, it is occurring with decreasing sell volume. This could be interpreted as a bullish divergence, suggesting a potential reversal.

    If the MACD histogram flattens this week, it would signal that sellers are losing control of the price, potentially leading to a relief rally.

  • Ripple (XRP) Price: Three Key Factors to Watch

    Ripple (XRP) Price: Three Key Factors to Watch

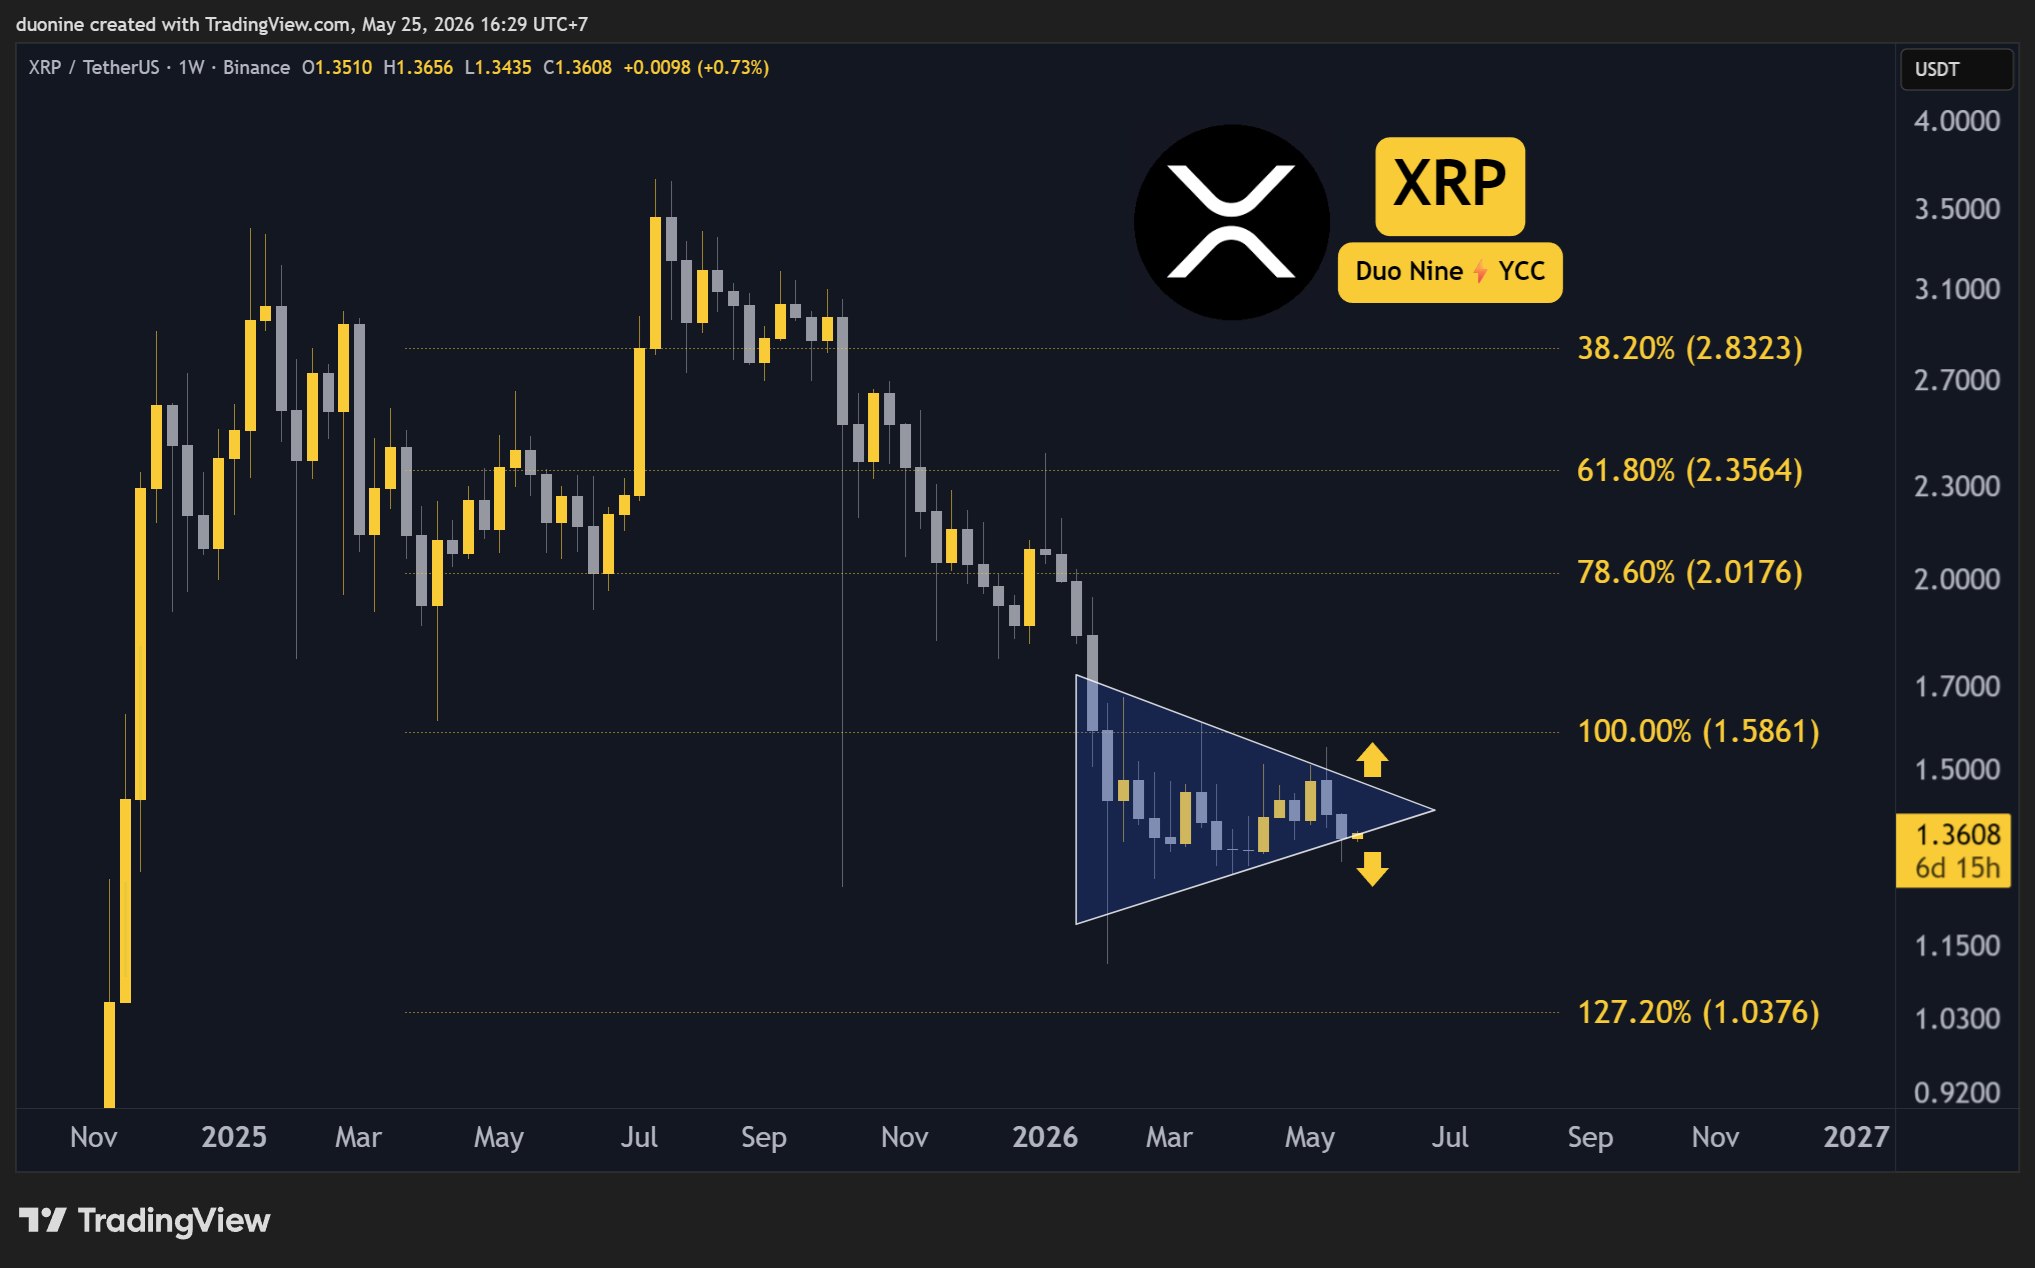
    XRP Attempts to Regain $1.4 Support

    Key support levels: $1.2, $1
    Key resistance levels: $1.4, $1.6, $2

    In a notable shift, the price of XRP has reversed course after exiting a blue pennant formation and is now attempting to reclaim the $1.4 support level. A successful recapture of this level would signal a bullish reversal.

    Halting the Downtrend

    Amidst the ongoing struggle between buyers and sellers, XRP has managed to temporarily halt its downtrend. The price has also established a higher low, which is another positive indicator.

    Seller Exhaustion

    The price decline from $1.6 to $1.3 was swift, with no periods of respite. Sellers were highly active, but they now appear to be losing momentum. Since the price touched $1.3, the selling volume has diminished, and buyers are re-entering the market.

    Potential for Recovery

    This shift positions the price favorably for recovering some of its recent losses. This recovery could be further strengthened if buyers successfully reclaim the $1.4 support level, potentially establishing a solid foundation for a retest of the next resistance level at $1.6.

    RSI Indicators

    The 4-hour Relative Strength Index (RSI) has already bottomed out and is demonstrating clear higher highs and higher lows. The RSI moving average is also trending upward. If bulls can sustain this buying pressure and volume, the RSI is likely to remain above 50 and potentially reach 70, which would indicate a strong uptrend.

    If the initial days of this week close in the green, the cryptocurrency has a strong possibility of breaking out from the pennant, with $1.6 as a key target for its rally.

  • XRP Liquidity on Exchanges Hits Lowest Point Since 2020

    XRP Liquidity on Exchanges Hits Lowest Point Since 2020

    XRP Price Outlook: Exchange Liquidity Lowest Since 2020

    XRP’s price is signaling potential volatility as the exchange liquidity index for XRP has fallen to its lowest level since 2020, indicating a significant structural shift.

    Market Dynamics

    The tightening supply of XRP is evident in declining exchange reserves and increased holdings by large investors, raising concerns about a potential liquidity crisis. This development coincides with a drop in XRP spot volume on Binance following recent market downturns. The price of XRP has fallen to $1.35, representing a 2% decrease this week.

    The combination of thin liquidity and the ongoing discussion surrounding a potential Exchange Traded Fund (ETF) creates conditions that could lead to significant price fluctuations.

    Technical Analysis

    XRP is currently consolidating below its recent high of $1.50, struggling to maintain its position within the upper range of its weekly trading band. Support levels are clustered around $1.31, which marks the lower boundary of the seven-day trading range.

    Momentum indicators are mixed. The 0.5% daily price drop is mirrored by stagnation in futures activity and at the exchange level. These factors have been highlighted as contributing to market instability in recent weeks, and data from Binance confirms that this pattern is intensifying.

    Potential Scenarios

    Three potential scenarios could unfold in the near term:

    • Bull Case: Increased speculation regarding ETF approval could drive XRP to retest $1.50. DeepSeek’s AI model projects a price target of $5 by late 2025 if institutional adoption accelerates.
    • Base Case: Consolidation continues within the $1.30-$1.40 range as the market awaits a catalyst, such as the Clarity Act.
    • Bear Case: Deteriorating liquidity could accelerate, widening spreads and potentially pushing the price towards the $1.31 support level.

    The ETF flow dynamic remains a key factor to monitor in the coming months.

    Infrastructure Solutions

    XRP’s low liquidity highlights a broader structural issue affecting multiple assets. Fragmented liquidity across different blockchain networks contributes to the price distortions currently observed in XRP. For traders, the underlying infrastructure becomes a crucial aspect of their investment strategy.

    LiquidChain ($LIQUID) is a Layer 3 infrastructure project designed to address this issue. Its Unified Liquidity Layer integrates liquidity from Bitcoin, Ethereum, and Solana into a single execution environment.

    With LiquidChain, developers can deploy applications once and access all three ecosystems simultaneously. Its Single-Step Execution and Verifiable Settlement features aim to eliminate the multi-step bridging processes that contribute to liquidity fragmentation.

    The LiquidChain presale has surpassed $800,000, with the current price of $0.01463 per $LIQUID. Capital is increasingly flowing into on-chain infrastructure projects as the $1 million milestone approaches.

  • Whale Dumps $9 Million in HYPE, More Sales Expected

    Whale Dumps $9 Million in HYPE, More Sales Expected

    HYPE’s price has experienced a significant surge over the past week, increasing by 40% and reaching a new all-time high above $64.

    Profit-Taking Slows Rally

    The rally appears to have slowed in the last 24 hours, with some investors opting to take profits rather than pursue further gains. HYPE climbed from below $40 to over $64 in the past few weeks, marking the most impressive rally in the crypto market during that period. This surge added billions of dollars to Hyperliquid’s total market capitalization and was driven by increased trading volume and substantial interest.

    Whale Activity Signals Shift

    As anticipated, the rally has begun to slow as some investors seek to realize profits. The on-chain analytics account Lookonchain identified a wallet that sold 151,574 HYPE, valued at $9.25 million, a few hours ago. The trader has also placed limit sell orders for an additional 170,000 HYPE, worth approximately $10.6 million, at prices between $63.45 and $70.55.

    Market Position and ETF Performance

    At the time of this report, HYPE is the 11th-largest cryptocurrency project by total market capitalization, estimated at around $15 billion. The altcoin is undoubtedly the best-performing large-cap crypto this week, and its price surge has brought it close to surpassing Dogecoin for the 10th position.

    HYPE-based spot exchange-traded funds are also experiencing a surge in assets under management, contrasting with a generally declining market. While Bitcoin ETFs saw over a billion dollars in AUM outflows, HYPE attracted more than $70 million, according to CryptoPotato.

  • XRP Holds Support, Eyes Next Rally

    XRP Holds Support, Eyes Next Rally

    XRP Price Consolidates After Correction

    The price of XRP has begun a downward correction from the $1.3750 zone. Currently consolidating, the cryptocurrency could attempt another increase if it remains above $1.3280.

    Technical Analysis

    XRP initiated a downside correction after failing to sustain its position above $1.3720. The price is now trading above $1.350 and the 100-hourly Simple Moving Average. A bearish trend line is forming, with resistance at $1.3650 on the hourly chart of the XRP/USD pair, according to data from Kraken. The pair could initiate a fresh increase if it settles above $1.3750.

    Support Levels

    XRP experienced a notable upward movement, surpassing $1.3250 and $1.3280, outperforming both Bitcoin and Ethereum. The price gained momentum, breaking above the $1.370 resistance. A high of $1.3741 was reached before a downside correction began. The price subsequently fell below $1.3450 and $1.3420, dipping below the 50% Fibonacci retracement level of the upward move from the $1.3001 swing low to the $1.3741 high. Currently, the price is trading above $1.350 and the 100-hourly Simple Moving Average.

    Resistance Levels

    If the price resumes its upward trajectory, it may encounter resistance near the $1.3650 level, coinciding with a bearish trend line on the hourly chart. The primary resistance level is near $1.3740, with a potential rise to test $1.3880 if surpassed. Further gains could lead to a test of the $1.40 resistance, with the next major hurdle for bulls potentially near $1.450.

    Potential Downside

    If XRP fails to break through the $1.3740 resistance zone, a fresh decline could occur. Initial support on the downside is near $1.3370. The next significant support levels are near $1.3280 and the 61.8% Fibonacci retracement level of the upward move from the $1.3001 swing low to the $1.3741 high. A break and close below $1.3280 could lead to a further decline towards $1.3175, with the next major support zone near $1.3120. Further losses could see a test of $1.30.

    Technical Indicators

    The Hourly MACD for XRP/USD is gaining momentum in the bullish zone. The Hourly RSI (Relative Strength Index) for XRP/USD is currently above the 50 level.

    Major Support Levels: $1.3370 and $1.3280.

    Major Resistance Levels: $1.3650 and $1.3740.

  • Dogecoin Rally Stalls at Resistance

    Dogecoin Rally Stalls at Resistance

    Dogecoin (DOGE) has initiated a recovery, surpassing the $0.10 mark against the US Dollar. However, the cryptocurrency is now encountering resistance near $0.1050 and may face challenges in sustaining further gains.

    Price Analysis

    DOGE began its recovery from $0.10, climbing above $0.1020. The price is currently trading below $0.1035 and the 100-hourly simple moving average. A bearish trend line is forming, with resistance at $0.1030 on the hourly chart of the DOGE/USD pair, according to data from Kraken. The price could continue its upward movement if it remains above $0.10.

    Resistance Levels

    Dogecoin’s price, mirroring movements in Bitcoin and Ethereum, initiated a recovery from the $0.10 zone. DOGE surpassed resistance levels at $0.1015 and $0.1020. A notable upward move occurred above the 50% Fibonacci retracement level, calculated from the decline between the $0.1066 swing high and the $0.0968 low. However, the price struggled near $0.1045. A bearish trend line is also forming, with resistance at $0.1030 on the hourly chart of the DOGE/USD pair.

    Currently, Dogecoin is trading below $0.1035 and the 100-hourly simple moving average. Immediate resistance on the upside is near $0.1030. The first significant resistance for bulls could be near $0.1042, coinciding with the 76.4% Fibonacci retracement level of the downward move from the $0.1066 swing high to the $0.0968 low. The next major resistance is near $0.1050. A close above $0.1050 could potentially push the price towards the $0.1085 resistance level. Further gains might lead to a test of the $0.1120 level, with $0.1150 as the next potential target for bulls.

    Potential Downturn

    If DOGE fails to break above $0.1050, a continued decline is possible. Initial support on the downside is near $0.1005, followed by the $0.10 level. The primary support level is at $0.0980. A break below $0.0980 could trigger a further price decrease, potentially leading to a drop towards $0.09650 or even $0.0950 in the short term.

    Technical Indicators

    The hourly Moving Average Convergence Divergence (MACD) for DOGE/USD is currently gaining bullish momentum. The hourly Relative Strength Index (RSI) for DOGE/USD is above the 50 level.

    Major support levels are at $0.1005 and $0.1000. Major resistance levels are at $0.1050 and $0.1120.

  • Bitcoin ETFs See $1.25B Outflow Amid Surging Chip ETF Interest

    Bitcoin ETFs See $1.25B Outflow Amid Surging Chip ETF Interest

    Last week, crypto-related exchange-traded funds experienced significant outflows, while a memory chip ETF rapidly gained assets, becoming one of the fastest-growing funds in history.

    Crypto ETF Outflows

    Bitcoin’s price saw minimal gains during the period, increasing by only 0.6%. Many altcoins mirrored this performance, with a few exceptions, such as Hyperliquid’s HYPE, which surged approximately 40%.

    From May 18 to May 22, spot Bitcoin ETFs recorded net outflows of $1.257 billion, according to data from Farside Investors. This indicates a shift in investor sentiment. Ethereum-based ETFs also faced challenges, with net outflows of around $216 million during the same period. This pullback suggests investors may be taking profits, reducing risk, or reallocating capital to other sectors.

    However, not all crypto-related ETFs suffered. Spot SOL ETFs attracted slightly over $15 million in net inflows, while spot XRP ETFs brought in $22 million. HYPE funds saw even stronger demand, attracting $72.38 million in net inflows, which correlated with the token’s price increase.

    These fund flows suggest that while Bitcoin and Ethereum faced selling pressure, investors are still investing in the broader crypto market, focusing on select altcoins.

    Memory Chip ETF’s Rapid Growth

    The Memory ETF, trading under the ticker DRAM, has become the fastest-growing exchange-traded fund in history. Launched on April 2, it accumulated over $6.5 billion in assets within just 27 trading sessions. This surpassed the previous record held by the BlackRock IBIT Bitcoin ETF, which took 30 trading sessions to reach the same level.

    Since its launch, DRAM has surged by over 84% and surpassed $10 billion in assets within 30 trading sessions. This has also positioned it among the top 10 US ETFs by year-to-date inflows out of more than 5,000 listed funds.

    The DRAM ETF’s rapid growth demonstrates increasing investor interest in memory chips. It is now among the top 20 most traded ETFs by volume, indicating that the memory chip and AI infrastructure trade is gaining significant momentum on Wall Street.

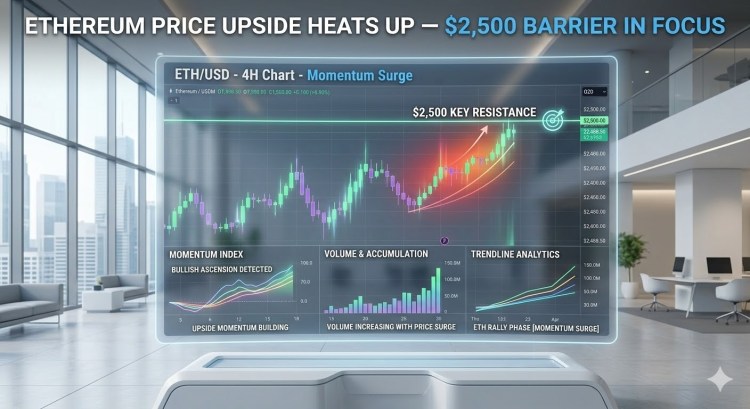
  • Ethereum Price Gains Bullish Momentum

    Ethereum Price Gains Bullish Momentum

    Ethereum Price Correction

    Ethereum’s price has begun a downward correction from $2,150. To resume its upward trajectory, ETH must surpass resistance levels at $2,120 and $2,150. The cryptocurrency has retreated below the $2,125 zone and is currently trading above $2,100 and the 100-hourly Simple Moving Average.

    A bearish trend line is forming, with resistance at $2,110 on the hourly chart of ETH/USD, according to data from Kraken. The pair could continue to decline if it remains below the $2,150 zone.

    Support Levels Hold

    Ethereum failed to maintain its position above the $2,145 zone, mirroring Bitcoin’s decline. The price of ETH subsequently fell below the $2,120 and $2,110 levels. Bears pushed the price below the 38.2% Fibonacci retracement level, calculated from the upward movement between the $2,001 swing low and the $2,147 high. However, bulls have been active near the $2,065 level.

    The hourly chart of ETH/USD also shows a bearish trend line forming, with resistance at $2,110. Ethereum is currently trading above $2,100 and the 100-hourly Simple Moving Average. If bulls maintain their activity above $2,065, the price may attempt another increase.

    Immediate resistance is observed near $2,110, with the first key resistance near $2,140. The next significant resistance level is near $2,150. A decisive move above the $2,150 resistance could potentially drive the price towards the $2,220 resistance level. A break above $2,220 might lead to further gains in the coming days, potentially pushing Ether towards the $2,250 resistance zone or even $2,320 in the near term.

    Potential for Further Decline

    If Ethereum fails to overcome the $2,110 resistance, a fresh decline could be initiated. Initial support on the downside is near the $2,075 level. The first major support is situated near the $2,055 zone, coinciding with the 61.8% Fibonacci retracement level of the upward move from the $2,001 swing low to the $2,147 high. A clear break below the $2,055 support could push the price towards the $2,020 support level. Further losses might lead to a test of the $2,000 region, with the main support potentially at $1,940.

    Technical Indicators

    The Hourly MACD for ETH/USD is gaining bullish momentum. The Hourly RSI for ETH/USD is currently above the 50 zone.

    Major Support Level: $2,055
    Major Resistance Level: $2,150

  • ChatGPT Adds Bitcoin, XRP, and Crypto Purchases Through MoonPay

    ChatGPT Adds Bitcoin, XRP, and Crypto Purchases Through MoonPay

    MoonPay Integrates Crypto Purchases Directly into ChatGPT

    MoonPay has integrated cryptocurrency purchases directly into ChatGPT, enabling users to generate checkout links to buy digital assets, including Bitcoin, XRP, Solana, and USDC, without leaving OpenAI’s chatbot.

    Direct Crypto Purchases

    On Friday, MoonPay launched a dedicated app within ChatGPT Apps, allowing users to purchase cryptocurrencies directly within OpenAI’s chatbot. MoonPay joins a growing list of crypto-related apps on ChatGPT, including Kraken, OKX, CryptoAudit, and RealOpen.

    While other apps in the ChatGPT store allow users to query blockchain data and prices, the MoonPay app allows users to purchase crypto directly, with the aim of educating consumers in the process.

    “We’ve seen this with commerce and AI, where a lot of people get shopping recommendations within ChatGPT,” said Kevin Arifin, MoonPay Blockchain Engineer and Product Lead. “Now people are starting to do financial research within ChatGPT as well, and it’s always been surprising to me that there hasn’t been an on-ramp where you could buy crypto within ChatGPT.”

    Within the app, users can ask ChatGPT about their preferred cryptocurrency and then request the chatbot to purchase a specified amount. ChatGPT will generate a MoonPay checkout link that directs the user to the MoonPay website to complete the Know-Your-Customer (KYC) process and link their wallet.

    “It’s like a broker that sits by you, not making financial recommendations, but educating you about the asset you’re buying. [It] makes ChatGPT the perfect place for that,” Arifin said. “Right now, this is just giving you the buy link to check out, similar to Shopify, but longer-term we’re going to see ChatGPT or these types of LLMs take more actions instead of just giving you that checkout link.”

    If a user has already completed KYC to set up their MoonPay account, they will not need to repeat the process.

    “You just sign in with your existing MoonPay account,” he said. “It’ll show that you’re signed in, pay with your last payment method, and then deliver it to this address.”

    Broader AI Initiatives

    The ChatGPT app is part of a broader push by MoonPay into AI-driven crypto tools.

    Earlier this month, the company acquired AI trading startup Dawn Labs and launched Dawn CLI, a trading copilot that translates plain-English prompts into automated prediction market strategies. MoonPay also recently launched the MoonAgents Card, a virtual Mastercard that allows AI agents to spend stablecoins directly from crypto wallets at online merchants.

    Arifin stated that the app is designed less for autonomous AI trading and more for helping mainstream consumers learn how crypto works through conversation.

    “Being able to talk in ChatGPT is a huge unlock,” he said. “I think that’s what’s been lacking overall.”

    Despite the convenience, Arifin acknowledged that users operating solely within ChatGPT are effectively confined to OpenAI’s ecosystem and the interfaces it chooses to expose. He sees emerging AI clients like OpenClaw and Hermes—where AI agents can run locally and interact more directly with a user’s machine—as an important next step.

    According to Arifin, ChatGPT and other chatbots are a growing entry point for crypto adoption.

    “These apps, whether it’s ChatGPT, Claude—they’re the new front door of the internet,” Arifin said. “It’s where people not just do that Google search to find out something, they do multiple turns of research to really understand what they’re trying to do.”
  • Solana Activity Surges Despite SOL’s Q1 Dip

    Solana Activity Surges Despite SOL’s Q1 Dip

    Solana Network Activity Surges Despite Price Dip

    Solana’s native token, SOL, experienced a 33% decline in the first quarter of 2026, closing at approximately $83. However, Messari’s Q1 State of Solana report paints a more nuanced picture, highlighting significant network activity despite the price drop.

    While dollar-denominated metrics decreased across the board, the Solana network achieved record-breaking daily transaction volumes, saw its real-world asset market capitalization surpass $2 billion, and maintained relatively stable validator revenue.

    Record-Breaking Transaction Volume

    The report’s key finding was a new all-time high for average daily non-vote transactions, reaching 112.6 million. This figure represents a 50% increase from the previous quarter and surpasses the previous record set in Q2 2025 by 15%. This indicates that the Solana network processed more transactions daily in Q1 than at any other point in its history, contrasting with the price decline. Meanwhile, Chain GDP, Messari’s term for total application revenue, remained nearly flat at $342.2 million, slightly above Q4 2025’s $341.8 million.

    Revenue Highlights and Volatility

    According to the report, Pump.fun remained the largest single revenue source, generating $124.7 million, a 17% increase quarter-over-quarter. Axiom, a trading app, followed in second place, recording a 36% jump to $42.4 million.

    The most significant growth was observed with Bags, a launchpad that allows users to share trading fees with social media accounts. Its revenue surged by 1,347% to $11.5 million, driven by intense trading activity in meme coins tied to open-source AI projects in January. However, this momentum proved short-lived, with Bags’ revenue dropping 85% month-over-month in February, illustrating the rapid turnover of activity within Solana’s application layer.

    DeFi and Real-World Assets

    Decentralized Finance (DeFi) Total Value Locked (TVL) decreased by 22% quarter-over-quarter to $6.16 billion, mirroring SOL’s price decline rather than reflecting a significant user outflow. Solana’s share of total DeFi TVL remained relatively stable, decreasing from 6.9% to 6.7%. Kamino surpassed Jupiter to become the leading protocol, with $1.72 billion in TVL compared to Jupiter’s $1.69 billion.

    Drift’s performance was impacted by a $285 million exploit attributed to a sophisticated social engineering operation linked to North Korean state-affiliated threat actors.

    The report also revealed that Real Economic Value, which represents fees and Miner Extractable Value (MEV) tips paid to validators, decreased by only 1% to $89.5 million. This placed Solana second among all networks, behind Hyperliquid’s $156 million.

    A defining trend of Q1, beyond the bear market, was the growth of real-world assets. The market on Solana saw its value increase by 43% quarter-over-quarter to $2.01 billion.

    BlackRock’s BUIDL tokenized money market fund doubled to $525.4 million after Anchorage Digital added custody support, with Anchorage holding approximately 81% of the total on-network supply by the end of the quarter.

    Ondo Finance launched over 200 tokenized US stocks and ETFs on Solana, including a same-day tokenization of BitGo stock on the date of the company’s NYSE IPO.

    Stablecoin Market Dynamics

    While the stablecoin market capitalization on the platform remained just under $15 billion, its composition shifted. USDC decreased by 21% to $7.83 billion but still accounts for 53% of the total. USDT increased by 34% to $2.89 billion.

    World Liberty Financial’s USD1 experienced a 473% surge to $883.5 million, largely due to Binance reallocating customer holdings to Solana.