Blog

  • پیش‌بینی قیمت شبکه پای با رشد ۱۰ درصدی پای در ۲۴ ساعت گذشته

    پیش‌بینی قیمت شبکه پای با رشد ۱۰ درصدی پای در ۲۴ ساعت گذشته

    شبکه پای (PI) پس از سقوط ۴۰ درصدی، ۱۰ درصد جهش کرد؛ آیا کف قیمت زده شده است؟

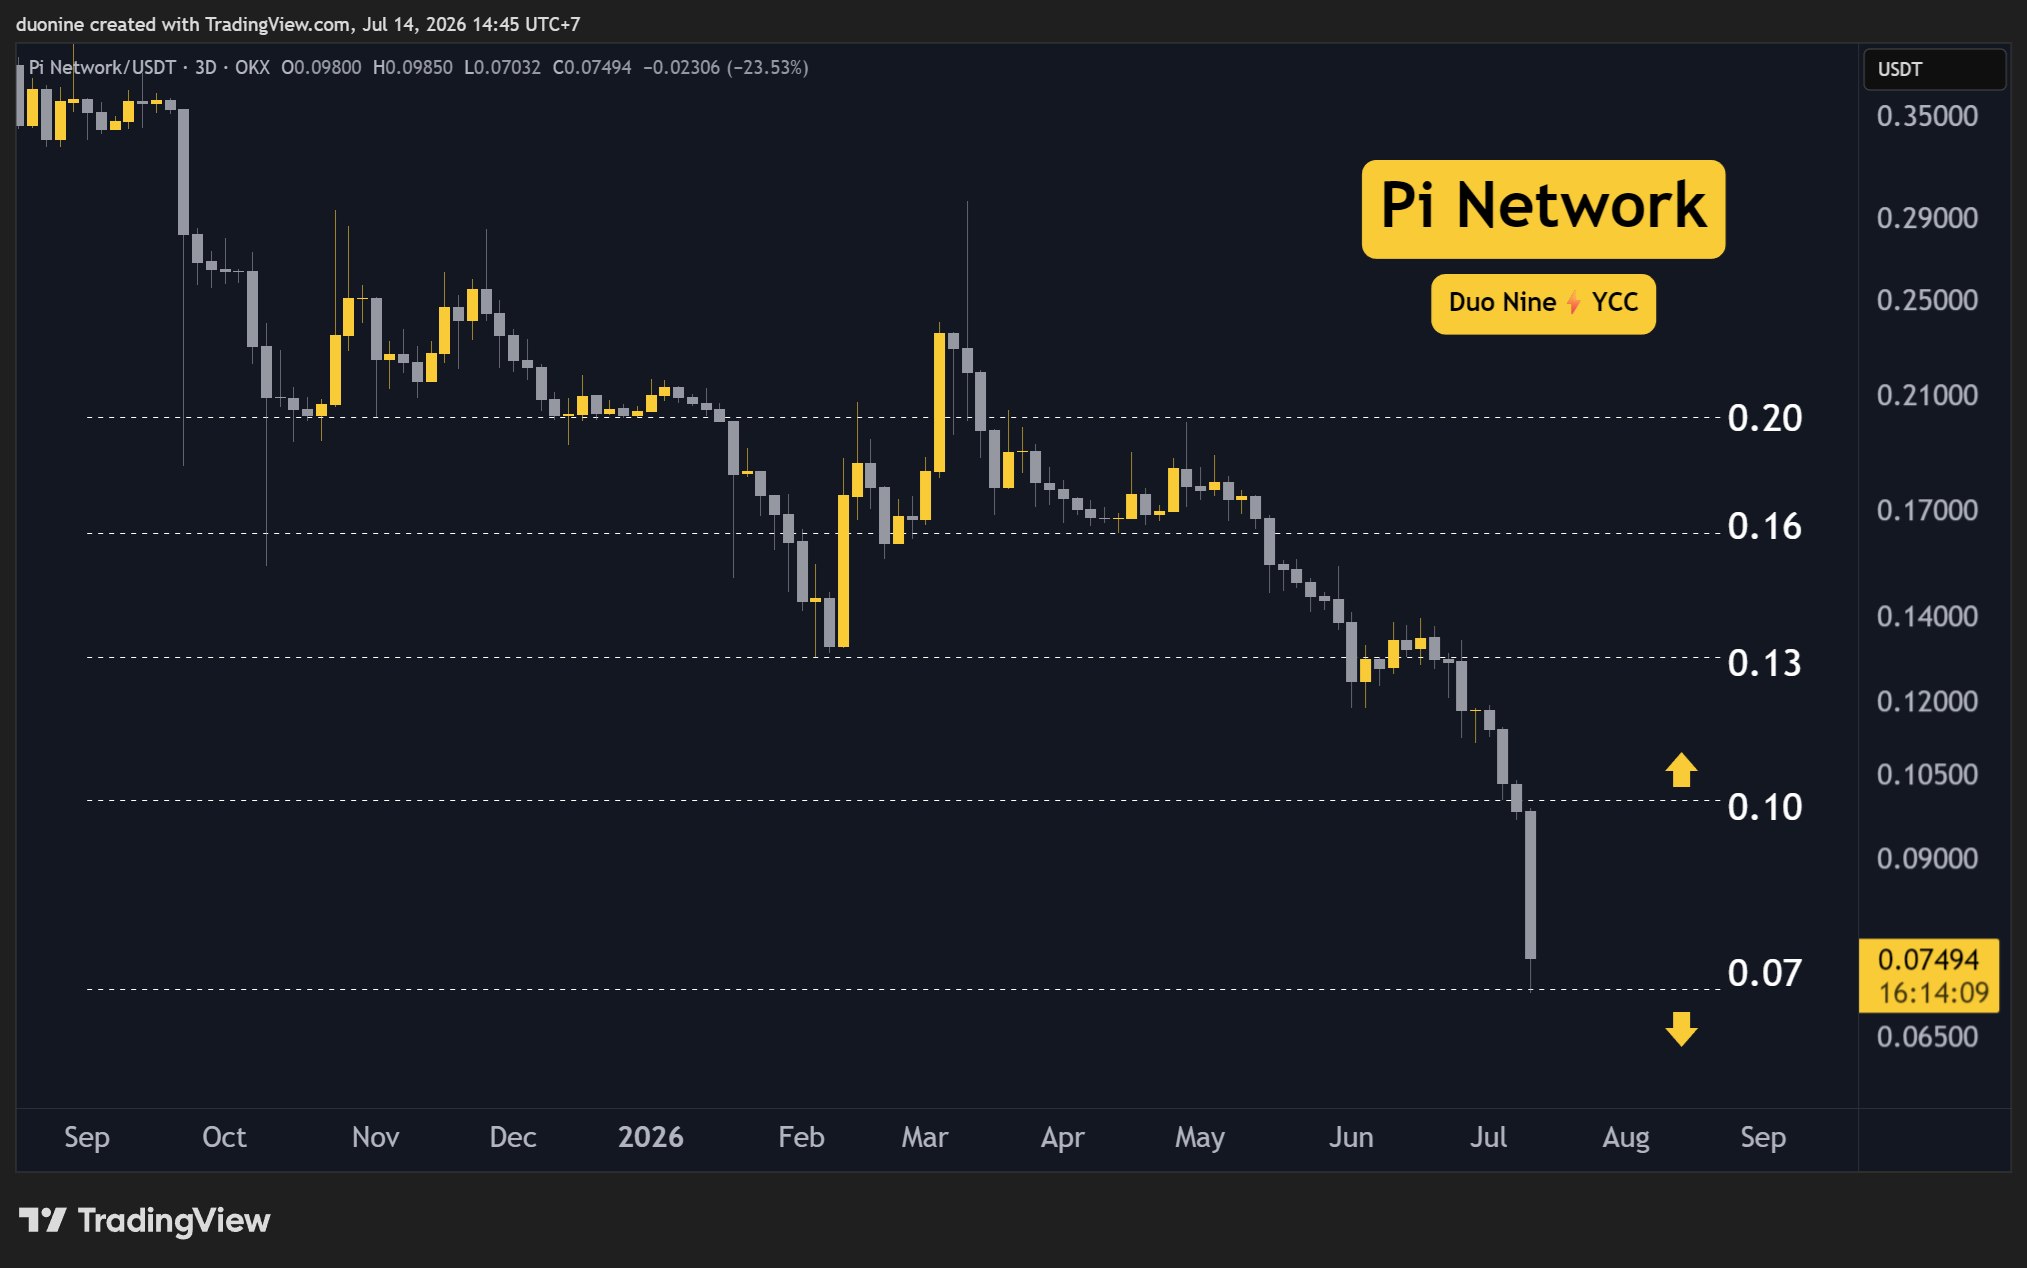
    ارز دیجیتال پای (PI) در هفته جاری شاهد سقوط ۴۰ درصدی بود که آن را به پایین‌ترین سطوح تاریخی متوالی رساند. با این حال، از آن زمان تاکنون ۱۰ درصد جهش کرده است و این پرسش را مطرح می‌کند که آیا کف قیمت زده شده است.

    سطوح کلیدی حمایت و مقاومت:

    • حمایت کلیدی: ۰.۰۷ دلار
    • مقاومت‌های کلیدی: ۰.۱۰ دلار، ۰.۱۳ دلار، ۰.۱۶ دلار

    سقوط به سطوح بی‌سابقه

    شبکه پای (PI) یکی از بدترین هفته‌های خود را در سال ۲۰۲۶ تجربه کرد، زیرا قیمت حمایت خود را در سطح ۰.۱۰ دلار از دست داد. با تبدیل این سطح به مقاومت، فروشندگان هجوم بردند و قیمت را به سمت ۰.۰۷ دلار سقوط دادند که به پایین‌ترین رکورد جدید آن تبدیل شد.

    احساسات نزولی شدید

    با از بین رفتن اعتماد، خریداران نیز ناپدید شدند. به عنوان مثال، در ۱۰ روز گذشته، تنها یک روز با رشد قیمت بسته شد. این نشان‌دهنده احساسات شدید نزولی و ورود روند نزولی به فاز جدیدی است که در آن کف قیمت می‌تواند بسیار سریع‌تر یافت شود.

    امید به بازگشت یا فریب؟

    در ساعات گذشته اخبار مثبت‌تری منتشر شده و قیمت پای (PI) تا زمان تنظیم این گزارش به ۰.۰۸ دلار بازگشته است. با این حال، هنوز مشخص نیست که آیا این یک جهش فریبنده گربه مرده (dead-cat bounce) دیگر است یا خیر.

    فشار فروش و نقدینگی

    به محض از دست رفتن حمایت در سطح ۰.۱۰ دلار، حجم فروش افزایش یافت. این وضعیت اوضاع را بدتر کرد و احتمالاً منجر به نقدینگی‌های آبشاری شد که فشار بیشتری بر قیمت در حال سقوط وارد کرد.

    وضعیت فعلی و چشم‌انداز آینده

    اگرچه فشار فروش نسبت به دیروز کاهش یافته است، اما روز هنوز به پایان نرسیده و این وضعیت می‌تواند تغییر کند. قیمت بالای ۰.۰۷ دلار تثبیت شد و به ۰.۰۸ دلار جهش کرد، اما این می‌تواند صرفاً یک توقف موقت قبل از رسیدن به سطوح پایین‌تر جدید باشد.

    شاخص‌های مومنتوم در سطوح افراطی

    به دلیل فشار سنگین فروش، شاخص‌های مومنتوم به سطوح افراطی رسیده‌اند. به عنوان مثال، شاخص قدرت نسبی (RSI) روزانه در ۱۲ واحد قرار دارد، سطحی که قبلاً برای این ارز دیجیتال دیده نشده بود. سطوح افراطی اغلب محل یافتن کف قیمت هستند.

    امید است که این روند قیمتی به روند نزولی پایان دهد و به شبکه پای (PI) اجازه دهد تا تثبیت شده و کف قیمت را تأیید کند. اگر حمایت در سطح ۰.۰۷ دلار حفظ نشود، خریداران احتمالاً به سمت ۰.۰۶ دلار یا حتی ۰.۰۵ دلار عقب‌نشینی خواهند کرد. مقاومت فعلی در ۰.۱۰ دلار قرار دارد.

  • پیش‌بینی قیمت ریپل (XRP) برای این هفته (۱۵ جولای)

    پیش‌بینی قیمت ریپل (XRP) برای این هفته (۱۵ جولای)

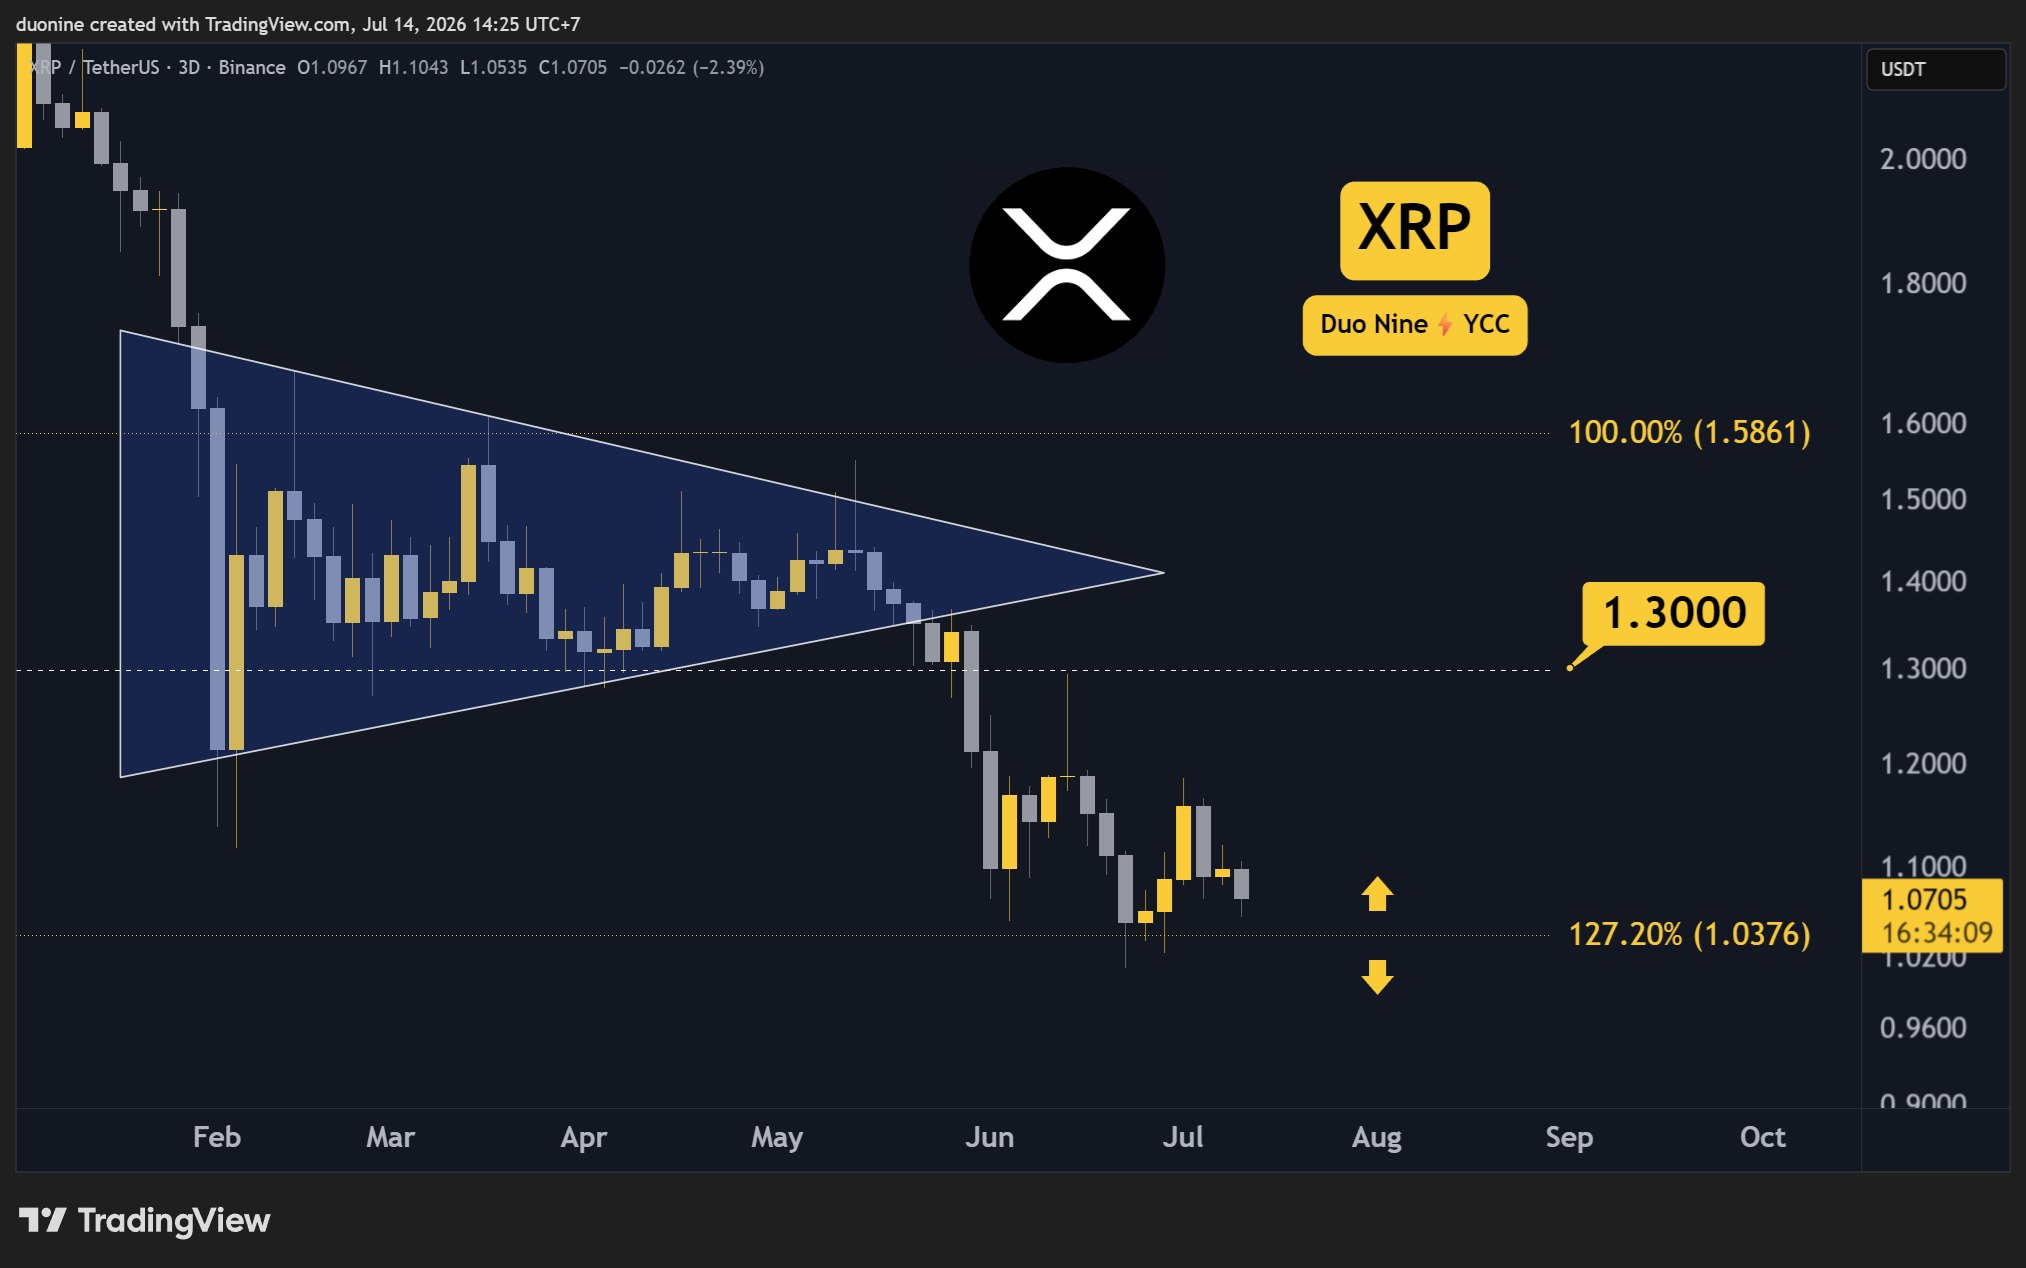
    قیمت ریپل (XRP) روز گذشته به زیر ۱.۰۷ دلار سقوط کرد، اما بازگشت چشمگیر بازار به آن کمک کرد تا بیشتر ضررهای خود را جبران کند. با این حال، این ارز دیجیتال هنوز نیاز دارد تا یک سطح کلیدی را دوباره به دست آورد تا روند صعودی بیشتری پیدا کند.

    سطوح حمایتی کلیدی: ۱.۰۰ دلار
    سطوح مقاومتی کلیدی: ۱.۳ دلار، ۱.۶ دلار، ۲ دلار

    پس از یک جهش کوتاه، فروشندگان بازگشتند و موفق شدند کنترل قیمت را در حدود سطح ۱.۱۸ دلار به دست بگیرند. این دارایی در هفته‌های بعد وارد یک روند نزولی آشکار شد که آن را به پایین‌ترین سطح ذکر شده یعنی زیر ۱.۰۷ دلار رساند. اگرچه به نظر می‌رسید آماده آزمایش مجدد حمایت ۱.۰۰ دلاری است، اما به سرعت بازگشت و در حال حاضر خطر فوری در دیدرس نیست.

    در حالی که افت مجدد به ۱.۰۰ دلار می‌تواند نزولی تلقی شود، تا زمانی که این سطح به مقاومت تبدیل نشود، زود است که چنین حکمی صادر کرد. خریداران نیز فرصت دیگری خواهند داشت تا در این سطح کلیدی ظاهر شوند و فروشندگان را عقب برانند.

    برای تبدیل شدن به روند صعودی در این روند قیمتی، ریپل باید بالای ۱.۰۰ دلار باقی بماند و یک کف بالاتر را ثبت کند. با توجه به اینکه حجم فروش برای ماه‌ها رو به کاهش بوده است، این می‌تواند فرصتی را برای خریداران فراهم کند تا کنترل را دوباره به دست آورند.

    کمترین قیمت فعلی در ۱.۰۱ دلار قرار دارد. تا زمانی که خریداران بتوانند مانع فروشندگان شوند قبل از رسیدن به این سطح، آنها شانس معکوس کردن روند نزولی و بازپس‌گیری شتاب را دارند. با این حال، این امر همچنین نیازمند افزایش حجم خرید خواهد بود.

    یک سیگنال جالب دیگر که می‌تواند خریداران را دوباره در کنترل قرار دهد، در شاخص قدرت نسبی (RSI) سه روزه ظاهر می‌شود که واگرایی صعودی واضحی را نشان می‌دهد. در حالی که قیمت ریپل کف‌های پایین‌تری را ثبت کرده است، RSI کف‌های بالاتری را نشان داده است.

    این یک سیگنال اولیه است که می‌تواند به معکوس شدن عمده در آینده اشاره کند. برای اینکه این اتفاق بیفتد، اصلاح ریپل باید در ۱.۰۰ دلار متوقف شود و سپس به آرامی ضررهای اخیر خود را جبران کند. ثبت یک سقف بالاتر از ۱.۱۸ دلار، معکوس شدن روند را تأیید خواهد کرد.

  • Market Reassesses Corporate Bitcoin Demand Amid Scrutiny of Funding Conditions and Uncertainties

    Market Reassesses Corporate Bitcoin Demand Amid Scrutiny of Funding Conditions and Uncertainties

    The market’s perception of corporate Bitcoin treasury demand is undergoing a shift, moving away from a sole focus on accumulation volume towards a more critical evaluation of the underlying financial conditions and risks that enable these holdings. This reassessment, according to QCP Capital, was catalyzed by a relatively small sale of Bitcoin by Strategy in late May.

    While Strategy’s sale of 32 BTC was immaterial compared to its substantial holdings of 846,842 BTC, it challenged a long-held market assumption: that corporate treasuries would exclusively buy Bitcoin and never sell. This event prompted investors to question whether these treasury holdings were truly untouchable. Even after Strategy resumed buying within weeks, the market’s reaction indicated a greater focus on the funding capacity, balance-sheet liquidity, and overall confidence in the corporate treasury model, rather than solely on the volume of accumulation. The exact timing and magnitude of future corporate Bitcoin purchases remain uncertain, as do the stability of ETF inflows into Bitcoin, the future pricing of preferred securities and convertible instruments related to Strategy, and the future premium on Strategy’s ability to raise capital.

    Corporate Holdings and Strategy’s Dominance

    Public companies collectively hold approximately 1.26 million BTC, with Strategy accounting for roughly two-thirds of this total. This concentration means that Strategy’s actions, issuance conditions, and reserve policies significantly influence Bitcoin sentiment beyond their direct impact on the spot market. In Q2, the financial structures supporting corporate Bitcoin accumulation came under increased scrutiny. Instead of relying on purchase announcements, investors are now closely monitoring metrics such as mark-to-market net asset value (mNAV), equity issuance, preferred demand, convertible capacity, and cash reserves to gauge treasury demand. The future cash reserves of companies holding Bitcoin are also a point of uncertainty.

    Financial Health and Funding Conditions

    QCP Capital explained that favorable funding conditions allow companies to raise capital, expand their Bitcoin reserves, and reinforce confidence in the treasury model. Conversely, tightening conditions can create cash needs due to recurring preferred-stock obligations, as potentially indicated by Strategy’s May sale. Despite these concerns, Strategy’s equity continues to trade above the combined value of its Bitcoin net asset value and U.S. dollar reserves, suggesting a premium on its ability to raise capital, even with approximately $22.2 billion in preferred securities and convertible instruments ranking ahead of its common equity.

    Future Outlook and Potential Risks

    Looking ahead to Q3, QCP Capital outlined potential scenarios for Bitcoin. Their base case anticipates Bitcoin trading between $60,000 and $75,000, supported by stabilizing ETF inflows and corporate treasury demand. A sustained reclaim of $75,000 could potentially drive prices toward $80,000-$82,000. However, the firm warned that renewed ETF outflows, a stronger dollar, or rising real yields could lead to a break below $58,000-$60,000, signaling a more bearish outlook. The precise impact of a stronger dollar or rising real yields on Bitcoin prices remains uncertain. It is also uncertain whether Strategy will become a major seller of Bitcoin in the future.

    Bitwise CIO Matt Hougan also commented on Strategy’s future influence, suggesting that the company is unlikely to dominate Bitcoin demand in the next market cycle as it has previously. Hougan does not anticipate Strategy becoming a major seller, viewing it as a net buyer if crypto asset prices recover.

    Continued net accumulation by Strategy and other public companies, coupled with stabilizing ETF inflows, could strengthen Bitcoin’s absorption capacity and help repair market confidence. However, QCP warned that slower purchases, weaker preferred pricing, a compressed mNAV premium, or declining cash reserves would indicate growing stress, potentially making the corporate treasury bid more selective and increasing sentiment risk. The market’s focus has undeniably shifted, requiring a deeper dive into the financial health and sustainability of corporate Bitcoin holdings.

    Why This Matters

    The materials describe a narrow update: Strategy’s sale of 32 BTC in late May, despite being a small amount relative to its holdings, challenged the market’s assumption that corporate treasuries only buy Bitcoin and never sell. The exact timing and magnitude of future corporate Bitcoin purchases.

    Broader Context

    Source materials place the market analysis in this context: Corporate treasury demand remains one of Bitcoin’s most important structural sources of support.

  • Bitcoin Price Predictions Vary Widely Amidst Market Uncertainty and Mixed Signals

    Bitcoin Price Predictions Vary Widely Amidst Market Uncertainty and Mixed Signals

    Bitcoin’s future price is subject to a wide range of predictions, with AI models and financial institutions offering forecasts that span from a potential $100,000 by the end of 2026 to a bearish target of $42,000. These divergent outlooks are occurring against a backdrop of mixed market signals, including recent ETF flows, investor sentiment indicators, and technical chart patterns, underscoring significant uncertainty in the cryptocurrency’s trajectory. The exact timing and impact of the FOMC meeting on July 28-29 remain uncertain, as do the ability of buyers to reclaim key resistance levels and the realization of bearish technical patterns.

    According to Claude Fable 5, an AI model, the bull case price target for Bitcoin is $100,000 by the close of 2026. Standard Chartered also carries a $100,000 year-end target and views current price dips as a potential buying opportunity. However, other analyses present a more cautious or bearish outlook. Citi recently revised its 12-month target for Bitcoin downwards, from $112,000 to $82,000, and now anticipates zero new ETF inflows for a full year. Furthermore, a head and shoulders pattern identified on the 3-day chart suggests a potential measured move towards $42,000 if the Fibonacci neckline at $55,298 is breached.

    Market sentiment, as measured by the Fear and Greed index, currently stands at 23, indicating ‘Extreme Fear.’ This level of fear has historically been interpreted by some as an entry point for conviction. Despite this, June saw significant outflows from Bitcoin ETFs, totaling $4.5 billion, marking it as the worst ETF month on record. This contrasts with a positive inflow of $221 million reported on July 2, which was the first positive inflow in ten sessions. At the time of reporting, Bitcoin was priced at $62,155, down 2.49% on the day, with a session high of $64,385 and a low of $61,750. Spot ETFs currently hold approximately $80 billion in Bitcoin.

    Technical indicators suggest fading momentum. The Relative Strength Index (RSI) is reading near 42, with its signal line around 46. This pattern, where momentum fades beneath its average and bounces are sold, is interpreted by some analysts as exhaustion rather than capitulation. For Bitcoin to reach the $100,000 target, buyers would need to reclaim the $68,000 resistance level and maintain support at $59,500.

    Macroeconomic factors also play a crucial role in shaping the outlook. The upcoming FOMC meeting on July 28-29 is seen as a potential catalyst. A dovish pivot from the Federal Open Market Committee could weaken the U.S. dollar, compress yields, and potentially drive institutional capital back into risk assets like cryptocurrencies.

    PlanB and Glassnode have flagged Q4 2026 as the likeliest window for a Bitcoin bottom. Historical price action indicates that Bitcoin topped near $126,000 in October 2025 and has since formed lower highs. A significant structural break was observed in February when the price dropped through $84,000, followed by a failed rally to approximately $82,000 in May.

    The inherent uncertainties surrounding Bitcoin’s future price remain substantial. The potential impact of the FOMC meeting, the ability of buyers to overcome key resistance levels, and the realization of bearish technical patterns all contribute to a complex and unpredictable market environment. The long-term impact of ETF ownership on Bitcoin’s traditional four-year cycles is also a subject of ongoing debate, with some analysts suggesting the cycle may be lengthening and becoming shallower.

    Why This Matters

    The materials describe a narrow update: Various AI models and financial institutions have issued price predictions for Bitcoin, ranging from bullish targets of $100,000 to bearish targets of $42,000, with differing analyses on ETF flows, market sentiment, and technical patterns. The exact timing and impact of the FOMC meeting on July 28-29.

    Broader Context

    Source materials place the factual news in this context: The article discusses predictions for Bitcoin’s price by various AI models and financial institutions.

  • Binance Capital Connect Introduces Express Interest-Only Mode

    Binance Capital Connect Introduces Express Interest-Only Mode

    Binance Introduces “Express Interest Only” Mode on Capital Connect

    Binance is launching “Express Interest Only” (EIO) mode on Capital Connect, a pioneering portfolio marketplace designed to connect professional trading teams with institutional investors. This new feature aims to provide a compliant avenue for trading teams to showcase their performance history to institutional investors, while simultaneously offering investors an early look at emerging strategies before they are officially available for investment.

    EIO Mode Functionality

    Under EIO mode, investment in portfolios is not directly available. Instead, institutional investors can submit non-binding expressions of interest. Trading teams will then receive anonymized demand signals via email notifications.

    Alongside the introduction of EIO mode, Capital Connect’s portfolio detail pages have been enhanced with more comprehensive performance metrics, detailed portfolio composition data, and information about the trading teams. These updates apply to both active and EIO portfolios. Access to this enhanced dashboard is restricted to whitelisted Capital Connect investors.

    EIO mode serves as a view-only listing for trading teams that have not yet obtained the necessary licenses to offer their strategies to external investors. This allows them to gauge interest from verified Capital Connect investors before undertaking the licensing process required to become fully open to investors on the platform.

    Key features of EIO mode include:

    • Visible Performance Data: Investors can access the same detailed performance metrics as active portfolios, including multi-period returns, risk metrics, Net Asset Value (NAV) history, and portfolio composition.
    • No Investment Available: All investment functionalities, such as subscribe and redeem options, are disabled.
    • Marketplace Badge: All EIO listings will be clearly marked with an “Express Interest Only” badge on the marketplace.
    • Restricted Visibility: EIO portfolios are only visible to logged-in, verified professional investors who meet Capital Connect’s qualification criteria. Users who are not logged in or do not meet these requirements will not be able to view EIO listings.
    • Limited Duration: Trading teams can remain in EIO mode for a limited period. The EIO mode expires after six months and may be extended for an additional three months, subject to review.

    How to Express Interest

    Investors can browse EIO portfolios alongside active portfolios, viewing full performance data. To express interest, users click “Express Interest” and complete a brief form. These submissions are non-binding, do not grant investment access, and do not guarantee direct contact with the trading team.

    For trading teams, EIO mode offers a way to showcase their performance track record to KYB-verified professional investors on Capital Connect. They will receive anonymized email notifications when an investor submits an interest form. It is important to note that investment and direct investor contact are unavailable while in EIO mode.

    Pathway to Active Status

    Trading teams operating in EIO mode are required to pursue the necessary licensing to transition to active status. Once licensed and after maintaining a 30-day active track record on Capital Connect, their portfolios can be moved to active status.

    Existing Portfolio Account Trading Teams are advised to contact their dedicated Account Manager. Binance will review applications before listing strategies in EIO mode. New entities must complete KYB onboarding and configure their Portfolio Account before applying for an EIO mode listing. Detailed onboarding instructions are available from dedicated Account Managers.

    Investors can access the Capital Connect marketplace directly on Binance. KYB-verified users who are VIP 3 or above are eligible to access Capital Connect, including EIO portfolios.

  • بایننس کپیتال کانکت حالت سود تنها راه‌اندازی کرد

    بایننس کپیتال کانکت حالت سود تنها راه‌اندازی کرد

    بایننس حالت “ابراز علاقه صرف” (EIO) را در Capital Connect، اولین بازار پورتفولیوی صنعت که تیم‌های معاملاتی حرفه‌ای را به سرمایه‌گذاران نهادی متصل می‌کند، معرفی می‌کند.

    حالت EIO مسیری منطبق با مقررات را برای تیم‌های معاملاتی فراهم می‌کند تا سوابق عملکرد خود را در Capital Connect به سرمایه‌گذاران نهادی ارائه دهند و در عین حال به سرمایه‌گذاران امکان دسترسی زودهنگام برای کشف استراتژی‌های نوظهور را پیش از قابل سرمایه‌گذاری شدن، می‌دهد. سرمایه‌گذاری در پورتفولیوهای EIO در دسترس نیست. سرمایه‌گذاران می‌توانند ابراز علاقه غیرالزام‌آور خود را ثبت کنند و تیم‌های معاملاتی از طریق اعلان ایمیلی، سیگنال‌های تقاضای ناشناس دریافت می‌کنند.

    در کنار EIO، صفحه جزئیات پورتفولیو در Capital Connect اکنون شامل معیارهای عملکرد بهبود یافته، داده‌های ترکیب پورتفولیو و اطلاعات تیم معاملاتی برای پورتفولیوهای فعال و EIO است. دسترسی به این داشبورد فقط برای سرمایه‌گذاران مجاز Capital Connect در دسترس است.

    حالت EIO یک حالت لیستینگ فقط نمایشی برای تیم‌های معاملاتی است که هنوز مجوزهای لازم برای ارائه استراتژی‌های خود به سرمایه‌گذاران خارجی را ندارند. حالت EIO به تیم‌های معاملاتی اجازه می‌دهد تا پیش از پیگیری مجوزهای لازم برای باز شدن به روی سرمایه‌گذاران در Capital Connect، میزان علاقه سرمایه‌گذاران تأیید شده Capital Connect را بسنجند. در حالت EIO:

    • داده‌های عملکرد قابل مشاهده هستند: سرمایه‌گذاران می‌توانند معیارهای جامع عملکرد مشابه پورتفولیوهای فعال را مشاهده کنند، از جمله بازدهی دوره‌های چندگانه، معیارهای ریسک، تاریخچه ارزش خالص دارایی (NAV) و ترکیب پورتفولیو.
    • سرمایه‌گذاری در دسترس نیست: تمامی گزینه‌های سرمایه‌گذاری (خرید، بازخرید) غیرفعال هستند.
    • تمامی لیستینگ‌های EIO در بازار دارای نشان “فقط ابراز علاقه” هستند.

    پورتفولیوهای EIO فقط برای سرمایه‌گذاران حرفه‌ای وارد شده به سیستم و تأیید شده که معیارهای واجد شرایط بودن Capital Connect را برآورده می‌کنند، قابل مشاهده هستند. کاربرانی که وارد سیستم نشده‌اند یا معیارهای واجد شرایط بودن را ندارند، قادر به مشاهده لیستینگ‌های EIO نخواهند بود.

    • مدت زمان محدود: تیم‌های معاملاتی فقط برای مدت محدودی می‌توانند در حالت EIO باقی بمانند. حالت EIO پس از شش ماه منقضی می‌شود و با بررسی، تا سه ماه دیگر قابل تمدید است.

    پورتفولیوهای EIO را در کنار پورتفولیوهای فعال با داده‌های کامل عملکرد مرور کنید.

    بر روی “ابراز علاقه” کلیک کرده و فرم کوتاه علاقه را تکمیل کنید.

    ثبت‌نام‌ها غیرالزام‌آور هستند، بدون دسترسی به سرمایه‌گذاری و بدون تضمین تماس مستقیم.

    سوابق عملکرد خود را به سرمایه‌گذاران حرفه‌ای تأیید شده از طریق KYB در Capital Connect نمایش دهید.

    هنگامی که سرمایه‌گذار فرم علاقه را ارسال می‌کند، اعلان ایمیلی ناشناس دریافت کنید.

    سرمایه‌گذاری و تماس مستقیم با سرمایه‌گذار در طول حالت EIO در دسترس نیست.

    مسیر به وضعیت فعال

    تیم‌های معاملاتی در حالت EIO موظفند برای انتقال به وضعیت فعال، مجوزهای لازم را پیگیری کنند. پس از اخذ مجوز و حفظ سابقه عملکرد فعال به مدت ۳۰ روز در Capital Connect، پورتفولیو می‌تواند به وضعیت فعال منتقل شود.

    اگر در حال حاضر یک تیم معاملاتی حساب پورتفولیو هستید، لطفاً با مدیر حساب اختصاصی خود تماس بگیرید. بایننس درخواست شما را پیش از لیست کردن استراتژی‌تان در حالت EIO بررسی خواهد کرد.

    اگر هنوز یک تیم معاملاتی حساب پورتفولیو نیستید، باید فرآیند احراز هویت کسب‌وکار (KYB) را تکمیل کرده و حساب پورتفولیوی خود را پیکربندی کنید تا بتوانید برای لیستینگ در حالت EIO درخواست دهید. برای دستورالعمل‌های دقیق ثبت‌نام، نهادهای واجد شرایط می‌توانند با مدیر حساب اختصاصی خود تماس بگیرند.

    سرمایه‌گذاران می‌توانند مستقیماً از طریق بایننس به بازار Capital Connect دسترسی داشته باشند. کاربران تأیید شده از طریق KYB که در سطح VIP ۳ یا بالاتر هستند، واجد شرایط دسترسی به Capital Connect، از جمله پورتفولیوهای EIO هستند.

    بایننس Capital Connect را توسعه می‌دهد: بازاری برای پورتفولیو برای سرمایه‌گذاران نهادی و تیم‌های معاملاتی

    بایننس حساب‌های پورتفولیو را راه‌اندازی می‌کند: اولین راه‌حل فناورانه صنعت برای تیم‌های معاملاتی

    توجه: ممکن است بین این محتوای اصلی به زبان انگلیسی و هر نسخه ترجمه شده، مغایرت‌هایی وجود داشته باشد. لطفاً در صورت بروز هرگونه مغایرت، به نسخه اصلی انگلیسی برای دقیق‌ترین اطلاعات مراجعه کنید.

    ۱۵ ژوئیه ۲۰۲۶

  • بیت‌کوین در آستانه پایان روند نزولی؛ آیا بهبود گسترده در راه است؟

    بیت‌کوین در آستانه پایان روند نزولی؛ آیا بهبود گسترده در راه است؟

    گزارش اخیر Bitfinex Alpha نشان می‌دهد که بیت‌کوین معمولاً یک پنجره شش ماهه در بازار نزولی دارد که در آن قیمت آن زیر “قیمت تحقق یافته دارندگان کوتاه‌مدت” معامله می‌شود. ماه‌های پنجم و ششم، مرحله نهایی این دوره را مشخص می‌کنند و پس از آن، این دارایی شاهد یک بهبود گسترده‌تر خواهد بود.

    ماه ژوئیه، پنجمین ماه از این پنجره مرحله نزولی است و تحلیلگران معتقدند که بیت‌کوین (BTC) می‌تواند شاهد یک بهبود قابل توجه باشد. در حالی که پویایی‌های مثبتی وجود دارند که می‌توانند محرک جهش در هفته‌های آینده باشند، کارشناسان بازار همچنین عواملی را شناسایی کرده‌اند که می‌توانند این بهبود را مختل کنند.

    به گفته تحلیلگران Bitfinex، فصل‌گرایی مثبت ماه ژوئیه ممکن است محرک بهبود باشد، اما عوامل کلان اقتصادی مانند شاخص قیمت مصرف‌کننده (CPI) آمریکا در ماه ژوئن و تنش‌های ژئوپلیتیکی در خاورمیانه می‌توانند مانعی ایجاد کنند. بنابراین، پایان پنجره پنج تا شش ماهه برای تأیید یک بهبود گسترده‌تر برای بیت‌کوین کافی نیست؛ عوامل کلان اقتصادی و پویایی تقاضا نیز باید همسو شوند.

    تاکنون در این ماه، بیت‌کوین فروش‌های رکورد شرکتی را جذب کرده و طوفان‌های فشار ژئوپلیتیکی را پشت سر گذاشته است. هفته گذشته، این دارایی از جهات مختلف تحت فشار قرار گرفت؛ Strategy بزرگترین فروش خود را تا کنون اجرا کرد و فدرال رزرو با اختلافات ادامه‌دار روبرو بود.

    علیرغم محیط دشوار، بیت‌کوین توانست دامنه خود را بین ۶۱,۳۰۰ دلار و ۶۴,۷۰۰ دلار حفظ کند. مقاومت این دارایی با شکستن روند خروج سرمایه صندوق‌های قابل معامله در بورس (ETF) بیت‌کوین اسپات پس از نه هفته، بیشتر تقویت شد. این محصولات برای اولین بار در بیش از دو ماه، شاهد ورود خالص ۱۹۷.۴ میلیون دلاری بودند.

    اگرچه ورود سرمایه به ETFها نشان‌دهنده بهبود تقاضای نهادی است، اما بیت‌کوین همچنان به محیط کلان اقتصادی وابسته است و فصل‌گرایی مثبت ماه ژوئیه در اولویت دوم قرار دارد.

    از دیدگاهی دقیق‌تر، تحلیلگران معتقدند الگوی ورود سرمایه به ETFها بیش از مجموع آن اهمیت دارد. ورود سرمایه در روزهای آرام‌تر بیشتر بود و زمانی که تنش‌های ژئوپلیتیکی تشدید شد، کاهش یافت. این نشان می‌دهد که تقاضای نهادی یک کف پایدار ایجاد نکرده است.

    با در نظر گرفتن این موضوع، یکی از شاخص‌های اصلی که باید مورد توجه قرار گیرد، میانگین متحرک ساده ۳۰ روزه (SMA) خالص ورودی ETFها است. این معیار، جهت اصلی موقعیت‌یابی نهادی و روند پایدار در تقاضای بازار را ردیابی می‌کند. SMA نشان می‌دهد که روند ماهانه جریان ETFها همچنان در وضعیت انقباض خالص قرار دارد و بازخرید روزانه به ۸۸.۹ میلیون دلار رسیده است.

    حرکت‌های بعدی SMA به این بستگی دارد که آیا فصل‌گرایی ماه ژوئیه به اندازه کافی قوی است تا تنش‌های کلان اقتصادی را در هفته‌های آینده تحت‌الشعاع قرار دهد.

  • فابل ۵ کلود هوش مصنوعی: پیش‌بینی صعودی بیت‌کوین تا پایان ۲۰۲۶

    فابل ۵ کلود هوش مصنوعی: پیش‌بینی صعودی بیت‌کوین تا پایان ۲۰۲۶

    کلود فیبل ۵ با نگاهی به بیت‌کوین در قیمت ۶۲ هزار دلاری، هدف ۱۰۰ هزار دلاری را به عنوان سناریوی صعودی خود پیش‌بینی کرد. این پیش‌بینی نشان‌دهنده افزایشی ۶۱ درصدی از سطحی است که به تازگی نیمی از ارزش خود را از دست داده است.

    استدلال صعودی

    استدلال صعودی بیشتر بر زیرساخت‌ها متمرکز است تا قیمت. جریان ورودی به صندوق‌های قابل معامله در بورس (ETF) از ۲ ژوئیه برای اولین بار در ۱۰ روز معاملاتی گذشته مثبت شد و ۲۲۱ میلیون دلار سرمایه به این بازار بازگشت. شاخص ترس و طمع در سطح ۲۳، که نشان‌دهنده ترس شدید است، قرار دارد و این سطح در گذشته نشان‌گر ورود سرمایه‌گذاران با‌اعتماد به نفس بوده است. ETFهای اسپات اکنون حدود ۸۰ میلیارد دلار بیت‌کوین در اختیار دارند، که این یک تقاضای ساختاری است که در چرخه‌های قبلی وجود نداشت.

    برنشتاین استدلال می‌کند که این پایگاه مالکیتی، چرخه چهارساله را به چرخه‌ای طولانی‌تر و کم‌عمق‌تر تبدیل کرده است؛ این یک تئوری با اعتبار واقعی است. استاندارد چارترد همچنان هدف ۱۰۰ هزار دلاری را تا پایان سال حفظ کرده و این کاهش قیمت را فرصتی برای خرید می‌داند. جلسه کمیته بازار آزاد فدرال رزرو (FOMC) در ۲۸ تا ۲۹ ژوئیه عامل تعیین‌کننده خواهد بود. یک چرخش به سمت سیاست‌های انبساطی، دلار را تضعیف کرده، بازده اوراق قرضه را کاهش می‌دهد و سرمایه نهادی را به سمت دارایی‌های پرریسک سوق می‌دهد.

    چشم‌انداز نزولی

    طرف نزولی صرفاً یک تمرین فکری نیست. ژوئن بدترین ماه برای ETFها از نظر خروج سرمایه با ۴.۵ میلیارد دلار بود. سیتی‌گروپ هدف ۱۲ ماهه خود را از ۱۱۲ هزار دلار به ۸۲ هزار دلار کاهش داد و اکنون پیش‌بینی می‌کند که برای یک سال کامل هیچ جریان ورودی جدیدی به ETFها نخواهد داشت.

    استراتژی، بیت‌کوین را برای اولین بار از سال ۲۰۲۲ فروخت که این سیگنالی از سوی سرسخت‌ترین دارنده در این فضا است. الگوی سر و شانه در نمودار سه روزه، در صورت شکست خط گردن فیبوناچی در سطح ۵۵,۲۹۸ دلار، حرکتی اندازه‌گیری شده در حدود ۴۲ هزار دلار را پیش‌بینی می‌کند. PlanB و Glassnode هر دو فصل چهارم ۲۰۲۶ را به عنوان محتمل‌ترین پنجره کف‌گذاری معرفی می‌کنند.

    ساختار قیمت نامطلوب است و صادقانه باید گفت. بیت‌کوین در اکتبر ۲۰۲۵ در نزدیکی ۱۲۶ هزار دلار به اوج خود رسید و از آن زمان تاکنون سقف‌های پایین‌تری را ثبت کرده است. افت قیمت در فوریه از میان ۸۴ هزار دلار، شکست ساختاری بود. در ماه مه قیمت تا حدود ۸۲ هزار دلار افزایش یافت و سپس ناکام ماند و این الگو را تأیید کرد. اکنون پس از زیان ۲.۴۹ درصدی روزانه، در قیمت ۶۲,۱۵۵ دلار قرار داریم، با سقف جلسه در ۶۴,۳۸۵ دلار و کف در ۶۱,۷۵۰ دلار. این همان الگوی سر و شانه است که در تایم‌فریم‌های بالاتر در حال شکل‌گیری است. حمایت در سطوح ۵۹,۵۰۰ دلار و سپس خط گردن ۵۵,۲۹۸ دلار قرار دارد. مقاومت‌ها در ۶۴,۰۰۰ دلار، ۶۸,۰۰۰ دلار و ۷۳,۰۰۰ دلار انباشته شده‌اند. شاخص قدرت نسبی (RSI) نزدیک به ۴۲ و خط سیگنال حدود ۴۶ را نشان می‌دهد.

    شکاف منفی به این معنی است که مومنتوم در حال کاهش است و حتی در سطوح پایین‌تر از میانگین خود قرار دارد، بنابراین افزایش‌های قیمتی با فروش مواجه می‌شوند. این نشانه‌ی تسلیم نیست، بلکه خستگی است. برای رسیدن به هدف ۱۰۰ هزار دلاری، خریداران ابتدا باید سطح ۶۸ هزار دلار را بازپس گیرند و در این میان از ۵۹,۵۰۰ دلار حمایت کنند. در صورت از دست دادن خط گردن، عدد نزولی فیبل ۵ از حالت تئوری خارج خواهد شد.

    چرخش سرمایه در حال حاضر در جریان است. اکثر مردم پس از وقوع آن را تشخیص خواهند داد. هوش مصنوعی متا پیش‌بینی می‌کند که ارزهای بزرگ شکسته نشده‌اند، بلکه محدود شده‌اند. بیت‌کوین، اتریوم و XRP هفته‌هاست که در برابر باندهای قیمتی مشابهی فشار می‌آورند و هیچ‌کدام قادر به عبور از آن‌ها نیستند. عوامل کلان اقتصادی مدام به تعویق می‌افتند. جریان ورودی نهادی هر فصل به تعویق می‌افتد. انتظار برای کاتالیست‌هایی که خارج از کنترل شما هستند، موقعیت‌گیری نیست، بلکه صرفاً انتظار است.

    سرمایه‌ای که چرخه‌های کافی را تجربه کرده است، در سطوح مقاومت متوقف نمی‌شود. قبل از رسیدن به مقصد، حرکت می‌کند. زیرساخت‌های اولیه بر اساس محاسبات متفاوتی عمل می‌کنند. ارزش بازار به اندازه کافی کوچک به این معنی است که یک چرخش جزئی، حرکت چشمگیری را ایجاد می‌کند. بازده از شکاف بین ارزش واقعی چیزی و قیمتی که بازار برای آن تعیین کرده است، حاصل می‌شود. این شکاف تنها زمانی وجود دارد که پروژه کشف نشده باقی بماند.

    تجزیه چند زنجیره‌ای (Multi-chain fragmentation) هر روز به امور مالی غیرمتمرکز (DeFi) آسیب می‌زند. بیت‌کوین، اتریوم و سولانا سیستم‌های کاملاً ایزوله را اجرا می‌کنند و هیچ راه بومی برای اتصال آن‌ها وجود ندارد. هر کاربری که از این مرزها عبور می‌کند، هزینه، لغزش قیمت و تراکنش‌های ناموفق را متحمل می‌شود. هر بار. LiquidChain هر سه را در یک لایه اجرایی واحد ادغام می‌کند. یک استقرار. دسترسی کامل به اکوسیستم. بدون هیچ‌گونه مالیات بین زنجیره‌ای. بازار هنوز این را کشف نکرده است. این نکته اصلی است. پیش‌فروش با قیمت ۰.۰۱۴۵۴ دلار و بیش از ۸۹۰ هزار دلار جمع‌آوری شده است. “طبقه همکف” یک توصیف است، نه یک پیشنهاد تبلیغاتی.

  • XRP Tests Key Support Level Amid Divergent Analyst Views and Institutional Selling

    XRP Tests Key Support Level Amid Divergent Analyst Views and Institutional Selling

    XRP is currently trading around the $1.07 mark, testing a critical support level, a situation met with sharply divergent outlooks from market analysts. Institutional investors have also recently begun reducing their exposure to the cryptocurrency, adding to the prevailing uncertainty.

    XRP at a Crossroads
    The cryptocurrency space is closely watching XRP’s price action as it hovers near a significant support level. As of press time, XRP is valued at approximately $1.07, reflecting a 5% decrease over the past week. Whether XRP will continue to fall or rebound to new highs remains uncertain.

    Divergent Analyst Outlooks
    Analysts are divided on XRP’s future trajectory. Some foresee a potential move below the $1 mark, with some market observers suggesting a possible decline toward the $0.90-$0.93 liquidity zone, potentially extending to a macro support level around $0.87. These views suggest that the current market structure may favor sellers and could lead to further downward price movement.

    Conversely, other market participants remain optimistic, pointing to historical patterns that have previously preceded significant rallies. Some analysts believe XRP could be repeating a macro pattern that has coincided with substantial gains in the past, with projections of a return to new all-time highs. Speculation exists regarding a potential price of $7 by year-end, though such targets are considered ambitious by some.

    Institutional Investor Behavior Shift
    Recent weeks have seen a shift in institutional investor behavior. Up until the beginning of July, inflows into spot XRP Exchange-Traded Products (ETPs) consistently surpassed outflows. However, this trend has reversed, with pension funds, hedge funds, and other conservative investors reportedly reducing their exposure. This has reportedly forced entities such as Bitwise, Canary Capital, Franklin Templeton, 21Shares, and Grayscale to sell XRP to maintain the proper backing of their shares.

    Navigating Uncertainty
    This institutional selling pressure adds a layer of complexity to the market analysis. While positive online sentiment regarding XRP has surged recently, the actions of these larger investors suggest a more cautious approach. The waning interest in spot XRP ETPs in recent weeks contrasts with the persistent loyalty often associated with the XRP community.

    The divergence in analyst opinions highlights the inherent uncertainty in the cryptocurrency market. While some foresee a continuation of the bear market for XRP, others anticipate a potential rebound. The possibility of XRP reaching new all-time highs, potentially above $9, is discussed, though the required market capitalization for such a surge, exceeding $350 billion, is viewed by some as a significant hurdle.

    Navigating this period of uncertainty requires careful consideration of all available signals. The current price action at a key support level, coupled with the contrasting views of market analysts and the recent actions of institutional investors, underscores the speculative nature of XRP and the broader crypto space. The future direction of XRP remains a subject of considerable debate, with no clear consensus emerging from the current market data.

    Why This Matters

    The materials describe a narrow update: XRP is currently trading around $1. Whether XRP will continue to fall or rebound to new highs.

    Broader Context

    Source materials place the market analysis in this context: Ripple’s cross-border token remains one of the most talked-about topics in the crypto space.

  • Perplexity AI Forecasts XRP Price Surge by End of 2026

    Perplexity AI Forecasts XRP Price Surge by End of 2026

    Perplexity AI has projected a bullish future for XRP, forecasting a price range of $3 to $5 by 2026, a significant leap from its current trading price of $1.06. This prediction suggests a potential near fivefold increase for a cryptocurrency that has experienced a year-long decline.

    The Bull Case for XRP

    The optimistic outlook for XRP hinges on its transition from a speculative trading asset to a functional utility token. Perplexity AI highlights several key factors: sustained institutional demand, consistent ETF inflows, and increasing transaction volume on Ripple’s payment network.

    These elements, when combined, could create a “supply shock” amplified by a narrative repricing, a combination historically known to drive substantial price appreciation. The stability of ETF investments is particularly noteworthy, as they are less prone to rapid divestment during market downturns compared to “hot money.” If Ripple’s payment network continues to absorb XRP from speculative markets, a shrinking supply coupled with growing interest could fuel significant price gains.

    Achieving a $3 price target from $1.06 does not require extraordinary market events, but rather a single quarter where the narrative surrounding XRP aligns with actual transaction flows.

    The Bear Case for XRP

    Conversely, the bearish outlook for XRP is currently more strongly supported by market data. Perplexity AI identifies a scenario where inflows diminish, adoption lags behind expectations, and overall cryptocurrency market risk appetite weakens.

    In such a climate, XRP could become trapped between $1 and $1.50, despite ongoing optimistic pronouncements. This price range has largely defined XRP’s trajectory since February, and recent market activity offers little indication that this consolidation will break to the upside.

    XRP is currently in a pronounced downtrend, having peaked near $3.66 in August 2025 and consistently printing lower highs each month since. Significant structural breaks occurred with the decline through $2.40 in October and the sharp drop below $1.20 in February. Since February, XRP has traded within a range of approximately $1.30 to $1.60 before breaking lower in June. This pattern suggests a descending channel, with continuation of this trend being the most probable scenario until evidence to the contrary emerges.

    As of the latest close, XRP was trading at $1.06696, down 1.70% for the session. Immediate support is identified at $1.05, with psychological support at $1.00. Resistance levels are situated at $1.20, $1.40, and the February high of $1.60.

    The Relative Strength Index (RSI) stands at approximately 41, with its signal line near 45, indicating negative momentum as the indicator continues to trend below its average. This suggests a gradual decline rather than an imminent bottom.

    For Perplexity AI’s bullish price prediction to materialize, XRP must first reclaim the $1.20 resistance level and then break through $1.60. Until then, the $1 to $1.50 range remains the most likely forecast based on current chart patterns.

    The Search for the Next Catalyst

    Major cryptocurrencies like Bitcoin, Ethereum, and XRP have been testing similar resistance levels for weeks. The catalyst for the next significant upward movement is often perceived to be just one data release away. Institutional inflows are consistently anticipated for the following quarter, and traders awaiting a breakout are essentially waiting for decisions made on other entities’ balance sheets.

    Early-Stage Infrastructure Plays

    In contrast, early-stage infrastructure projects operate under different dynamics. Capital that might be negligible at Bitcoin’s scale can significantly impact smaller, undiscovered projects. The potential for asymmetric returns lies in the discrepancy between a project’s intrinsic value and its current market valuation, a gap that exists because the project has yet to gain widespread recognition. Once discovered, this gap tends to close.

    Addressing Cross-Chain Fragmentation

    Cross-chain fragmentation has been a persistent issue in decentralized finance (DeFi) since the advent of blockchain bridges. Major networks like Bitcoin, Ethereum, and Solana were designed as independent systems with no inherent interoperability. Transactions between these networks incur costs in the form of fees, slippage, and execution failures. Bridges, intended as solutions, have instead become mechanisms for extracting value.

    LiquidChain aims to eliminate these fees by operating three networks within a single execution layer, allowing for unified deployment and interaction without a “cross-chain tax.” Perplexity AI has identified LiquidChain as a project worth monitoring. Its presale is currently priced at $0.01454, with over $860,000 raised.

    However, LiquidChain’s execution remains unproven, and its adoption is uncertain. Established assets offer predictable returns with clearly defined upside limits. LiquidChain, on the other hand, represents an entry point that may disappear once it gains market traction.