Tag: Market Trends

  • Crypto Liquidity Diverges: Bitcoin, Ethereum Recover While Altcoins Decline One Year Post-Liquidation Event

    Crypto Liquidity Diverges: Bitcoin, Ethereum Recover While Altcoins Decline One Year Post-Liquidation Event

    One year after a significant liquidation event on October 10, 2025, cryptocurrency market liquidity has shown a stark divergence, with Bitcoin and Ethereum recovering while altcoin liquidity continues to contract, according to CoinDesk Research.

    Bitcoin and Ethereum Rebound

    Research indicates that liquidity for major cryptocurrencies has improved. Bitcoin’s 1% order book depth on October 7, 2026, reached approximately $11.7 million, marking a 75% increase compared to the day of the crash. Ethereum has also seen substantial gains, with its 0.5% order book depth more than doubling to around $4.2 million, and its 1% order book depth rising by roughly three-quarters to approximately $5.3 million.

    These figures suggest that market makers are committing more capital to Bitcoin and Ethereum, a trend attributed by CoinDesk Research not just to lower prices but to a deeper commitment of funds.

    Altcoin Liquidity Erosion

    In contrast, the USD depth for a basket of altcoins has steadily declined since January 1, 2025. The depth at 5% from the price for altcoins has decreased by about one-third since early 2025, now standing at approximately $2 million. CoinDesk Research interprets this recovery in altcoin depth, when measured in token quantity, as primarily a result of price drops, potentially masking a continuous erosion of committed capital.

    Trading Volume and Event Context

    This liquidity divergence occurs alongside significantly lower spot trading volumes compared to the liquidation event. The average weekly spot trading volume for the four weeks ending September 27, 2026, was approximately $279 billion, a sharp decrease from the $801 billion recorded during the week of the October 10, 2025 event. August 2026 saw weekly spot trading volume hit a low of about $135 billion.

    The October 10, 2025 liquidation event, which saw over $19 billion in leveraged positions liquidated, was triggered partly by Bitcoin’s drop below $105,000 following an announcement by President Trump regarding tariffs on Chinese imports. CoinDesk Research analyzed market depth across several key dates, including January 1, 2025, the crash day, January 1, 2026, and the current week.

    Outlook

    Market makers have largely returned to major cryptocurrencies, with liquidity now exceeding pre-crash levels. This trend is anticipated to persist into the next year, with major cryptocurrencies expected to continue dominating institutional interest and trading volume, barring a few exceptions among altcoins. Uncertainties remain regarding the precise amount of capital flowing into Bitcoin and Ethereum, specific altcoins that may defy the trend, and the long-term trajectory of altcoin liquidity.

    Why This Matters

    The materials describe a narrow update: One year after a significant liquidation event on October 10, 2025, research indicates that liquidity for Bitcoin and Ethereum has improved, with order book depth increasing. The exact amount of capital that has rotated into Bitcoin and Ethereum.

    Broader Context

    Source materials place the factual news in this context: The article discusses the one-year anniversary of a major liquidation event on October 10, 2025, which involved over $19 billion in leveraged positions being liquidated.


  • Ethereum ETFs Suffer Largest Weekly Outflow Since January

    Ethereum ETFs Suffer Largest Weekly Outflow Since January

    Ethereum ETFs Face Steepest Weekly Outflow Since January

    US spot Ethereum exchange-traded funds (ETFs) experienced their worst week since late January, with investors withdrawing $542.1 million during the trading week ending October 9, 2026. This marks the largest weekly exodus from these funds in over eight months and coincides with Ether’s price falling below a key trading threshold.

    Concentrated Redemptions Drive Outflows

    The significant outflows were not evenly distributed among the funds. BlackRock’s iShares Ethereum Trust (ETHA) accounted for approximately $477 million of the total weekly redemptions, representing about 88% of all withdrawals in the category. Grayscale’s ETHE followed with $31.9 million in outflows during the same period.

    For perspective, the last time the Ethereum ETF category saw such substantial weekly outflows was in late January, when withdrawals totaled $611 million.

    Extended Period of Outflows

    The recent week’s performance is part of a broader trend of declining investor interest. The funds have now recorded nine consecutive trading days of outflows, beginning on September 29. Over this extended period, total redemptions have reached $697.2 million.

    Price Decline and Reduced Trading Activity

    The price action for Ether has offered little solace to investors. ETH settled near $2,491 on October 10, marking a decline of over 7% from the previous week. This price movement pushed Ether below two significant technical indicators: its 50-day simple moving average and the $2,500 level. Trading volume for ETH also saw a considerable drop, falling 61% to $7.2 billion.

    Broader Market Trends

    Ether was not the only cryptocurrency ETF to experience outflows. Bitcoin ETFs saw approximately $681 million withdrawn during the same period. In a more symbolic development, spot Solana ETFs recorded their first outflows since their launch, ending a 14-week streak of inflows.

    As of October 9, 2026, cumulative net inflows into US spot Ethereum ETFs stood at approximately $13.26 billion, with total net assets across the funds estimated at $15.71 billion. While the recent redemptions are substantial, they represent a relatively small portion of the overall capital invested in these products.

    Investor Confidence and Market Sentiment

    The significant concentration of outflows in BlackRock’s ETHA, the largest fund in the category, suggests it serves as a primary avenue for large holders to quickly reduce their exposure. Analysts suggest these outflows may signal waning investor confidence amid shifting market conditions. The simultaneous declines in both Ether and Bitcoin could indicate a broader bearish sentiment, potentially influenced by external economic factors and regulatory uncertainties.

    Key Signals for Ether’s Trajectory

    For those monitoring Ether’s performance, several key indicators are noteworthy. The ability of ETH to reclaim the $2,500 level and its 50-day moving average will be crucial. Additionally, a rebound in trading volume, currently at $7.2 billion, and a reversal of the nine-day outflow streak in daily ETF data will be closely watched.

    The continued redemptions from newer products like spot Solana ETFs, following a prolonged period of inflows, could suggest a broader trend of investors trimming riskier crypto positions across the market rather than reallocating capital between different assets.

  • SUI Token Surges Amidst Ecosystem Growth, Yet Key Uncertainties Persist

    SUI Token Surges Amidst Ecosystem Growth, Yet Key Uncertainties Persist

    The native token of the Sui Network, SUI, has experienced a notable price increase of approximately 54% over a 30-day period concluding in early October 2026, outperforming major cryptocurrencies like Bitcoin and Ether during the same timeframe. However, this rally is accompanied by significant uncertainties regarding the sustainability of these gains and the interpretation of on-chain metrics.

    Why This Matters

    The materials describe a narrow update: The native token of the Sui Network, SUI, increased in value by approximately 54% over a 30-day period ending in early October 2026. The sustained real-world usage performance of Sui’s network compared to its off-chain stress test results.

    Ecosystem Developments as Potential Drivers

    The recent price surge for SUI coincided with several key developments within the Sui ecosystem. According to the article, the total value locked (TVL) in Sui’s decentralized finance (DeFi) applications grew by 15.5% over the four weeks leading up to early October 2026. This growth contributed to Sui’s DeFi TVL peaking at approximately $1.21 billion on September 22, 2026, with NAVI Protocol being a notable contributor. Despite this overall growth, the source states that SUI experienced a 5.2% decline in price over the most recent week. This weekly TVL drop is presented as a reminder of how tightly Sui’s DeFi metrics track its token.

    Further bolstering the ecosystem narrative, Bitwise launched its PPLUS Premium+ RWA Vault on the Sui Network. This vault is designed to target a net yield of more than 10% for institutional assets, introducing real-world assets onto the blockchain. Additionally, during the Sui Basecamp conference, held from October 7-8, 2026, an off-chain stress test of the Sui network recorded an impressive throughput of 40.6 million transactions per second. While this demonstrates the underlying technology’s potential under controlled conditions, the source cautions that this is different from sustained real-world usage on the live network.

    Samsung also announced support for USDC on its Galaxy devices, with integrated Sui capabilities, potentially exposing millions of users to Sui-powered features. These developments, according to the article, did not happen in a vacuum and may have contributed to the positive sentiment surrounding SUI.

    Market Context and Performance Metrics

    In terms of market performance, SUI traded between $1.15 and $1.27 during the 30-day period leading up to early October 2026. By early October 2026, SUI was trading at approximately $1.12 to $1.15, with a market capitalization around $4.6 billion. Approximately 4.1 billion SUI tokens were in circulation, representing about 41% of the eventual maximum supply of 10 billion tokens. Investors evaluating SUI’s market cap are advised by the source to consider the fully diluted picture.

    Despite the recent gains, SUI remains significantly below its all-time high. The token reached a peak of around $5.35 in January 2025. At its early October 2026 price, SUI was roughly 78% below this all-time high. This suggests that a holder who bought at the peak would need the token to roughly quadruple from its current price just to break even, highlighting the potential for continued volatility.

    Navigating Uncertainty

    Key uncertainties remain for the Sui Network and its token. The source states that the sustained real-world usage performance of the network compared to its off-chain stress test results is a point of ambiguity. Furthermore, the impact of the remaining 59% of SUI tokens entering the market over time on its price is also uncertain. The correlation between SUI’s price and its DeFi TVL, as indicated by the recent weekly decline, suggests that token price fluctuations can directly impact reported ecosystem metrics, reinforcing the need for cautious interpretation.

  • Bitcoin Price Analysis: US Demand Dips, Is BTC’s Rally Over?

    Bitcoin Price Analysis: US Demand Dips, Is BTC’s Rally Over?

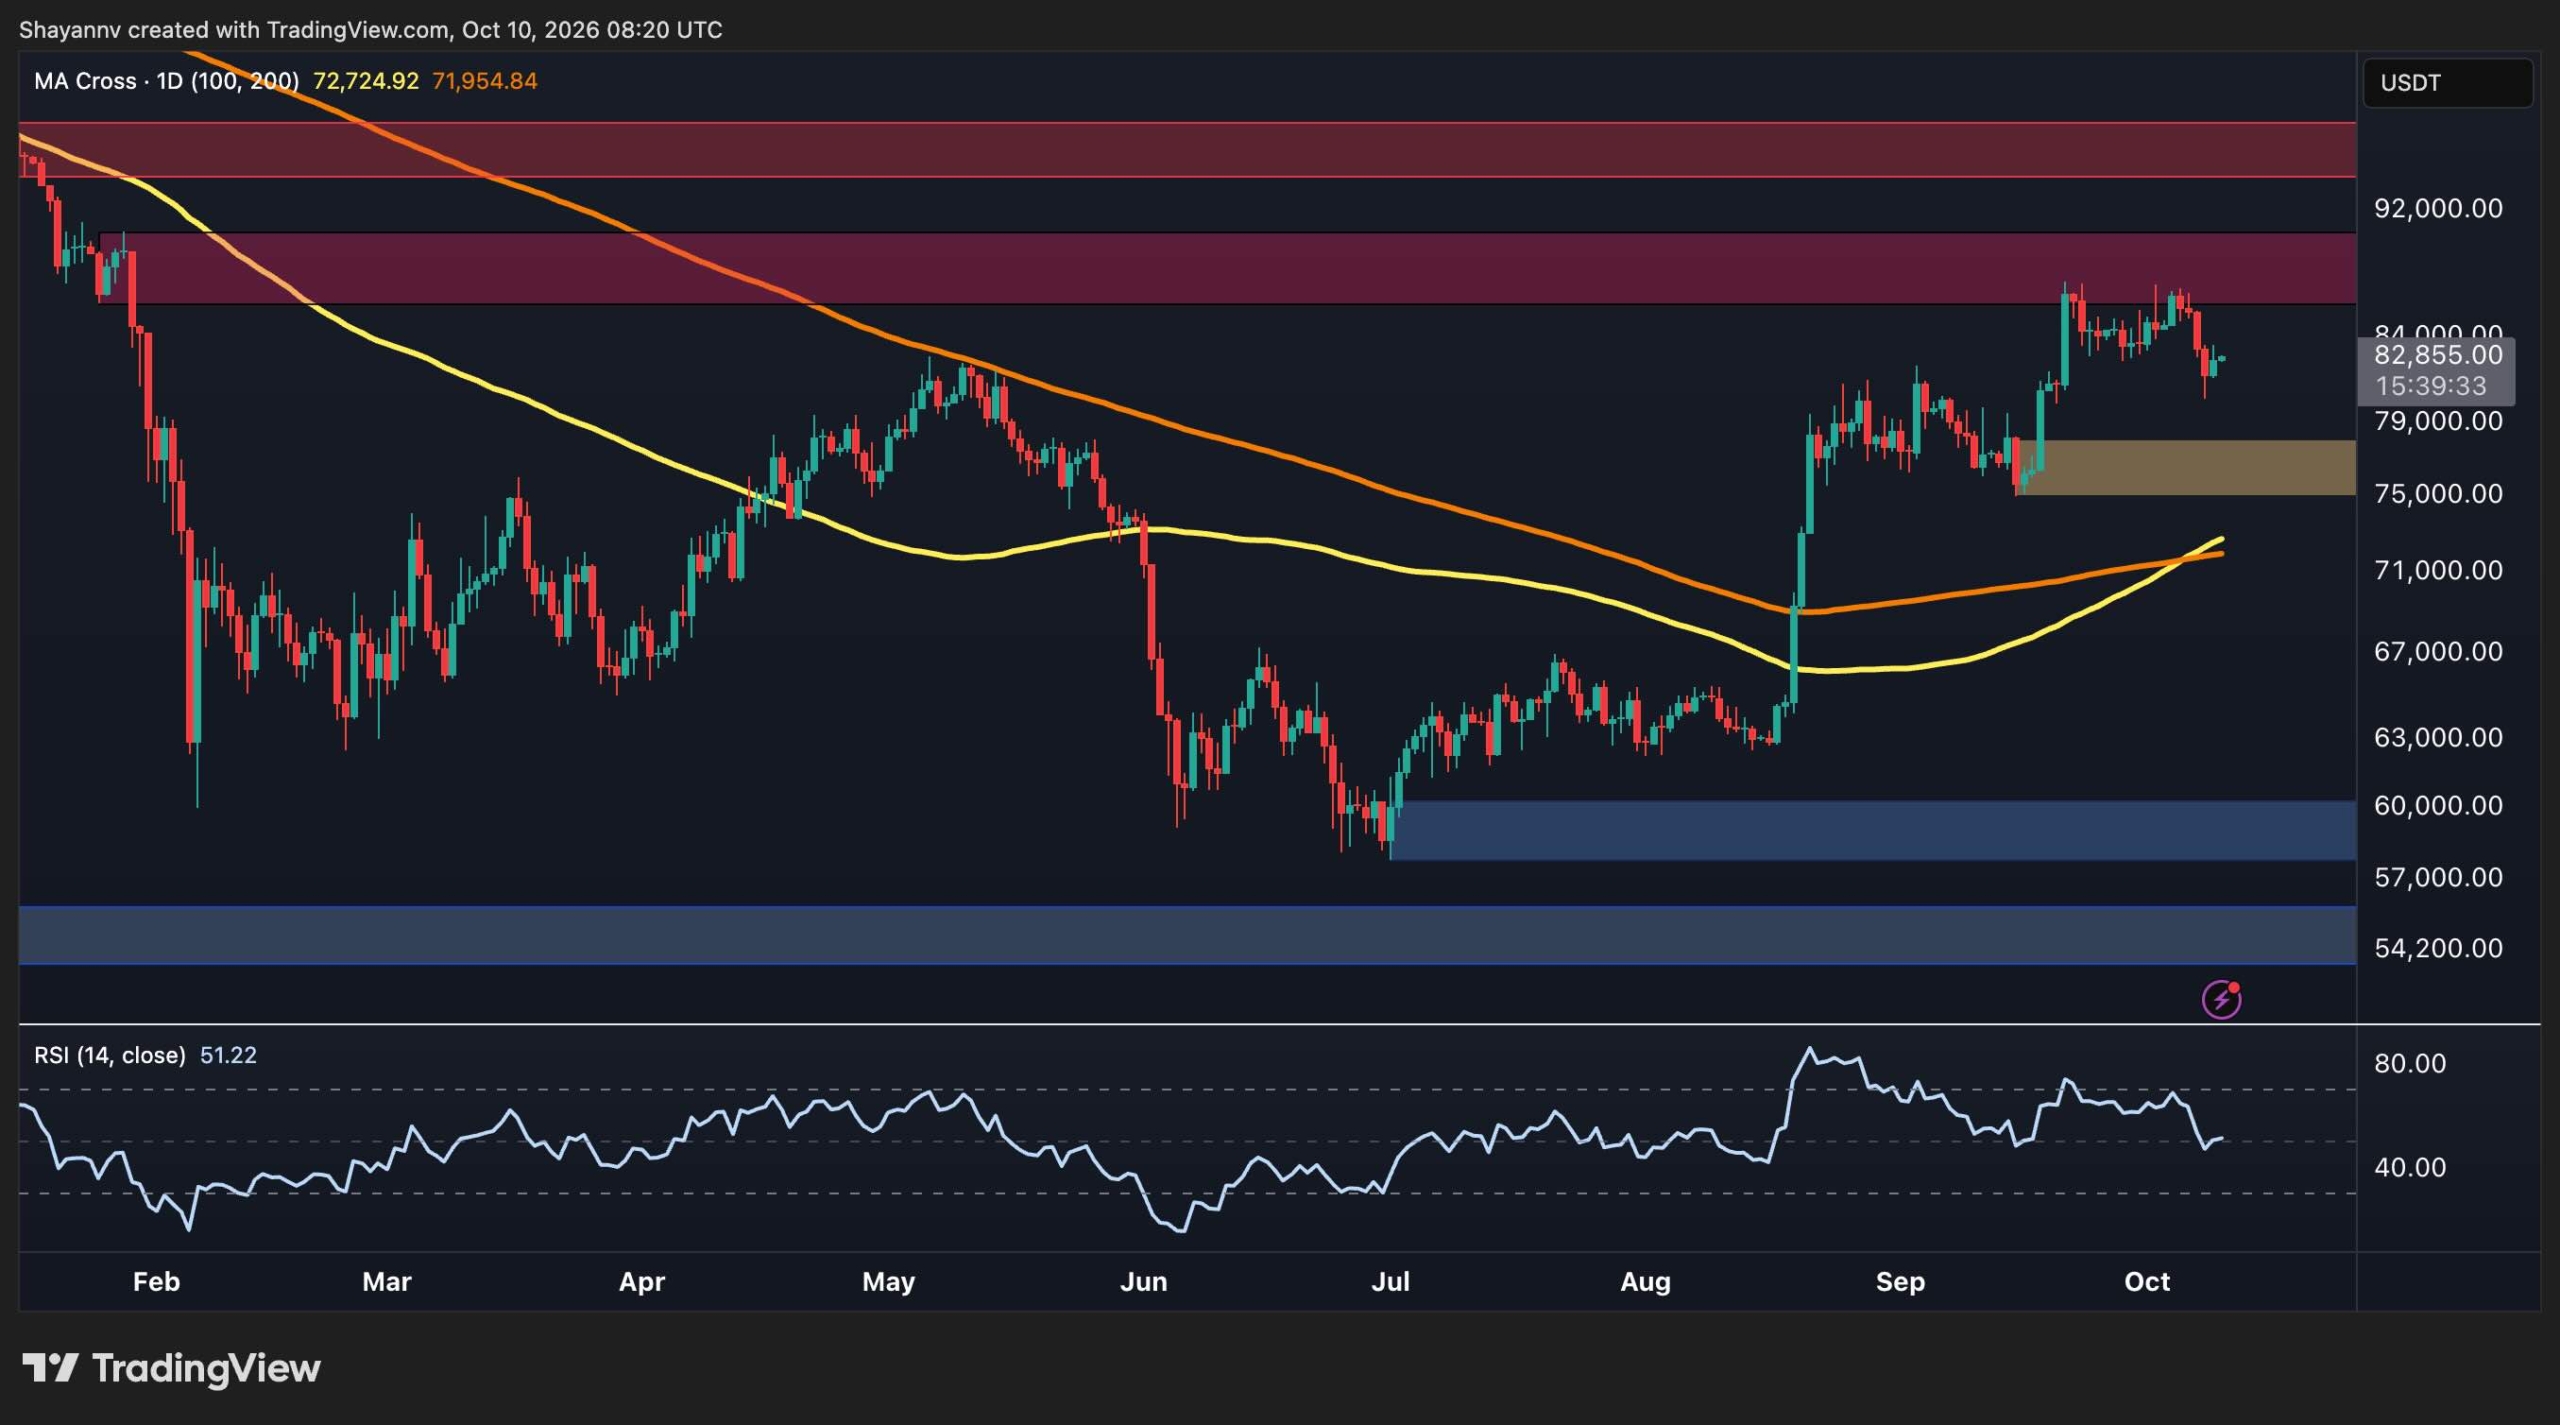
    Bitcoin is currently trading around $83,000, following a rejection from the $86,000 to $90,000 resistance zone, which has weakened its short-term structure. Concurrently, the Coinbase Premium Index has turned sharply negative, suggesting a potential waning of U.S.-based buying demand. While Bitcoin is attempting to stabilize, buyers must reclaim nearby resistance levels to improve the cryptocurrency’s outlook.

    Bitcoin’s Recovery Faces Resistance

    Bitcoin’s daily chart illustrates a significant recovery from its June lows near $58,000 to recent highs around $86,000. However, this rally has encountered robust resistance, and recent price action indicates that sellers are regaining short-term control.

    BTC has been rejected at the $86,000 to $90,000 resistance zone, with the lower boundary of this area, approximately $86,000, serving as the immediate hurdle for any renewed advance. A broader resistance level is observed around $95,000, which would become relevant should Bitcoin reclaim the nearer supply zone and resume its upward trajectory.

    Despite these headwinds, the price remains above the 100-day and 200-day moving averages, both currently situated near $72,000, following a bullish crossover. While BTC is comfortably trading above these averages, their recent crossover and upward trend reflect an improved medium-term structure after the summer’s recovery. These moving averages could emerge as significant dynamic support if the current correction deepens, but they are not immediate downside targets as long as the market stays above nearer support zones.

    The first critical downside area to monitor is the $77,000 demand zone, established by the bullish order block that fueled the final leg of the recent rally. A loss of this area, coupled with a price close below $75,000, would undermine the recovery structure and expose the aforementioned moving averages around $72,000.

    For the time being, the daily structure remains in a recovery phase. However, the rejection from resistance and a potential loss of short-term support could signal that Bitcoin may require a deeper correction before attempting another upward move.

    Short-Term Outlook Deteriorates

    On the 4-hour chart, Bitcoin has broken below a rising wedge pattern after being rejected from the $86,000 region. This breakdown below the pattern’s lower trendline suggests a bearish resolution for the pattern, at least in the short term.

    Following the breakdown, BTC experienced a decline towards the $80,000 area before staging a modest rebound to approximately $83,000. This recovery indicates buyers are attempting to stabilize the price, but the bounce appears limited, with a bearish order block forming near $85,000 that could exert downward pressure on the asset once more.

    On the downside, the $80,000 low represents the nearest level where buyers have recently intervened. A loss of this zone would lead to the next significant support being the $75,000 to $78,000 demand area, which is also visible on the daily chart.

    The 4-hour Relative Strength Index (RSI) has recovered from oversold territory and is now in the mid-40s, suggesting that selling momentum has somewhat eased. However, it remains below the neutral 50 level, indicating that the rebound has not yet established convincing bullish momentum.

    Consequently, the short-term outlook remains cautious. Bitcoin could continue to consolidate between $82,000 and $84,000 if buyers successfully defend recent lows. However, another rejection below $86,000, followed by a break under $80,000, would increase the probability of a deeper move towards the $75,000 to $78,000 demand zone.

    Coinbase Premium Index Signals Weakening Demand

    The Coinbase Premium Index chart reveals a sharp negative turn in its latest reading, falling to approximately -0.1 while Bitcoin trades near $82,700. This index measures the price difference between Bitcoin on Coinbase and a comparable market price. A negative reading generally signifies that BTC is trading at a discount on Coinbase relative to the reference market.

    A consistently positive premium can signal stronger buying pressure on Coinbase, often associated with U.S. spot demand. Conversely, a negative premium suggests weaker relative demand or stronger selling pressure on the platform. It is important to note that this metric is not a direct measure of total U.S. investor flows and can also be influenced by variations in liquidity and market conditions across exchanges.

    The recent deterioration is noteworthy as it coincides with Bitcoin’s rejection from the $86,000 resistance region and its subsequent breakdown from the 4-hour rising wedge. The alignment between weakening price structure and a negative Coinbase Premium suggests that spot demand may not be robust enough to support an immediate continuation of the rally.

    The index has exhibited repeated swings between positive and negative territory throughout its history, so the latest decline should not be interpreted as definitive proof of sustained distribution. Nevertheless, a continued negative premium alongside further price weakness would bolster the bearish case, particularly if BTC loses the $80,000 support area.

  • Bitcoin ETF Inflows Surge to $3 Billion in Eight Days as Institutions Re-enter

    Bitcoin ETF Inflows Surge to $3 Billion in Eight Days as Institutions Re-enter

    Bitcoin ETFs See Strong Inflows, Erasing Year-to-Date Deficit

    US spot Bitcoin exchange-traded funds (ETFs) experienced a significant surge in net inflows, attracting approximately $3 billion between September 17 and September 25, 2026. This period marked one of the most robust buying stretches since the funds launched in January 2024, successfully reversing months of stagnant or negative flow trends.

    The recent influx of capital managed to achieve what previous months of trading could not: it pushed the year’s total net flows out of negative territory. Notably, hedge funds, often perceived as key drivers of rapid ETF surges, appeared to play a minimal role this time. The buying activity suggests a broader institutional return to the asset class rather than a short-term speculative play by trading desks.

    Peak Week Drives Significant Inflows

    The strongest week within this period alone saw net inflows of $2.4 billion, representing the largest weekly haul since October 2025. BlackRock’s iShares Bitcoin Trust (IBIT) emerged as the leading performer, capturing around $1.2 billion in inflows during that peak week. Fidelity’s FBTC followed with approximately $702 million, and the ARK 21Shares Bitcoin ETF (ARKB) added about $295 million. The single largest day for inflows occurred on September 21, 2026, when the funds collectively attracted nearly $999 million.

    Reversal of Fortunes for ETF Flows

    This rebound is particularly significant when viewed against the backdrop of the funds’ performance earlier in the year. By mid-July, the spot Bitcoin ETFs were facing a year-to-date deficit of approximately $5.8 billion. However, by the end of September, this deficit had transformed into a modest net positive of about $934 million. The surge in inflows coincided with a recovery in Bitcoin’s price, which traded between $82,000 and $87,000 during the observed period.

    Third Quarter Outperforms

    Looking at the broader picture, the third quarter of 2026 proved to be exceptionally strong, recording $6.34 billion in Bitcoin ETF inflows, the highest quarterly total for the year. By early October 2026, cumulative net inflows since the ETFs’ inception had reached approximately $57 billion to $58 billion, with total assets under management hovering around $105 billion to $110 billion.

    Outflows Resume, Signaling Market Volatility

    However, this period of strong inflows proved temporary. Net outflows resumed in early October 2026, with a notable $244 million outflow recorded on October 8.

    The Significance of Institutional Demand

    The debut of spot Bitcoin ETFs in January 2024 offered traditional investors a novel way to gain exposure to Bitcoin through familiar brokerage accounts, bypassing the need for cryptocurrency exchanges or managing private keys. The nature of the buyers is crucial in determining the sustainability of any rally. Hedge fund activity, often driven by basis trades that exploit price differentials between ETFs and futures, can be volatile and unwind quickly. In contrast, broader institutional demand, where Bitcoin is added as a strategic portfolio allocation rather than a short-term trade, tends to be more stable and less prone to rapid exits.

    The late-September data strongly suggests the latter scenario, indicating that institutions are viewing Bitcoin as a legitimate long-term holding. The significant reduction of the year-to-date deficit underscores this sentiment, implying that institutions perceive Bitcoin as more than just a speculative asset.

    BlackRock Leads, but Caution Remains

    BlackRock’s IBIT continued to solidify its leading position, accounting for a substantial portion of the peak-week inflows. However, the subsequent outflows in October serve as a reminder that market sentiment can shift rapidly. The $244 million outflow on October 8 highlights the potential for swift reversals.

    Bitcoin’s price range during the inflow period, between $82,000 and $87,000, also warrants attention. Investors will be closely watching whether the early October outflows represent a temporary pause or a more significant trend reversal. If the year-to-date total of approximately $934 million dips back into negative territory, the September surge may be characterized as a relief rally rather than the start of a sustained upward trend. Conversely, a resumption of inflows and a push past the $57 billion to $58 billion cumulative mark would strengthen the case for continued institutional adoption of Bitcoin.

  • Bitcoin Still Reeling One Year After Crypto’s Largest Liquidation

    Bitcoin Still Reeling One Year After Crypto’s Largest Liquidation

    October’s Double-Edged Sword: Remembering Crypto’s Worst Liquidation Day

    October has long been dubbed “Uptober” in cryptocurrency circles, a period historically associated with significant gains. Last year, however, the month delivered a starkly contrasting experience. While Bitcoin (BTC) surged to a then-record high, it also witnessed its most devastating liquidation event, the first anniversary of which falls this weekend.

    The Peak and the Precipice

    In the days leading up to October 10, 2025, Bitcoin was on an upward trajectory, living up to the “Uptober” moniker. The cryptocurrency reached its latest all-time high of approximately $126,000 on October 7. Analysts and staunch supporters of the market enthusiastically celebrated the surge, projecting further gains to $200,000 or even $500,000 by year-end.

    A Violent Correction

    The reality proved far more severe. On October 10, 2025, escalating US-China trade tensions, among other factors, triggered a sharp sell-off. This downturn was amplified by a massive amount of leveraged positions, leading to what is estimated to be the worst liquidation event in the 16-year history of the cryptocurrency industry. Within a 24-hour period, the value of liquidated positions reportedly exceeded $19 billion.

    Bitcoin spearheaded this decline, plummeting from around $122,000 to $105,000 on most exchanges, and even dipping to $101,000 on some. Over 1.6 million traders were caught off guard and saw their positions liquidated. The timing of the crash was particularly brutal, occurring just 48 to 72 hours after Bitcoin had achieved its record high above $126,000. Today, that peak price seems like a distant memory.

    The Lingering Aftermath

    That crash marked the beginning of a prolonged bear market, which saw Bitcoin’s price fall below $58,000 by July 1. In the months following its most significant liquidation event, Bitcoin experienced a 53% decline. It currently trades in the $82,000 to $83,000 range, still approximately 34% below its 2025 peak.

    While the market sentiment has improved considerably since July, some cautionary signs remain. A recent correction saw Bitcoin dip from $87,000 to $80,400 before recovering to current levels. On a more positive note, at least five indicators tracked by BIT have recently shifted into territory typically associated with bullish market conditions.

    Lessons Unlearned?

    The events of October 10, 2025, serve as a critical reminder. Ideally, it would offer a valuable lesson to traders who tend to overcommit during market upturns and retreat entirely during downturns. However, a pullback last week, which saw over $1 billion in leveraged positions wiped out in less than a day, suggests that some may not have fully absorbed the impact of that historic liquidation event.

  • Solana CEO: China’s Crypto Return May Spark Next Super Cycle

    Solana CEO: China’s Crypto Return May Spark Next Super Cycle

    Solana CEO Predicts China’s Crypto Reopening Could Spark New Market Super Cycle

    Solana Company CEO Joseph Chee has suggested that China’s potential return to the cryptocurrency market could ignite another significant bull run, a move that would have far-reaching implications for the global digital asset landscape. Beijing is reportedly leveraging Hong Kong as a testing ground for its cryptocurrency regulations, signaling a strategic approach to managing digital assets.

    China’s Strategic Approach to Blockchain and Digital Assets

    Chee emphasized in a recent interview that China cannot afford to overlook the transformative potential of blockchain technology, despite its current restrictions on cryptocurrency trading. “They are using Hong Kong as the region to test how the technology will be implemented and are going to find ways to manage it,” he stated.

    Hong Kong is actively serving as a hub for Web3 development, with approvals for regulated spot ETFs, enhanced audit requirements for virtual asset service providers (VASPs), and the development of stablecoins like HSBC’s RedCoin. This measured approach allows mainland China to observe the functioning of crypto markets under stricter oversight before considering broader access.

    Chee believes that an increase in crypto trading and blockchain adoption in China could lead to a substantial market shift. “I think the crypto is going to go through another super cycle,” he predicted. He highlighted Asia’s significant population and its early involvement in crypto adoption, noting that China’s past restrictions had hampered this growth while the U.S. market assumed a more dominant role.

    Significant Bitcoin Holdings and Mining Influence

    Despite a ban on crypto trading in 2021, China is estimated to hold approximately 190,000 Bitcoin in government-linked wallets, valued at around $15.7 billion. While not officially purchased as a strategic reserve, these holdings position China as one of the world’s largest government-linked Bitcoin owners.

    Furthermore, China maintains a strong connection to Bitcoin mining. Estimates suggest that China-linked miners control between 14% and 20% of the global Bitcoin mining power. A policy shift towards reopening could therefore reintroduce Chinese traders and companies as significant players in the market. Chee is confident that China will ultimately devise a method for managing cryptocurrencies.

    Broader Blockchain Integration Beyond Trading

    Beyond cryptocurrency trading, China is actively developing blockchain technology for diverse applications. A 19-measure policy, as reported by Xinhua, aims to establish a nationwide blockchain and computing infrastructure. This initiative focuses on integrating blockchain into manufacturing, banking, and data sharing, while also refining data ownership rules and cross-border data flows. This indicates Beijing’s continued exploration of blockchain applications, even as access to cryptocurrencies remains limited.

  • Bitcoin Rally Boosts Confidence Amidst Lagging Open Interest

    Bitcoin Rally Boosts Confidence Amidst Lagging Open Interest

    Bitcoin Stages a Comeback, But Leveraged Traders Remain on the Sidelines

    The world’s largest cryptocurrency has experienced a significant rebound, climbing approximately 35% from its August 2026 lows near $63,500 to reach the $83,000-$84,000 range by late September. However, this rally has not been accompanied by a corresponding increase in futures open interest, which remains below its previous peak.

    Open interest, a measure of the total value of outstanding futures contracts, typically rises in tandem with price as traders place new bets. A divergence, where price increases but open interest falls, signals a quieter market despite improving scores. This is precisely what has occurred, with futures open interest, measured in Bitcoin terms, declining by nearly 20% during the recent price surge.

    A Significant Pullback in Leveraged Positions

    Analysts at Bitfinex noted that aggregate BTC futures open interest dropped to approximately 625,000 BTC. This represents a substantial reduction in leveraged positions and a notable low for the year 2026. Measuring open interest in BTC rather than U.S. dollars provides a clearer picture, as rising prices can artificially inflate dollar-denominated open interest. Counting in coins effectively removes this effect, revealing whether overall positioning is expanding or contracting.

    Liquidation Event Fuels Decline

    A significant portion of this decline can be attributed to a liquidation event on August 19, 2026. The derivatives market experienced a sweep, with 85% of liquidations targeting short positions. In the immediate aftermath of this event, open interest contracted by 11%.

    Spot Demand Powers the Rally

    Beyond the liquidation squeeze, the rally appears to have been primarily driven by demand in the spot market. Reports indicate institutional inflows into exchange-traded funds (ETFs) and short covering, rather than new leveraged long positions being opened by traders.

    Stabilization and Shifting Dynamics

    By early October, Bitcoin had settled into a trading range between $82,000 and $85,000. ETF flows fluctuated, and open interest ceased its decline, beginning to stabilize. Across various trading venues, perpetual futures open interest, in notional terms, ranged between $35 billion and $54 billion during this period.

    The Double-Edged Sword of Lower Leverage

    The reduction in leverage has both positive and negative implications. On the upside, fewer overextended positions reduce the risk of sudden liquidation cascades. However, the trade-off is speed. Leverage is typically what transforms a solid rally into an explosive one. Without renewed participation from derivatives traders, the potential for sharp, rapid price gains appears limited unless new capital enters the market.

    Key Signals for Traders

    For traders, ETF flow data is likely the most critical indicator to monitor. The October trading range of $82,000 to $85,000 coincided with swings in these flows, suggesting that institutional demand is currently dictating the market’s pace.

    Open interest serves as a secondary gauge. A gradual rebuilding of BTC-denominated open interest, coupled with steady spot demand, would signal renewed conviction in the market. Conversely, a sudden surge in leverage without corresponding spot buying could reintroduce the fragility that the market has been shedding in recent months.

    Cautious Optimism Prevails

    The current market setup suggests a reason for cautious optimism. Rising prices, reduced leverage, and consistent institutional participation could pave the way for more sustainable growth, punctuated by occasional periods of volatility.

  • Strive Adopts Saylor’s Strategy, Secures Funds for 638 Bitcoin

    Strive Adopts Saylor’s Strategy, Secures Funds for 638 Bitcoin

    Strive’s preferred stock, designed to track Bitcoin’s performance, generated an estimated $55 million this week. This sum is sufficient to purchase approximately 638 Bitcoin, despite the shares trading below the issuance stop price for three out of the five trading days.

    Bitcoin Acquisition Details

    The figure of 638 Bitcoin is derived from a weekly dashboard snapshot that presents three key metrics.

  • NEAR Rockets 10% Daily, BTC Eyes $83K: Weekend Watch

    NEAR Rockets 10% Daily, BTC Eyes $83K: Weekend Watch

    Bitcoin Recovers Ground After Sharp Decline, Nearing $83,000

    Bitcoin’s price is continuing its recovery from a significant Thursday downturn, currently trading just below the $83,000 mark after hitting a multi-week low of under $80,500.

    Altcoins Show Mixed Performance

    Most larger-cap altcoins have experienced sluggish daily trading. Ethereum (ETH) is struggling to break above $2,500, while XRP is barely holding onto the $1.40 support level. However, Cardano (ADA) and NEAR Protocol (NEAR) have both posted notable gains.

    Volatile Week for Bitcoin

    The business week began positively for the primary cryptocurrency, with Bitcoin surging several thousand dollars on Monday morning to reach $87,000 for the first time since the previous Friday. However, similar to the end of the prior week, this upward momentum was short-lived, and Bitcoin quickly retreated to $85,000.

    Bulls attempted another rally, challenging the same resistance level. This time, however, bears intervened more aggressively, triggering a sharp decline. Instead of another bounce, Bitcoin slumped below $84,000 on Tuesday. Wednesday saw little recovery, and by Thursday, bulls had lost significant control of the market.

    Significant Price Drop and Rebound

    At its lowest point, Bitcoin crashed by several thousand dollars, dipping to a multi-week low of $80,400. Following this nearly $7,000 decline within days, the cryptocurrency finally rebounded, jumping to $83,400 yesterday. It encountered resistance at that level and is now trading just below $83,000.

    Bitcoin’s market capitalization has fallen to $1.660 trillion, according to CoinMarketCap, but its dominance over altcoins has surged to 59.5%.

    Ethereum and XRP Movements

    Ethereum slipped to $2,400 during the broader market crash and has since recovered slightly to nearly $2,500, though it remains distant from its recent peak of $2,800. XRP dipped to $1.34 before rebounding to its current level of $1.41. Binance Coin (BNB) has returned to $750 after a modest daily increase, mirroring movements seen in Dogecoin (DOGE) and Chainlink (LINK).

    Notable Altcoin Gains

    In contrast, Solana (SOL), Tron (TRX), and Hype (HYPE) are trading slightly in the red. Cardano’s ADA has seen a 7% rebound, reclaiming the $0.255 level. NEAR Protocol’s native token has experienced the most significant rise among larger-cap altcoins, surging over 10% to $5.25. Polkadot (DOT), Worldcoin (WLD), BitTorrent (BTT), and WOLF have also recorded notable gains.

    The total cryptocurrency market capitalization shed $200 billion from its peak but has since rebounded slightly to $2.8 trillion on CoinMarketCap.