Tag: Market Trends

  • XRP Flashes Rare Binance Buy Signal Amidst Market Surge

    XRP Flashes Rare Binance Buy Signal Amidst Market Surge

    XRP is currently attempting to regain the $1.15 mark following a significant downturn that saw its price plummet to its lowest point since 2024. This decline has effectively nullified months of recovery progress, leaving investors in a market environment with little immediate clarity on future direction.

    Amidst this attempted rebound, an analysis by Arab Chain, which tracks trading volume on Binance, has identified a key signal within the data. This signal provides crucial context for both the recent price drop and the ongoing recovery efforts.

    Volume Surge on Binance

    The XRP Volume Z-Score on Binance, a metric that quantifies how current trading activity deviates from the 30-day average, recently spiked to approximately 4.5. This represents the highest reading in four months. A Z-Score of this magnitude indicates trading activity significantly exceeding the recent baseline, a phenomenon typically associated with major price events, forced liquidations, or substantial repositioning by large market participants.

    However, this surge proved to be short-lived. The index rapidly retreated from its peak of 4.5 and has since fallen to around -0.70, suggesting current trading activity is now below the 30-day average. The exceptional volume spike appeared, influenced price action, and then dissipated as swiftly as it emerged.

    Arab Chain’s analysis delves into what this sequence—a sharp volume surge followed by a rapid return to normal levels—reveals about the nature of XRP’s recent decline and whether the current recovery attempt possesses sufficient trading momentum to sustain prices above $1.15.

    Volume Spiked While Price Fell

    The Arab Chain analysis directly links the volume surge to the price decline, shedding light on the selling dynamics that drove XRP to its lowest point since 2024. The Z-Score reaching 4.5 while the price was falling towards $1.13 points to a specific market condition: elevated participant activity concentrated on selling rather than buying. This drove volume higher as transactions were executed at scale in a downward price direction.

    The analytical interpretation is straightforward: a sharp increase in trading volumes coinciding with a price drop typically signals one of two scenarios. Either accelerated selling pressure from participants eager to exit at any available price, or large-scale repositioning by significant holders adjusting their XRP exposure in response to evolving market conditions. Both scenarios result in volume spikes during price declines but carry different implications for subsequent market movements.

    The volatility context identified by the analysis is a forward-looking element worth monitoring. Historically, elevated volume activity accompanying sharp price movements has often been followed by continued volatility rather than immediate stabilization. The repositioning or selling that fueled the initial volume surge tends to create ripple effects as the market adjusts to the new supply and demand balance established during the high-volume session.

    XRP, in its attempt to reclaim $1.15 in the wake of a 4.5 Z-Score volume event, is striving for recovery within a market structure that has recently undergone a fundamental repricing. The speed at which volume normalized below the 30-day average suggests that the exceptional activity has concluded rather than merely paused.

    XRP Price Testing Fresh Lows

    XRP is currently attempting to stabilize around the $1.15 level after experiencing one of its most significant corrections since the 2024 breakout. The weekly chart indicates that sellers have erased nearly all of the gains achieved in the first half of 2025, pushing the asset back towards a critical long-term support zone.

    A key technical development is XRP’s test of the 200-week moving average, which is currently situated between $1.10 and $1.15. This moving average has historically served as a major trend-defining level. The current weekly candle is attempting to hold above this threshold despite the recent wave of selling pressure. A failure to hold this level would significantly weaken the broader market structure, potentially exposing XRP to a move towards the psychological $1.00 mark and possibly the $0.85–$0.90 region.

    From a trend perspective, XRP remains bearish. The price is trading below both the 50-week and 100-week moving averages, with these averages continuing to trend downwards. The rejection from the $1.40–$1.50 area in recent weeks confirmed that sellers are still in control and that recovery attempts are being met with further selling. For bullish sentiment to return, XRP needs to reclaim $1.30 and then $1.50 to begin rebuilding momentum. Until then, the focus remains on whether XRP can defend the 200-week moving average and prevent a deeper decline below $1.10.

  • XRP Surges Past $10: Data Confirms Bullish Trajectory

    XRP Surges Past $10: Data Confirms Bullish Trajectory

    XRP Faces Potential Liquidity Sweep Before Significant Upside, Analyst Suggests

    XRP’s price has experienced considerable downward pressure in recent days, mirroring broader market trends. The cryptocurrency has retreated to a critical support zone around $1.10, with sellers maintaining control of short-term momentum. This decline has positioned XRP squarely within a significant area on its long-term monthly candlestick chart.

    XRP in a “Face-Melting Phase”

    Technical analysis by crypto analyst EGRAG CRYPTO indicates that XRP may undergo one final liquidity sweep before embarking on a substantial rally potentially exceeding $10. EGRAG’s assessment is based on XRP’s behavior on higher timeframes, specifically around the 50-month and 100-month exponential moving averages (EMAs).

    According to the analyst, XRP has historically followed a recurring pattern after decisively losing the 50 EMA. This breakdown is typically characterized by weak momentum, emotional selling, and a concluding liquidity sweep towards the 100 EMA before a new rally commences.

    The current monthly candle has opened below the 50 EMA, placing XRP’s price action in a precarious position. This scenario, described as a “face-melting phase,” suggests a possibility of further decline towards the 100 EMA as the market continues to seek its macro bottom. EGRAG’s projected path anticipates further downside, with charts indicating a potential drop below $1.

    Building a Position Amidst Uncertainty

    Intriguingly, while anticipating further declines, EGRAG CRYPTO is actively accumulating XRP. Instead of waiting for a confirmed reversal, the analyst is building a position across a range of entry prices, including $1.09, $0.92, $0.85, and even $0.70, treating each level as a potential probability zone.

    Projections Point to Over $10

    Beyond the immediate downside potential, EGRAG’s analysis highlights significant upside targets. The projected recovery path suggests XRP could break above its current cycle high of $3.65. The charts indicate potential upside levels at $9, $13, $17, $20, and $27.

    EGRAG emphasizes that the precise bottom may become less critical if XRP ultimately reaches these projected bullish targets. The analyst argues that effective risk management is more crucial than pinpointing the exact bottom. His strategy illustrates that entering at lower prices like $1.09, $0.92, $0.85, or $0.70 would yield substantial returns if XRP reaches targets of $7, $8, $13, or even mid-double-digit figures.

    At the time of reporting, XRP was trading at $1.14, marking a 12% decrease over the past seven days. A move from the current price to $10 would necessitate a rally of approximately 777%. Reaching $13 would represent a gain of over 1,040%, while a surge to the $27 level on the chart would require XRP to increase by more than 2,260% from its current trading range.

  • ChatGPT XRP Price Prediction Defies Logic

    ChatGPT XRP Price Prediction Defies Logic

    ChatGPT AI Flags XRP Price Prediction, Targeting $3 to $7

    A recent analysis from ChatGPT AI has put forth a bold price prediction for XRP, suggesting a potential reclaim of the $3 to $5 range, with an ambitious stretch target near $7 within the current cycle. This forecast stands in stark contrast to XRP’s current trading price of approximately $1.14, implying a significant threefold to sixfold increase from a level that has left many holders frustrated.

    The Bull Case: A Shift in Sentiment and Fundamentals

    The optimistic outlook for XRP hinges on a fundamental shift in market sentiment. While it might seem improbable now, just in late 2024, the idea of XRP holders being dissatisfied with prices above $1 would have been met with disbelief.

    The broader cryptocurrency market has lagged behind the strong performance of traditional stocks. However, this mirrors past cycles where the sector was prematurely declared dead before a significant sentiment turnaround.

    From a fundamental perspective, XRP is arguably in its strongest position ever. This is attributed to improved regulatory clarity, growing institutional interest, expanding utility, and a more mature market structure. Should capital begin to flow back into cryptocurrencies through 2026 and risk appetite increase, the predicted reclaim of the $3 to $5 range and a push towards $7 appears plausible.

    The Bear Case: A Slow Grind, Not a Collapse

    Conversely, the bearish scenario anticipates a slower, grinding market rather than a sharp collapse. If adoption rates continue to trail expectations and capital remains concentrated in Bitcoin and equities, XRP could find itself trading between $1 and $2 for an extended period.

    This scenario highlights the challenge for a coin with sound fundamentals but a lack of fresh capital inflows. Nevertheless, from a risk-reward perspective, XRP appears to be closer to a point of capitulation than euphoria. Historically, such periods have often preceded significant price movements.

    Chart Analysis: A Beaten-Down Landscape

    Currently, XRP’s daily chart shows the price at $1.14, a considerable drop from its July high of $3.60. The technical structure exhibits a clear pattern of lower highs and lower lows, indicative of a downtrend that recently printed a local low near $1.05. This descending staircase pattern suggests that the price is attempting a minor bounce from this low.

    Key support levels are identified at $1.10, with the next significant support zone around $1.00 and major demand emerging at $0.80. Resistance is stacked at $1.40, followed by $1.60, and a more substantial zone at $1.80.

    The Relative Strength Index (RSI) is currently at 30.88, with its signal line at 32.19. This indicates that momentum is just below average and pressing into oversold territory. The narrow gap between the RSI and its signal line suggests that selling pressure is waning rather than intensifying. A move back above 32.19 would be the initial signal that the downward trend is losing steam.

    In summary, the chart reflects a deeply oversold asset, which aligns with the conditions required for the ChatGPT AI’s prediction. A reclaim of the $1.40 resistance level could open the door for a move towards $3 and beyond.

    The Importance of Positioning in Crypto Cycles

    Market cycles do not reward patience at resistance levels; they reward strategic positioning before a significant move. Bitcoin, Ethereum, and XRP are all testing resistance bands that have held them back for weeks. Macroeconomic catalysts, such as key data prints, and institutional inflows are always on the horizon, often just a quarter away. The current ceiling for these large-cap assets is visible, and waiting for a breakout often means relying on decisions made by others.

    Early-Stage Infrastructure and Undiscovered Opportunities

    Early-stage infrastructure projects operate in a different market dynamic. Capital that would have a negligible impact on Bitcoin’s price can dramatically reprice smaller-cap projects. The opportunity lies in the discrepancy between a project’s intrinsic value and its current market valuation, a gap that exists primarily while the project remains undiscovered. Once discovered, this gap tends to close permanently.

    LiquidChain: Addressing Multi-Chain Fragmentation

    The fragmentation of multi-chain ecosystems has been a persistent issue in decentralized finance (DeFi) since the inception of cross-chain bridges, with no effective solution yet implemented. Bitcoin, Ethereum, and Solana were built as independent systems lacking native interoperability. Every transaction that crosses these boundaries incurs costs in fees, slippage, and execution failures. Bridges, rather than solving the problem, have effectively monetized it.

    LiquidChain aims to eliminate this issue by consolidating three networks into a single execution layer. Developers can deploy applications once, and users can interact across all ecosystems without incurring cross-chain transaction taxes.

    ChatGPT AI has identified LiquidChain as a project worth monitoring. Its presale is currently priced at $0.01454, with over $820,000 raised.

    It is important to acknowledge the inherent execution risks and unproven adoption for LiquidChain. Established assets offer a more predictable path to a ceiling that is already largely priced in. LiquidChain represents an opportunity to participate in a nascent ecosystem that is still under development.

  • Analyst Predicts XRP Surge to $27 by 2026

    Analyst Predicts XRP Surge to $27 by 2026

    Analyst Predicts Significant XRP Gains Following Potential 2026 Bottom

    Technical analyst ChartNerd has presented an analysis suggesting that the current bear market for XRP may be less severe and shorter than previous cycles. According to the analyst’s breakdown shared on June 8, there is a possibility of a cycle bottom forming before the end of 2026, which could pave the way for XRP to eventually reach $27.

    Historical Bear Market Trends and Current Conditions

    ChartNerd’s research indicates that historical XRP bear markets have typically spanned between 400 and 790 days, with price drops ranging from 85% to 90% from their peaks. In contrast, the current correction, as of the analysis, has lasted approximately 350 days and represents a nearly 70% decrease from the all-time high of $3.65 recorded in July 2025.

    The analyst highlighted that both the duration and the magnitude of the current drawdown are milder compared to historical patterns. ChartNerd views this trend of decreasing severity as a significant indicator.

    “The territory for marking a historical bottom between now and EOY is fast approaching,” ChartNerd stated. “These prices are where we need to start paying attention to the fact that although the chances of an immediate expansion might be low, a cycle bottom could genuinely be on the horizon.”

    Potential for Further Downside and Future Targets

    Despite the optimistic outlook, ChartNerd did not entirely dismiss the possibility of further price declines for XRP. The analyst suggested that additional market pain in the coming months might be necessary to establish the definitive cycle low. This would then be followed by an accumulation phase, leading to a potential ascent towards Fibonacci extension targets of $8, $13, and $27.

    An exception to this observed pattern was noted in the 2014 bear market. During that cycle, XRP experienced a 96% drop over approximately 210 days to reach its low. However, it subsequently took over 1,200 days for XRP to surpass its previous high, with a significant wick low appearing in late 2017 before a peak in January 2018.

    Recent Price Action and ETF Inflows

    At the time of reporting, XRP was trading around $1.15, marking a roughly 12% decrease from the previous week and a 19% drop from the month prior. In the past week, the Ripple token touched a 19-month low of $1.05 before experiencing a brief rally to $1.20, followed by a slight pullback.

    Amidst this recent volatility, spot XRP Exchange-Traded Funds (ETFs) presented a positive development, closing the last week with net inflows totaling $2.62 million. This figure is noteworthy, especially when contrasted with Bitcoin ETFs, which saw outflows exceeding $1.7 billion during the same period, and Ethereum ETFs, which experienced outflows of $173 million.

    Among other cryptocurrency ETFs, only HYPE ETFs demonstrated stronger performance, attracting nearly $17 million. Funds tracking Litecoin (LTC), Avalanche (AVAX), and Hedera (HBAR) reported no significant activity.

  • Hayes Denies $2M HYPE Buy Allegation

    Hayes Denies $2M HYPE Buy Allegation

    Hayes Denies $2 Million HYPE Token Purchase Amidst Community Backlash

    BitMEX co-founder Arthur Hayes has reportedly denied purchasing 33,978 HYPE tokens, valued at approximately $2.09 million, a transaction flagged by blockchain analytics firm Lookonchain. The firm had linked the alleged acquisition to a wallet associated with Hayes, which reportedly withdrew the tokens from Bybit on Monday during Asian trading hours.

    This alleged purchase surfaced just four days after Hayes announced he had divested his entire HYPE holdings to secure profits while the token was trading above $72.

    Following the initial report from Lookonchain, the HYPE token saw a brief surge of 2%. However, Hayes himself responded to the update with a terse denial on social media, tweeting, “I didn’t buy s**t.”

    After Hayes disclosed his earlier sale, HYPE experienced a temporary dip to $54. The token has since shown signs of recovery, trading above $61 at the time of this report.

    Hyperliquid, the platform associated with the HYPE token, has rapidly ascended to become a prominent derivatives exchange since its 2023 launch. Hayes has been a vocal proponent of the token. His earlier sale, however, drew significant criticism from the cryptocurrency community. Several users on X (formerly Twitter) condemned Hayes’ actions as opportunistic, accusing him of promoting HYPE before cashing out. Others suggested that traders who mirrored his trades had been misled by a “big scammer.”

    The controversy has persisted, with some X users accusing Hayes of consistently profiting at the expense of retail investors and urging others to avoid becoming his “exit liquidity.” Further accusations suggest he employs a strategy of “buy in secret, pump in public, dump in public,” thereby manipulating smaller investors.

    Strong HYPE Demand Continues Despite Controversy

    Despite the ongoing debate surrounding Hayes, separate data from Lookonchain indicates sustained interest in the HYPE token. The analytics firm reported that a newly established wallet withdrew an additional 82,089 HYPE tokens, worth around $5.16 million, from exchanges on Monday.

    Over the past week, this same wallet has moved a total of 1.14 million HYPE tokens, valued at approximately $79.22 million, off exchanges. These tokens were subsequently deposited into Hyperliquid for staking purposes.

    In related news, Hyperliquid has achieved a significant milestone this month, breaking into the top 10 cryptocurrency assets by market capitalization. It surpassed Dogecoin and became the first decentralized finance (DeFi) protocol since Uniswap in 2021 to reach this level of market prominence.

  • FTT Surges as SBF Seeks Presidential Pardon Amidst 25-Year Sentence

    FTT Surges as SBF Seeks Presidential Pardon Amidst 25-Year Sentence

    SBF Seeks Trump Pardon, Claims FTX Funds Not Stolen

    Sam Bankman-Fried, the former CEO of the cryptocurrency exchange FTX, has stated that he “absolutely” desires a presidential pardon from Donald Trump. In a phone interview with Fox Business, Bankman-Fried confirmed his willingness to accept clemency from the White House. When asked if his family was actively lobbying for such a pardon, he declined to comment, saying he “can’t speak for them.”

    Bankman-Fried was sentenced to 25 years in prison in March 2024, following the dramatic collapse of FTX in November 2022. He was convicted on charges including wire fraud and conspiracy. The fallout from the exchange’s failure resulted in significant financial losses, with FTX customers reportedly losing approximately $8 billion, investors around $1.7 billion, and lenders to Alameda Research, another of Bankman-Fried’s ventures, about $1.3 billion.

    Despite his conviction, Bankman-Fried continues to dispute the prevailing narrative of the case. He asserted in the interview that he did not steal user funds. He also highlighted the ongoing bankruptcy proceedings, suggesting that a rebound in cryptocurrency prices has allowed customers to recover more than their initial deposits. Bankman-Fried estimated that some users might have received as much as 170% of their original balance, implying that the platform was ultimately “over-collateralized.”

    Following the broadcast of the interview, the price of FTT, FTX’s native token, saw an immediate surge. The token has risen by over 50% in the past 24 hours, trading at approximately $0.37, a level not seen in nearly a month.

  • XRP Eyes Comeback After Reclaiming Key Support

    XRP Eyes Comeback After Reclaiming Key Support

    XRP Faces Critical Juncture as Support Holds Amidst Broader Downtrend

    XRP’s price action on higher timeframes continues to reflect pressure, with the cryptocurrency extending its decline within a broad descending channel. However, the digital asset is now attempting to stabilize above a key support region and is showing early indications of a potential recovery against Bitcoin. The upcoming trading sessions will be crucial in determining whether XRP can establish a meaningful bottom or if it will persist in its longer-term downtrend.

    Daily Timeframe Analysis

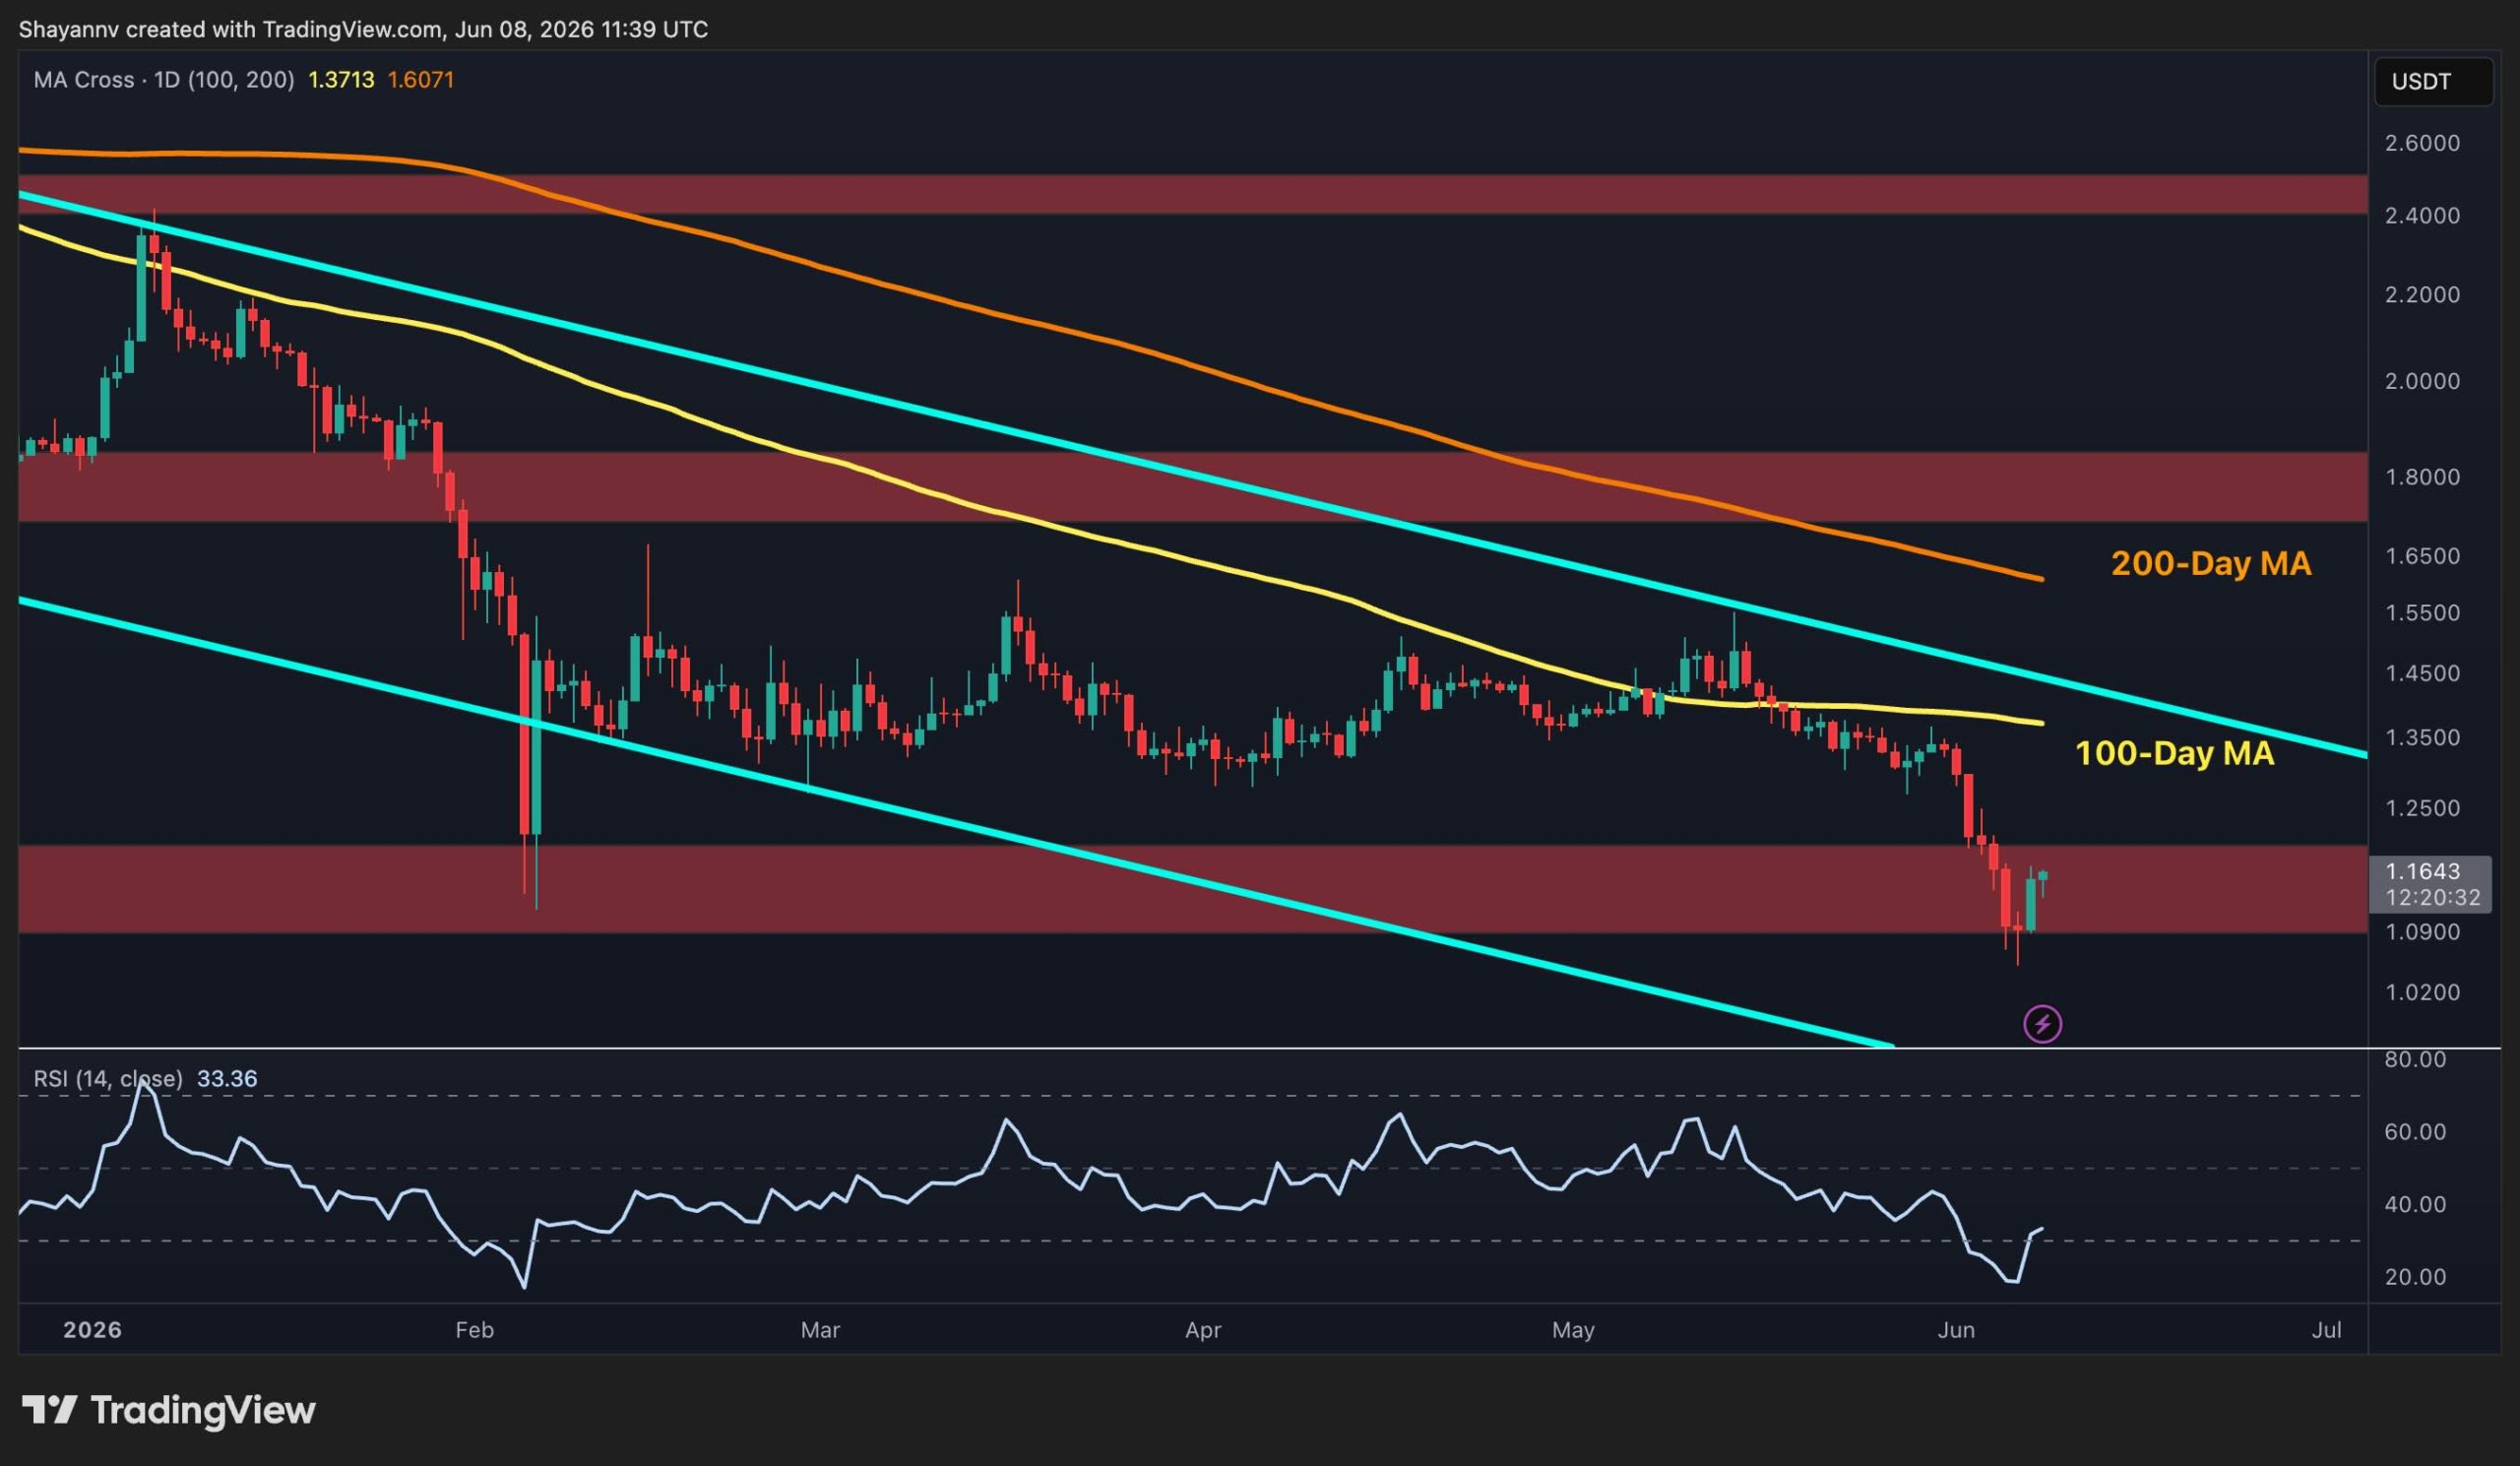
    On the daily chart, XRP recently breached local support around the $1.30 mark, subsequently falling into a significant demand zone situated between $1.10 and $1.20. This area has historically proven attractive to buyers, and it has once again spurred a reaction, with the price rebounding after a brief dip below the zone’s lower boundary.

    Despite this bounce, the overarching market structure for XRP remains bearish. The cryptocurrency is trading within a long-term descending channel and continues to remain below both the 100-day moving average, approximately at $1.35, and the 200-day moving average, near $1.60. The bearish alignment of these moving averages suggests that sellers are still in control of the higher-timeframe trend.

    For buyers to regain momentum, the immediate challenge is to reclaim the 100-day moving average and establish the $1.35-$1.40 region as support. A successful recovery above this area could pave the way for a move towards the next major resistance zone around $1.80. Conversely, a failure to hold the current support could expose the lower boundary of the descending channel, potentially triggering another downward leg. Meanwhile, the Relative Strength Index (RSI) has recovered from near-oversold conditions and is currently hovering around 33, indicating a slight easing of bearish momentum, though a strong bullish reversal signal has yet to emerge.

    XRP vs. Bitcoin Performance

    Against Bitcoin, XRP is exhibiting more constructive price action following several months of underperformance. The XRP/BTC pair recently found support near 1,700 satoshis and has since printed a series of higher lows, suggesting that selling pressure may be waning.

    The pair is currently trading around the 1,820 satoshi region, which coincides with an important resistance area and sits just below the declining 100-day moving average. A decisive breakout above this zone could bolster the recovery narrative and allow XRP to target the next resistance area around 2,000 satoshis, where the 200-day moving average is also located.

    However, the broader trend for the XRP/BTC pair remains negative, as it continues to trade within a long-term descending channel and remains below both the 100-day and 200-day moving averages. Consequently, any sustained bullish continuation will likely necessitate a firm break above the 1,850 satoshi resistance cluster.

    Furthermore, the RSI for the BTC pair has shown notable improvement, hovering near the neutral 55 level, which reflects strengthening momentum compared to XRP’s performance against USDT. As long as XRP maintains its position above the 1,700 satoshi support, the probability of an extension towards higher resistance levels remains elevated. Nevertheless, a breakdown below this floor would invalidate the recent recovery structure and shift the focus towards the lower channel support near 1,500 satoshis.

  • 2026 Crypto-Oil Trading: Top Exchanges Revealed

    2026 Crypto-Oil Trading: Top Exchanges Revealed

    The cryptocurrency landscape has undergone a significant transformation in recent years. When I first entered the space, only a handful of centralized exchanges existed, and the notion of trading stocks or commodities on them was unthinkable. Today, however, tokenization has become a cornerstone of the industry, enabling the trading of commodities like oil with daily trading volumes reaching billions.

    By 2026, as blockchain infrastructure continues its evolution, traders will be able to access oil markets through tokenized assets and decentralized platforms, bypassing traditional brokers entirely. This guide will provide a comprehensive overview of trading oil with crypto, covering exchanges, step-by-step instructions, fees, advantages, disadvantages, and key differences.

    The convergence of oil markets and cryptocurrency has intensified as digital asset platforms expand beyond spot trading into derivatives and real-world asset (RWA) exposure. Historically, oil trading was dominated by futures contracts on regulated exchanges. Now, however, crypto infrastructure facilitates similar exposure through tokenized alternatives. Instead of holding physical oil or relying on legacy brokers, traders can speculate on oil prices using crypto-collateralized perpetual contracts that mirror benchmarks like Brent or WTI.

    Several prominent platforms have already embraced this trend. Hyperliquid, a popular decentralized perpetual contracts exchange, quickly emerged as a preferred venue for oil trading, particularly during periods of geopolitical tension. It remains a leading platform for tokenized oil, boasting billions in open interest within weeks of its launch.

    Centralized exchanges are also gaining traction. Binance, for instance, offers oil-linked derivatives that function similarly to traditional oil futures but are settled in cryptocurrency. Bybit has also introduced trading interfaces that blend traditional finance concepts with digital assets, allowing users to gain exposure to commodities like crude oil alongside crypto markets.

    This evolution signifies a broader shift: cryptocurrency exchanges are rapidly transforming into multi-asset trading venues. Given its status as one of the world’s most liquid commodities, oil represents a natural extension for these platforms. It is important to note that this connection remains synthetic, with prices derived from external markets and positions typically settled in stablecoins or other cryptocurrencies.

    Decentralized and Centralized Exchanges for Oil Trading

    This section will explore both decentralized and centralized exchanges offering oil-linked products tradable with stablecoins. While centralized exchanges have traditionally been perceived as more user-friendly, Hyperliquid offers a comparable experience with the added benefit of self-custody.

    Hyperliquid

    Rating: 4.8/5

    • Pros:

    * 24/7 decentralized commodity trading
    * Complete self-custody with wallet execution
    * Ideal for advanced DeFi derivatives users

    • Cons:

    * Potential smart contract and oracle issues
    * Steeper learning curve for newcomers
    * External ecosystem builders run the markets

    Hyperliquid stands as the largest decentralized cryptocurrency exchange, dominating over 90% of the DEX market share for perpetual futures trading. It pioneered oil-linked derivatives with the launch of HIP-3 on mainnet, becoming a primary venue for trading OIL contracts with crypto, even on weekends. This made it a crucial instrument for price discovery during periods of Middle Eastern conflict.

    Hyperliquid treats crude oil as a 24/7 on-chain perpetual market. Users can post crypto collateral to gain long or short exposure to oil-linked contracts without needing a traditional commodity broker. This offers a truly crypto-native experience, featuring wallet-backed access, on-chain settlement, perpetual futures, funding rates, and continuous trading.

    While centralized venues have since followed suit, Hyperliquid continues to command a significant portion of trading volume for good reason. However, it’s important to acknowledge that Hyperliquid is not a regulated commodity exchange, a characteristic shared by Binance and Bybit. The onboarding process can be intimidating for non-crypto users who need to set up a wallet and bridge funds, but for those familiar with Web3 dApps, the experience is seamless.

    The markets on Hyperliquid are deployed by third-party firms building on the exchange’s infrastructure through its builder codes program. These companies support the markets, meaning the Hyperliquid team is not directly responsible for them. Currently, teams offering oil-linked perps on Hyperliquid include:

    • Astro
    • GMX
    • GMX V2
    • GMX V2 (ETH)
    • GMX V2 (ARB)
    • GMX V2 (AVAX)
    • GMX V2 (FTM)
    • GMX V2 (OP)
    • GMX V2 (POLY)
    • GMX V2 (BASE)
    • GMX V2 (BNB)
    • GMX V2 (MATIC)
    • GMX V2 (ARBITRUM)
    • GMX V2 (OPTIMISM)
    • GMX V2 (FANTOM)
    • GMX V2 (AVALANCHE)
    • GMX V2 (POLYGON)
    • GMX V2 (BASE)
    • GMX V2 (BINANCE SMART CHAIN)
    • GMX V2 (METIS)
    • GMX V2 (CELO)
    • GMX V2 (MOONRIVER)
    • GMX V2 (MOONBEAM)
    • GMX V2 (KAVA)
    • GMX V2 (VELAS)
    • GMX V2 (ELASTOS)
    • GMX V2 (METAVERSE)
    • GMX V2 (XDAI)
    • GMX V2 (CRONOS)
    • GMX V2 (AURORA)
    • GMX V2 (CHI)
    • GMX V2 (BOBA)
    • GMX V2 (CORE)
    • GMX V2 (ZKSYNC)
    • GMX V2 (LINEA)
    • GMX V2 (SCROLL)
    • GMX V2 (ARBITRUM ONE)
    • GMX V2 (OPTIMISM GOERLI)
    • GMX V2 (ARBITRUM GOERLI)
    • GMX V2 (BASE GOERLI)
    • GMX V2 (ZKSYNC GOERLI)
    • GMX V2 (LINEA GOERLI)
    • GMX V2 (SCROLL GOERLI)
    • GMX V2 (CELO GOERLI)
    • GMX V2 (MOONRIVER GOERLI)
    • GMX V2 (MOONBEAM GOERLI)
    • GMX V2 (KAVA GOERLI)
    • GMX V2 (VELAS GOERLI)
    • GMX V2 (ELASTOS GOERLI)
    • GMX V2 (METAVERSE GOERLI)
    • GMX V2 (XDAI GOERLI)
    • GMX V2 (CRONOS GOERLI)
    • GMX V2 (AURORA GOERLI)
    • GMX V2 (CHI GOERLI)
    • GMX V2 (BOBA GOERLI)
    • GMX V2 (CORE GOERLI)
    • GMX V2 (METIS GOERLI)
    • GMX V2 (BNB GOERLI)
    • GMX V2 (MATIC GOERLI)
    • GMX V2 (AVAX GOERLI)
    • GMX V2 (FTM GOERLI)
    • GMX V2 (OP GOERLI)
    • GMX V2 (POLY GOERLI)
    • GMX V2 (BNB TESTNET)
    • GMX V2 (MATIC TESTNET)
    • GMX V2 (AVAX TESTNET)
    • GMX V2 (FTM TESTNET)
    • GMX V2 (OP TESTNET)
    • GMX V2 (POLY TESTNET)
    • GMX V2 (BASE TESTNET)
    • GMX V2 (METIS TESTNET)
    • GMX V2 (CELO TESTNET)
    • GMX V2 (MOONRIVER TESTNET)
    • GMX V2 (MOONBEAM TESTNET)
    • GMX V2 (KAVA TESTNET)
    • GMX V2 (VELAS TESTNET)
    • GMX V2 (ELASTOS TESTNET)
    • GMX V2 (METAVERSE TESTNET)
    • GMX V2 (XDAI TESTNET)
    • GMX V2 (CRONOS TESTNET)
    • GMX V2 (AURORA TESTNET)
    • GMX V2 (CHI TESTNET)
    • GMX V2 (BOBA TESTNET)
    • GMX V2 (CORE TESTNET)
    • GMX V2 (ZKSYNC TESTNET)
    • GMX V2 (LINEA TESTNET)
    • GMX V2 (SCROLL TESTNET)
    • GMX V2 (ARBITRUM ONE TESTNET)
    • GMX V2 (OPTIMISM GOERLI TESTNET)
    • GMX V2 (ARBITRUM GOERLI TESTNET)
    • GMX V2 (BASE GOERLI TESTNET)
    • GMX V2 (ZKSYNC GOERLI TESTNET)
    • GMX V2 (LINEA GOERLI TESTNET)
    • GMX V2 (SCROLL GOERLI TESTNET)
    • GMX V2 (CELO GOERLI TESTNET)
    • GMX V2 (MOONRIVER GOERLI TESTNET)
    • GMX V2 (MOONBEAM GOERLI TESTNET)
    • GMX V2 (KAVA GOERLI TESTNET)
    • GMX V2 (VELAS GOERLI TESTNET)
    • GMX V2 (ELASTOS GOERLI TESTNET)
    • GMX V2 (METAVERSE GOERLI TESTNET)
    • GMX V2 (XDAI GOERLI TESTNET)
    • GMX V2 (CRONOS GOERLI TESTNET)
    • GMX V2 (AURORA GOERLI TESTNET)
    • GMX V2 (CHI GOERLI TESTNET)
    • GMX V2 (BOBA GOERLI TESTNET)
    • GMX V2 (CORE GOERLI TESTNET)
    • GMX V2 (METIS GOERLI TESTNET)
    • GMX V2 (BNB TESTNET)
    • GMX V2 (MATIC TESTNET)
    • GMX V2 (AVAX TESTNET)
    • GMX V2 (FTM TESTNET)
    • GMX V2 (OP TESTNET)
    • GMX V2 (POLY TESTNET)
    • GMX V2 (BASE TESTNET)
    • GMX V2 (METIS TESTNET)
    • GMX V2 (CELO TESTNET)
    • GMX V2 (MOONRIVER TESTNET)
    • GMX V2 (MOONBEAM TESTNET)
    • GMX V2 (KAVA TESTNET)
    • GMX V2 (VELAS TESTNET)
    • GMX V2 (ELASTOS TESTNET)
    • GMX V2 (METAVERSE TESTNET)
    • GMX V2 (XDAI TESTNET)
    • GMX V2 (CRONOS TESTNET)
    • GMX V2 (AURORA TESTNET)
    • GMX V2 (CHI TESTNET)
    • GMX V2 (BOBA TESTNET)
    • GMX V2 (CORE TESTNET)
    • GMX V2 (ZKSYNC TESTNET)
    • GMX V2 (LINEA TESTNET)
    • GMX V2 (SCROLL TESTNET)
    • GMX V2 (ARBITRUM ONE TESTNET)
    • GMX V2 (OPTIMISM GOERLI TESTNET)
    • GMX V2 (ARBITRUM GOERLI TESTNET)
    • GMX V2 (BASE GOERLI TESTNET)
    • GMX V2 (ZKSYNC GOERLI TESTNET)
    • GMX V2 (LINEA GOERLI TESTNET)
    • GMX V2 (SCROLL GOERLI TESTNET)
    • GMX V2 (CELO GOERLI TESTNET)
    • GMX V2 (MOONRIVER GOERLI TESTNET)
    • GMX V2 (MOONBEAM GOERLI TESTNET)
    • GMX V2 (KAVA GOERLI TESTNET)
    • GMX V2 (VELAS GOERLI TESTNET)
    • GMX V2 (ELASTOS GOERLI TESTNET)
    • GMX V2 (METAVERSE GOERLI TESTNET)
    • GMX V2 (XDAI GOERLI TESTNET)
    • GMX V2 (CRONOS GOERLI TESTNET)
    • GMX V2 (AURORA GOERLI TESTNET)
    • GMX V2 (CHI GOERLI TESTNET)
    • GMX V2 (BOBA GOERLI TESTNET)
    • GMX V2 (CORE GOERLI TESTNET)
    • GMX V2 (METIS GOERLI TESTNET)
    • GMX V2 (BNB GOERLI TESTNET)
    • GMX V2 (MATIC GOERLI TESTNET)
    • GMX V2 (AVAX GOERLI TESTNET)
    • GMX V2 (FTM GOERLI TESTNET)
    • GMX V2 (OP GOERLI TESTNET)
    • GMX V2 (POLY GOERLI TESTNET)
    • GMX V2 (BNB SMART CHAIN)
    • GMX V2 (METIS)
    • GMX V2 (CELO)
    • GMX V2 (MOONRIVER)
    • GMX V2 (MOONBEAM)
    • GMX V2 (KAVA)
    • GMX V2 (VELAS)
    • GMX V2 (ELASTOS)
    • GMX V2 (METAVERSE)
    • GMX V2 (XDAI)
    • GMX V2 (CRONOS)
    • GMX V2 (AURORA)
    • GMX V2 (CHI)
    • GMX V2 (BOBA)
    • GMX V2 (CORE)
    • GMX V2 (ZKSYNC)
    • GMX V2 (LINEA)
    • GMX V2 (SCROLL)
    • GMX V2 (ARBITRUM ONE)
    • GMX V2 (OPTIMISM GOERLI)
    • GMX V2 (ARBITRUM GOERLI)
    • GMX V2 (BASE GOERLI)
    • GMX V2 (ZKSYNC GOERLI)
    • GMX V2 (LINEA GOERLI)
    • GMX V2 (SCROLL GOERLI)
    • GMX V2 (CELO GOERLI)
    • GMX V2 (MOONRIVER GOERLI)
    • GMX V2 (MOONBEAM GOERLI)
    • GMX V2 (KAVA GOERLI)
    • GMX V2 (VELAS GOERLI)
    • GMX V2 (ELASTOS GOERLI)
    • GMX V2 (METAVERSE GOERLI)
    • GMX V2 (XDAI GOERLI)
    • GMX V2 (CRONOS GOERLI)
    • GMX V2 (AURORA GOERLI)
    • GMX V2 (CHI GOERLI)
    • GMX V2 (BOBA GOERLI)
    • GMX V2 (CORE GOERLI)
    • GMX V2 (METIS GOERLI)
    • GMX V2 (BNB GOERLI)
    • GMX V2 (MATIC GOERLI)
    • GMX V2 (AVAX GOERLI)
    • GMX V2 (FTM GOERLI)
    • GMX V2 (OP GOERLI)
    • GMX V2 (POLY GOERLI)
    • GMX V2 (BNB TESTNET)
    • GMX V2 (MATIC TESTNET)
    • GMX V2 (AVAX TESTNET)
    • GMX V2 (FTM TESTNET)
    • GMX V2 (OP TESTNET)
    • GMX V2 (POLY TESTNET)
    • GMX V2 (BASE TESTNET)
    • GMX V2 (METIS TESTNET)
    • GMX V2 (CELO TESTNET)
    • GMX V2 (MOONRIVER TESTNET)
    • GMX V2 (MOONBEAM TESTNET)
    • GMX V2 (KAVA TESTNET)
    • GMX V2 (VELAS TESTNET)
    • GMX V2 (ELASTOS TESTNET)
    • GMX V2 (METAVERSE TESTNET)
    • GMX V2 (XDAI TESTNET)
    • GMX V2 (CRONOS TESTNET)
    • GMX V2 (AURORA TESTNET)
    • GMX V2 (CHI TESTNET)
    • GMX V2 (BOBA TESTNET)
    • GMX V2 (CORE TESTNET)
    • GMX V2 (ZKSYNC TESTNET)
    • GMX V2 (LINEA TESTNET)
    • GMX V2 (SCROLL TESTNET)
    • GMX V2 (ARBITRUM ONE TESTNET)
    • GMX V2 (OPTIMISM GOERLI TESTNET)
    • GMX V2 (ARBITRUM GOERLI TESTNET)
    • GMX V2 (BASE GOERLI TESTNET)
    • GMX V2 (ZKSYNC GOERLI TESTNET)
    • GMX V2 (LINEA GOERLI TESTNET)
    • GMX V2 (SCROLL GOERLI TESTNET)
    • GMX V2 (CELO GOERLI TESTNET)
    • GMX V2 (MOONRIVER GOERLI TESTNET)
    • GMX V2 (MOONBEAM GOERLI TESTNET)
    • GMX V2 (KAVA GOERLI TESTNET)
    • GMX V2 (VELAS GOERLI TESTNET)
    • GMX V2 (ELASTOS GOERLI TESTNET)
    • GMX V2 (METAVERSE GOERLI TESTNET)
    • GMX V2 (XDAI GOERLI TESTNET)
    • GMX V2 (CRONOS GOERLI TESTNET)
    • GMX V2 (AURORA GOERLI TESTNET)
    • GMX V2 (CHI GOERLI TESTNET)
    • GMX V2 (BOBA GOERLI TESTNET)
    • GMX V2 (CORE GOERLI TESTNET)
    • GMX V2 (METIS GOERLI TESTNET)
    • GMX V2 (BNB GOERLI TESTNET)
    • GMX V2 (MATIC GOERLI TESTNET)
    • GMX V2 (AVAX GOERLI TESTNET)
    • GMX V2 (FTM GOERLI TESTNET)
    • GMX V2 (OP GOERLI TESTNET)
    • GMX V2 (POLY GOERLI TESTNET)

    Together, these teams contribute nearly $1 billion in daily trading volume.

    Binance

    Binance offers direct exposure to crude and Brent oil prices through its derivatives platform, Binance Futures. The available pairs are:

    • BRN1! (Brent Crude Oil Futures)
    • WTI1! (West Texas Intermediate Crude Oil Futures)

    The convenience of Binance is evident. As the world’s largest cryptocurrency exchange with millions of daily active users, it provides immediate access to oil perpetual future contracts. The trading experience mirrors that of cryptocurrency derivatives, requiring no additional learning curve. Trading is available 24/7, with a maximum leverage of 100x.

    • Pros:

    * User-friendly interface for existing Binance users
    * High liquidity and trading volume
    * 24/7 trading availability
    * High leverage options

    • Cons:

    * Not a regulated commodity exchange
    * Requires KYC verification
    * Potential for liquidation risk with high leverage

    Bybit

    Bybit presents another direct option for trading oil with cryptocurrency, particularly for those already using the platform for crypto trading. The exchange offers a TradFi service, enabling trading of WTI and Brent oil using USDT. This model provides a familiar structure for crypto derivatives traders.

    Bybit’s approach simplifies the process, allowing users to bridge crypto balances and traditional markets without needing a separate commodities broker. The platform also offers mobile access and advanced trading tools.

    • Pros:

    * Familiar interface for crypto derivatives traders
    * Convenient integration with existing crypto balances
    * Mobile access and advanced tools
    * 24/7 trading availability

    • Cons:

    * Not a regulated commodity exchange
    * Requires KYC verification
    * Potential for liquidation risk with high leverage

    Fees

    Fees vary significantly across the reviewed platforms and can be influenced by account tier, trading volume, region, and market conditions. It is crucial to look beyond the maker-taker fees and consider funding rates, spreads, slippage, withdrawal fees, bridging costs, and any commissions or overnight charges.

    Advantages of Trading Oil with Crypto

    For those accustomed to traditional commodity trading, the process through brokers, futures exchanges, or CFDs can often feel cumbersome. Setting up traditional brokerage accounts, for example, can involve lengthy administrative procedures that are typically absent in crypto-native platforms. Given that physical oil trading is impractical for most, derivatives are the likely focus. Here are some key advantages of trading oil with crypto:

    • 24/7 Market Access: Many crypto platforms offer round-the-clock access to oil markets, unlike traditional futures markets with set trading hours. This continuous trading capability is particularly attractive during weekends, holidays, or periods of geopolitical instability when news can break while traditional markets are closed.
    • Stablecoin Settlement: If you already engage in crypto trading, you likely hold stablecoins like USDT or USDC. All the reviewed platforms allow direct oil trading using these stablecoins. This provides a familiar experience, enabling collateral posting, position management, and trade settlement in dollar-denominated stablecoins.
    • Reduced Need for Separate Brokers: Crypto platforms can diminish the reliance on separate commodities brokers. For existing crypto traders, this eliminates the friction of opening new accounts with legacy brokerages, learning new interfaces, or transferring capital between different financial platforms. This is especially appealing to crypto-native users.
    • Familiar Trading Experience: Oil-linked products on crypto exchanges closely resemble perpetual futures markets, which many traders are already familiar with. Centralized exchanges, in particular, offer a streamlined setup process.
    • Other Benefits:

    * Speed and Efficiency: Transactions are generally faster compared to traditional financial systems.
    * Global Accessibility: Crypto platforms are accessible to a wider global audience.
    * Innovation: The space is constantly evolving with new features and products.

    Risks of Trading Oil with Crypto

    The risks associated with trading oil with crypto are largely similar to those found in perpetual futures trading, including:

    • Market Volatility: Oil prices can be highly volatile, influenced by geopolitical events, supply and demand dynamics, and economic factors.
    • Leverage Risk: High leverage amplifies both potential profits and losses. Excessive leverage can lead to rapid liquidation of positions.
    • Liquidation Risk: If the market moves against your position and your margin falls below the required level, your position can be automatically liquidated.
    • Smart Contract Risk (for DEXs): Decentralized exchanges rely on smart contracts, which can have vulnerabilities that could be exploited.
    • Counterparty Risk (for CEXs): Centralized exchanges hold your funds, meaning there is a risk of the exchange becoming insolvent or experiencing a security breach.

    Specific Risks to Consider

    • Oracle Risk: Crypto-based oil markets often rely on external price feeds, such as index calculations or oracle systems, to track benchmarks like Brent or WTI. If an oracle is delayed, inaccurate, manipulated, or disconnected from the underlying market, traders may encounter unexpected pricing issues. This risk can affect both decentralized and centralized exchanges.

    Choosing the Right Platform

    There is no single “best” option for every trader. The choice between decentralized and centralized platforms depends on individual experience levels, custody preferences, and risk tolerance.

    | Feature | Decentralized (e.g., Hyperliquid) | Centralized (e.g., Binance, Bybit) |
    | :—————— | :——————————– | :——————————— |
    | Custody | Self-custody | Exchange custody |
    | User Experience | More complex, crypto-native | Simpler, familiar |
    | Regulation | Less regulated | Varies, often requires KYC |
    | Anonymity | Higher | Lower (due to KYC) |
    | Security | Smart contract dependent | Exchange security dependent |
    | Best For | Crypto natives, self-custody advocates | Newcomers, convenience seekers |

    Frequently Asked Questions

    Yes, many crypto platforms now offer oil-linked products that allow traders to gain exposure to crude oil prices using stablecoins or crypto collateral. These are typically derivatives or synthetic markets rather than direct ownership of physical oil.

    Usually, no. Most oil-linked crypto products track benchmarks like Brent or WTI through derivatives, perpetual contracts, indexes, or oracle-based pricing, rather than granting traders ownership of physical crude oil.

    Oil-linked products are available on exchanges such as Hyperliquid, Binance, and Bybit. Availability can change, so it’s advisable to check the live platform before depositing funds.

    Yes, most crypto-based oil markets operate 24/7. However, weekend trading may involve wider spreads, lower liquidity, and pricing discrepancies compared to traditional oil markets.

    Yes, trading oil with crypto is generally considered safe, provided one understands and manages the inherent risks, including market volatility, leverage, and liquidation.

    Yes, USDT or USDC are typically required to trade oil with crypto. Most exchanges support at least one of these stablecoins.

    Hyperliquid is the premier choice for crypto natives seeking an on-chain experience. Binance and Bybit are excellent alternatives for existing users or those prioritizing a reliable and secure centralized exchange.

    The primary appeal of these platforms lies in their convenience. While the initial setup might seem daunting for inexperienced traders, crypto exchanges generally provide comprehensive guidance and educational resources.

    In essence, trading oil with crypto offers significant advantages for those who value speed, stablecoin settlement, and crypto-native access. However, it is not a risk-free endeavor.
  • XRP and Bitcoin: The Only Top 10 Survivors Since 2014

    XRP and Bitcoin: The Only Top 10 Survivors Since 2014

    XRP Price Shows Resilience Amidst Market Turbulence, Analysts Eye Potential Upside

    XRP is currently trading around the $1.15 mark, buoyed by a combination of on-chain activity, institutional interest, and market structure signals that point to underlying strength. Notably, XRP, alongside Bitcoin, is one of the only cryptocurrencies to have consistently maintained a top-10 market capitalization position since 2014, a testament to its enduring presence in the digital asset space.

    XRP Recovers with Conviction

    Following a volatile week, XRP has successfully reclaimed the $1.10 support level, a move that appears to be backed by significant conviction. Data indicates that over 25 million XRP tokens were withdrawn from exchanges during this period, a pattern often associated with accumulation by large holders, or “whales.”

    Strong Inflows and Trading Volume

    Daily spot trading volume for XRP surged by 16%, exceeding $2 billion. Furthermore, XRP investment products have collectively attracted over $1.4 billion in cumulative inflows. These metrics suggest that the current price action is not merely a fleeting fluctuation but rather a data point within a broader, sustained trend.

    Technical Outlook and Support Levels

    XRP is presently consolidating within the $1.13 to $1.15 range, holding firm above the immediate pivot point of $1.08 and building on its re-established $1.10 support. The 16% surge in trading volume accompanying this upward movement is viewed positively by technical traders.

    Potential downside support levels are identified at $1.06, $1.03, and $1.00. The $1.00 level, in particular, serves as a crucial psychological floor; a decisive weekly close below this point would signal a significant bearish shift in market structure.

    Bullish and Bearish Scenarios

    For bullish investors, sustained exchange outflows and an acceleration of the exchange-traded fund (ETF) narrative could propel XRP towards the $1.30-$1.40 resistance zone. Beyond that, analyst consensus suggests a potential target range of $2.50 to $3.50 by 2026.

    Conversely, a deterioration in the broader macroeconomic environment could lead to XRP breaking below the $1.00 mark. Both macro and technical indicators suggest a potential retracement in the near term, following the recent breakout.

    The Challenge of Exponential Growth

    The current market dynamics present a unique challenge for traders. XRP and Bitcoin have weathered numerous market cycles, including periods of rapid growth and subsequent corrections. The potential for exponential gains, similar to those captured by early holders in 2014 or 2017, is structurally limited at their current market capitalizations. This raises the question of where significant future growth opportunities might lie.

    LiquidChain: A New Frontier in Liquidity

    LiquidChain ($LIQUID) is an emerging Layer 3 infrastructure project designed to address the fragmentation of liquidity across major blockchain ecosystems such as Bitcoin, Ethereum, and Solana. Its core innovation is a Unified Liquidity Layer that integrates these three networks into a singular execution environment. This architecture enables Single-Step Execution, Verifiable Settlement, and a Deploy-Once approach, allowing developers to access liquidity from BTC, ETH, and SOL without the need for cross-chain redeployment.

    The presale for $LIQUID is currently underway, with tokens priced at $0.01467. To date, $830,000 has been raised. The current entry price reflects the early-stage infrastructure risk rather than post-hype market premiums. Investors are encouraged to review LiquidChain’s presale terms before the window closes.

  • XRP Crash: Analyst Sees Massive Opportunity

    XRP Crash: Analyst Sees Massive Opportunity

    Crypto Market Faces Headwinds, XRP Analyst Eyes Potential Dip

    Despite a recent, modest recovery, the cryptocurrency sector continues to grapple with the ongoing bear market. Within this challenging environment, one prominent analyst suggests that Ripple’s XRP, which has been significantly impacted by recent market corrections, could fall below $1 in the short term. However, this potential decline, the analyst notes, might present a valuable buying opportunity for long-term investors.

    As of this report, XRP is trading around $1.15, according to CoinGecko data, marking a 12% decrease from its valuation last Monday. X user Ali Martinez stated he is closely observing the $0.90 level, indicating that a drop to this point could offer “a compelling long-term buying opportunity.”

    While some commentators on Martinez’s post expressed skepticism about XRP breaching the $1 mark, others revealed they have already placed buy orders at $0.50. Martinez described this strategy as “not a bad idea.”

    Recent activity from large holders, often referred to as “whales,” suggests that XRP is indeed at risk of further price depreciation. Over the past week, these market participants have offloaded approximately 60 million tokens. This significant sell-off signals waning confidence and could potentially trigger panic among smaller investors, leading to a more substantial sell-off.

    Adding to the bearish sentiment, one anonymous whale has opened a short position on XRP valued at nearly $1.5 million. These large investors are frequently rumored to possess insider knowledge of upcoming events that could influence a token’s price. It remains to be seen whether this whale’s substantial bet will prove profitable or if it will be deemed a reckless gamble.

    Conversely, other analysts maintain an optimistic outlook, believing the worst of the downturn may be over and predicting a strong rebound in the near future. X user CRYPTOWZRD pointed out that XRP closed the previous day on a bullish note, suggesting that a move above $1.15 could signal further upside potential.

    In a more ambitious forecast, Joshua Dalton envisions XRP surging to $3.50 by the end of June, a target that appears ambitious given current market conditions. Meanwhile, Zach Humphries revealed he has purchased XRP for the first time in two years, drawing a parallel to a previous investment. “The last time I bought XRP it was at $0.50 and scooping it up at $1.09 feels like a very similar opportunity,” Humphries explained.

    Underpinning potential upward movement is sustained institutional interest in XRP. Unlike spot Bitcoin and Ether ETFs, those backed by XRP have attracted considerable capital even during the market downturn. This indicates that major players, including pension funds and hedge funds, are continuing to increase their exposure to the token despite the prevailing bearish sentiment.