Tag: Market Trends

  • XRP Holds Support, Eyes Next Rally

    XRP Holds Support, Eyes Next Rally

    XRP Price Consolidates After Correction

    The price of XRP has begun a downward correction from the $1.3750 zone. Currently consolidating, the cryptocurrency could attempt another increase if it remains above $1.3280.

    Technical Analysis

    XRP initiated a downside correction after failing to sustain its position above $1.3720. The price is now trading above $1.350 and the 100-hourly Simple Moving Average. A bearish trend line is forming, with resistance at $1.3650 on the hourly chart of the XRP/USD pair, according to data from Kraken. The pair could initiate a fresh increase if it settles above $1.3750.

    Support Levels

    XRP experienced a notable upward movement, surpassing $1.3250 and $1.3280, outperforming both Bitcoin and Ethereum. The price gained momentum, breaking above the $1.370 resistance. A high of $1.3741 was reached before a downside correction began. The price subsequently fell below $1.3450 and $1.3420, dipping below the 50% Fibonacci retracement level of the upward move from the $1.3001 swing low to the $1.3741 high. Currently, the price is trading above $1.350 and the 100-hourly Simple Moving Average.

    Resistance Levels

    If the price resumes its upward trajectory, it may encounter resistance near the $1.3650 level, coinciding with a bearish trend line on the hourly chart. The primary resistance level is near $1.3740, with a potential rise to test $1.3880 if surpassed. Further gains could lead to a test of the $1.40 resistance, with the next major hurdle for bulls potentially near $1.450.

    Potential Downside

    If XRP fails to break through the $1.3740 resistance zone, a fresh decline could occur. Initial support on the downside is near $1.3370. The next significant support levels are near $1.3280 and the 61.8% Fibonacci retracement level of the upward move from the $1.3001 swing low to the $1.3741 high. A break and close below $1.3280 could lead to a further decline towards $1.3175, with the next major support zone near $1.3120. Further losses could see a test of $1.30.

    Technical Indicators

    The Hourly MACD for XRP/USD is gaining momentum in the bullish zone. The Hourly RSI (Relative Strength Index) for XRP/USD is currently above the 50 level.

    Major Support Levels: $1.3370 and $1.3280.

    Major Resistance Levels: $1.3650 and $1.3740.
  • Dogecoin Rally Stalls at Resistance

    Dogecoin Rally Stalls at Resistance

    Dogecoin (DOGE) has initiated a recovery, surpassing the $0.10 mark against the US Dollar. However, the cryptocurrency is now encountering resistance near $0.1050 and may face challenges in sustaining further gains.

    Price Analysis

    DOGE began its recovery from $0.10, climbing above $0.1020. The price is currently trading below $0.1035 and the 100-hourly simple moving average. A bearish trend line is forming, with resistance at $0.1030 on the hourly chart of the DOGE/USD pair, according to data from Kraken. The price could continue its upward movement if it remains above $0.10.

    Resistance Levels

    Dogecoin’s price, mirroring movements in Bitcoin and Ethereum, initiated a recovery from the $0.10 zone. DOGE surpassed resistance levels at $0.1015 and $0.1020. A notable upward move occurred above the 50% Fibonacci retracement level, calculated from the decline between the $0.1066 swing high and the $0.0968 low. However, the price struggled near $0.1045. A bearish trend line is also forming, with resistance at $0.1030 on the hourly chart of the DOGE/USD pair.

    Currently, Dogecoin is trading below $0.1035 and the 100-hourly simple moving average. Immediate resistance on the upside is near $0.1030. The first significant resistance for bulls could be near $0.1042, coinciding with the 76.4% Fibonacci retracement level of the downward move from the $0.1066 swing high to the $0.0968 low. The next major resistance is near $0.1050. A close above $0.1050 could potentially push the price towards the $0.1085 resistance level. Further gains might lead to a test of the $0.1120 level, with $0.1150 as the next potential target for bulls.

    Potential Downturn

    If DOGE fails to break above $0.1050, a continued decline is possible. Initial support on the downside is near $0.1005, followed by the $0.10 level. The primary support level is at $0.0980. A break below $0.0980 could trigger a further price decrease, potentially leading to a drop towards $0.09650 or even $0.0950 in the short term.

    Technical Indicators

    The hourly Moving Average Convergence Divergence (MACD) for DOGE/USD is currently gaining bullish momentum. The hourly Relative Strength Index (RSI) for DOGE/USD is above the 50 level.

    Major support levels are at $0.1005 and $0.1000. Major resistance levels are at $0.1050 and $0.1120.

  • Bitcoin ETFs See $1.25B Outflow Amid Surging Chip ETF Interest

    Bitcoin ETFs See $1.25B Outflow Amid Surging Chip ETF Interest

    Last week, crypto-related exchange-traded funds experienced significant outflows, while a memory chip ETF rapidly gained assets, becoming one of the fastest-growing funds in history.

    Crypto ETF Outflows

    Bitcoin’s price saw minimal gains during the period, increasing by only 0.6%. Many altcoins mirrored this performance, with a few exceptions, such as Hyperliquid’s HYPE, which surged approximately 40%.

    From May 18 to May 22, spot Bitcoin ETFs recorded net outflows of $1.257 billion, according to data from Farside Investors. This indicates a shift in investor sentiment. Ethereum-based ETFs also faced challenges, with net outflows of around $216 million during the same period. This pullback suggests investors may be taking profits, reducing risk, or reallocating capital to other sectors.

    However, not all crypto-related ETFs suffered. Spot SOL ETFs attracted slightly over $15 million in net inflows, while spot XRP ETFs brought in $22 million. HYPE funds saw even stronger demand, attracting $72.38 million in net inflows, which correlated with the token’s price increase.

    These fund flows suggest that while Bitcoin and Ethereum faced selling pressure, investors are still investing in the broader crypto market, focusing on select altcoins.

    Memory Chip ETF’s Rapid Growth

    The Memory ETF, trading under the ticker DRAM, has become the fastest-growing exchange-traded fund in history. Launched on April 2, it accumulated over $6.5 billion in assets within just 27 trading sessions. This surpassed the previous record held by the BlackRock IBIT Bitcoin ETF, which took 30 trading sessions to reach the same level.

    Since its launch, DRAM has surged by over 84% and surpassed $10 billion in assets within 30 trading sessions. This has also positioned it among the top 10 US ETFs by year-to-date inflows out of more than 5,000 listed funds.

    The DRAM ETF’s rapid growth demonstrates increasing investor interest in memory chips. It is now among the top 20 most traded ETFs by volume, indicating that the memory chip and AI infrastructure trade is gaining significant momentum on Wall Street.

  • Ethereum Price Gains Bullish Momentum

    Ethereum Price Gains Bullish Momentum

    Ethereum Price Correction

    Ethereum’s price has begun a downward correction from $2,150. To resume its upward trajectory, ETH must surpass resistance levels at $2,120 and $2,150. The cryptocurrency has retreated below the $2,125 zone and is currently trading above $2,100 and the 100-hourly Simple Moving Average.

    A bearish trend line is forming, with resistance at $2,110 on the hourly chart of ETH/USD, according to data from Kraken. The pair could continue to decline if it remains below the $2,150 zone.

    Support Levels Hold

    Ethereum failed to maintain its position above the $2,145 zone, mirroring Bitcoin’s decline. The price of ETH subsequently fell below the $2,120 and $2,110 levels. Bears pushed the price below the 38.2% Fibonacci retracement level, calculated from the upward movement between the $2,001 swing low and the $2,147 high. However, bulls have been active near the $2,065 level.

    The hourly chart of ETH/USD also shows a bearish trend line forming, with resistance at $2,110. Ethereum is currently trading above $2,100 and the 100-hourly Simple Moving Average. If bulls maintain their activity above $2,065, the price may attempt another increase.

    Immediate resistance is observed near $2,110, with the first key resistance near $2,140. The next significant resistance level is near $2,150. A decisive move above the $2,150 resistance could potentially drive the price towards the $2,220 resistance level. A break above $2,220 might lead to further gains in the coming days, potentially pushing Ether towards the $2,250 resistance zone or even $2,320 in the near term.

    Potential for Further Decline

    If Ethereum fails to overcome the $2,110 resistance, a fresh decline could be initiated. Initial support on the downside is near the $2,075 level. The first major support is situated near the $2,055 zone, coinciding with the 61.8% Fibonacci retracement level of the upward move from the $2,001 swing low to the $2,147 high. A clear break below the $2,055 support could push the price towards the $2,020 support level. Further losses might lead to a test of the $2,000 region, with the main support potentially at $1,940.

    Technical Indicators

    The Hourly MACD for ETH/USD is gaining bullish momentum. The Hourly RSI for ETH/USD is currently above the 50 zone.

    Major Support Level: $2,055
    Major Resistance Level: $2,150

  • Solana Activity Surges Despite SOL’s Q1 Dip

    Solana Activity Surges Despite SOL’s Q1 Dip

    Solana Network Activity Surges Despite Price Dip

    Solana’s native token, SOL, experienced a 33% decline in the first quarter of 2026, closing at approximately $83. However, Messari’s Q1 State of Solana report paints a more nuanced picture, highlighting significant network activity despite the price drop.

    While dollar-denominated metrics decreased across the board, the Solana network achieved record-breaking daily transaction volumes, saw its real-world asset market capitalization surpass $2 billion, and maintained relatively stable validator revenue.

    Record-Breaking Transaction Volume

    The report’s key finding was a new all-time high for average daily non-vote transactions, reaching 112.6 million. This figure represents a 50% increase from the previous quarter and surpasses the previous record set in Q2 2025 by 15%. This indicates that the Solana network processed more transactions daily in Q1 than at any other point in its history, contrasting with the price decline. Meanwhile, Chain GDP, Messari’s term for total application revenue, remained nearly flat at $342.2 million, slightly above Q4 2025’s $341.8 million.

    Revenue Highlights and Volatility

    According to the report, Pump.fun remained the largest single revenue source, generating $124.7 million, a 17% increase quarter-over-quarter. Axiom, a trading app, followed in second place, recording a 36% jump to $42.4 million.

    The most significant growth was observed with Bags, a launchpad that allows users to share trading fees with social media accounts. Its revenue surged by 1,347% to $11.5 million, driven by intense trading activity in meme coins tied to open-source AI projects in January. However, this momentum proved short-lived, with Bags’ revenue dropping 85% month-over-month in February, illustrating the rapid turnover of activity within Solana’s application layer.

    DeFi and Real-World Assets

    Decentralized Finance (DeFi) Total Value Locked (TVL) decreased by 22% quarter-over-quarter to $6.16 billion, mirroring SOL’s price decline rather than reflecting a significant user outflow. Solana’s share of total DeFi TVL remained relatively stable, decreasing from 6.9% to 6.7%. Kamino surpassed Jupiter to become the leading protocol, with $1.72 billion in TVL compared to Jupiter’s $1.69 billion.

    Drift’s performance was impacted by a $285 million exploit attributed to a sophisticated social engineering operation linked to North Korean state-affiliated threat actors.

    The report also revealed that Real Economic Value, which represents fees and Miner Extractable Value (MEV) tips paid to validators, decreased by only 1% to $89.5 million. This placed Solana second among all networks, behind Hyperliquid’s $156 million.

    A defining trend of Q1, beyond the bear market, was the growth of real-world assets. The market on Solana saw its value increase by 43% quarter-over-quarter to $2.01 billion.

    BlackRock’s BUIDL tokenized money market fund doubled to $525.4 million after Anchorage Digital added custody support, with Anchorage holding approximately 81% of the total on-network supply by the end of the quarter.

    Ondo Finance launched over 200 tokenized US stocks and ETFs on Solana, including a same-day tokenization of BitGo stock on the date of the company’s NYSE IPO.

    Stablecoin Market Dynamics

    While the stablecoin market capitalization on the platform remained just under $15 billion, its composition shifted. USDC decreased by 21% to $7.83 billion but still accounts for 53% of the total. USDT increased by 34% to $2.89 billion.

    World Liberty Financial’s USD1 experienced a 473% surge to $883.5 million, largely due to Binance reallocating customer holdings to Solana.

  • XRP’s Next Few Days Crucial for Price Action

    XRP’s Next Few Days Crucial for Price Action

    XRP’s recent price movements indicate growing uncertainty, with volatility decreasing on longer timeframes while shorter-term charts show repeated price reactions at established support and resistance levels. These periods of contraction often precede significant directional shifts, making the upcoming trading sessions crucial for the cryptocurrency.

    Daily Chart Analysis

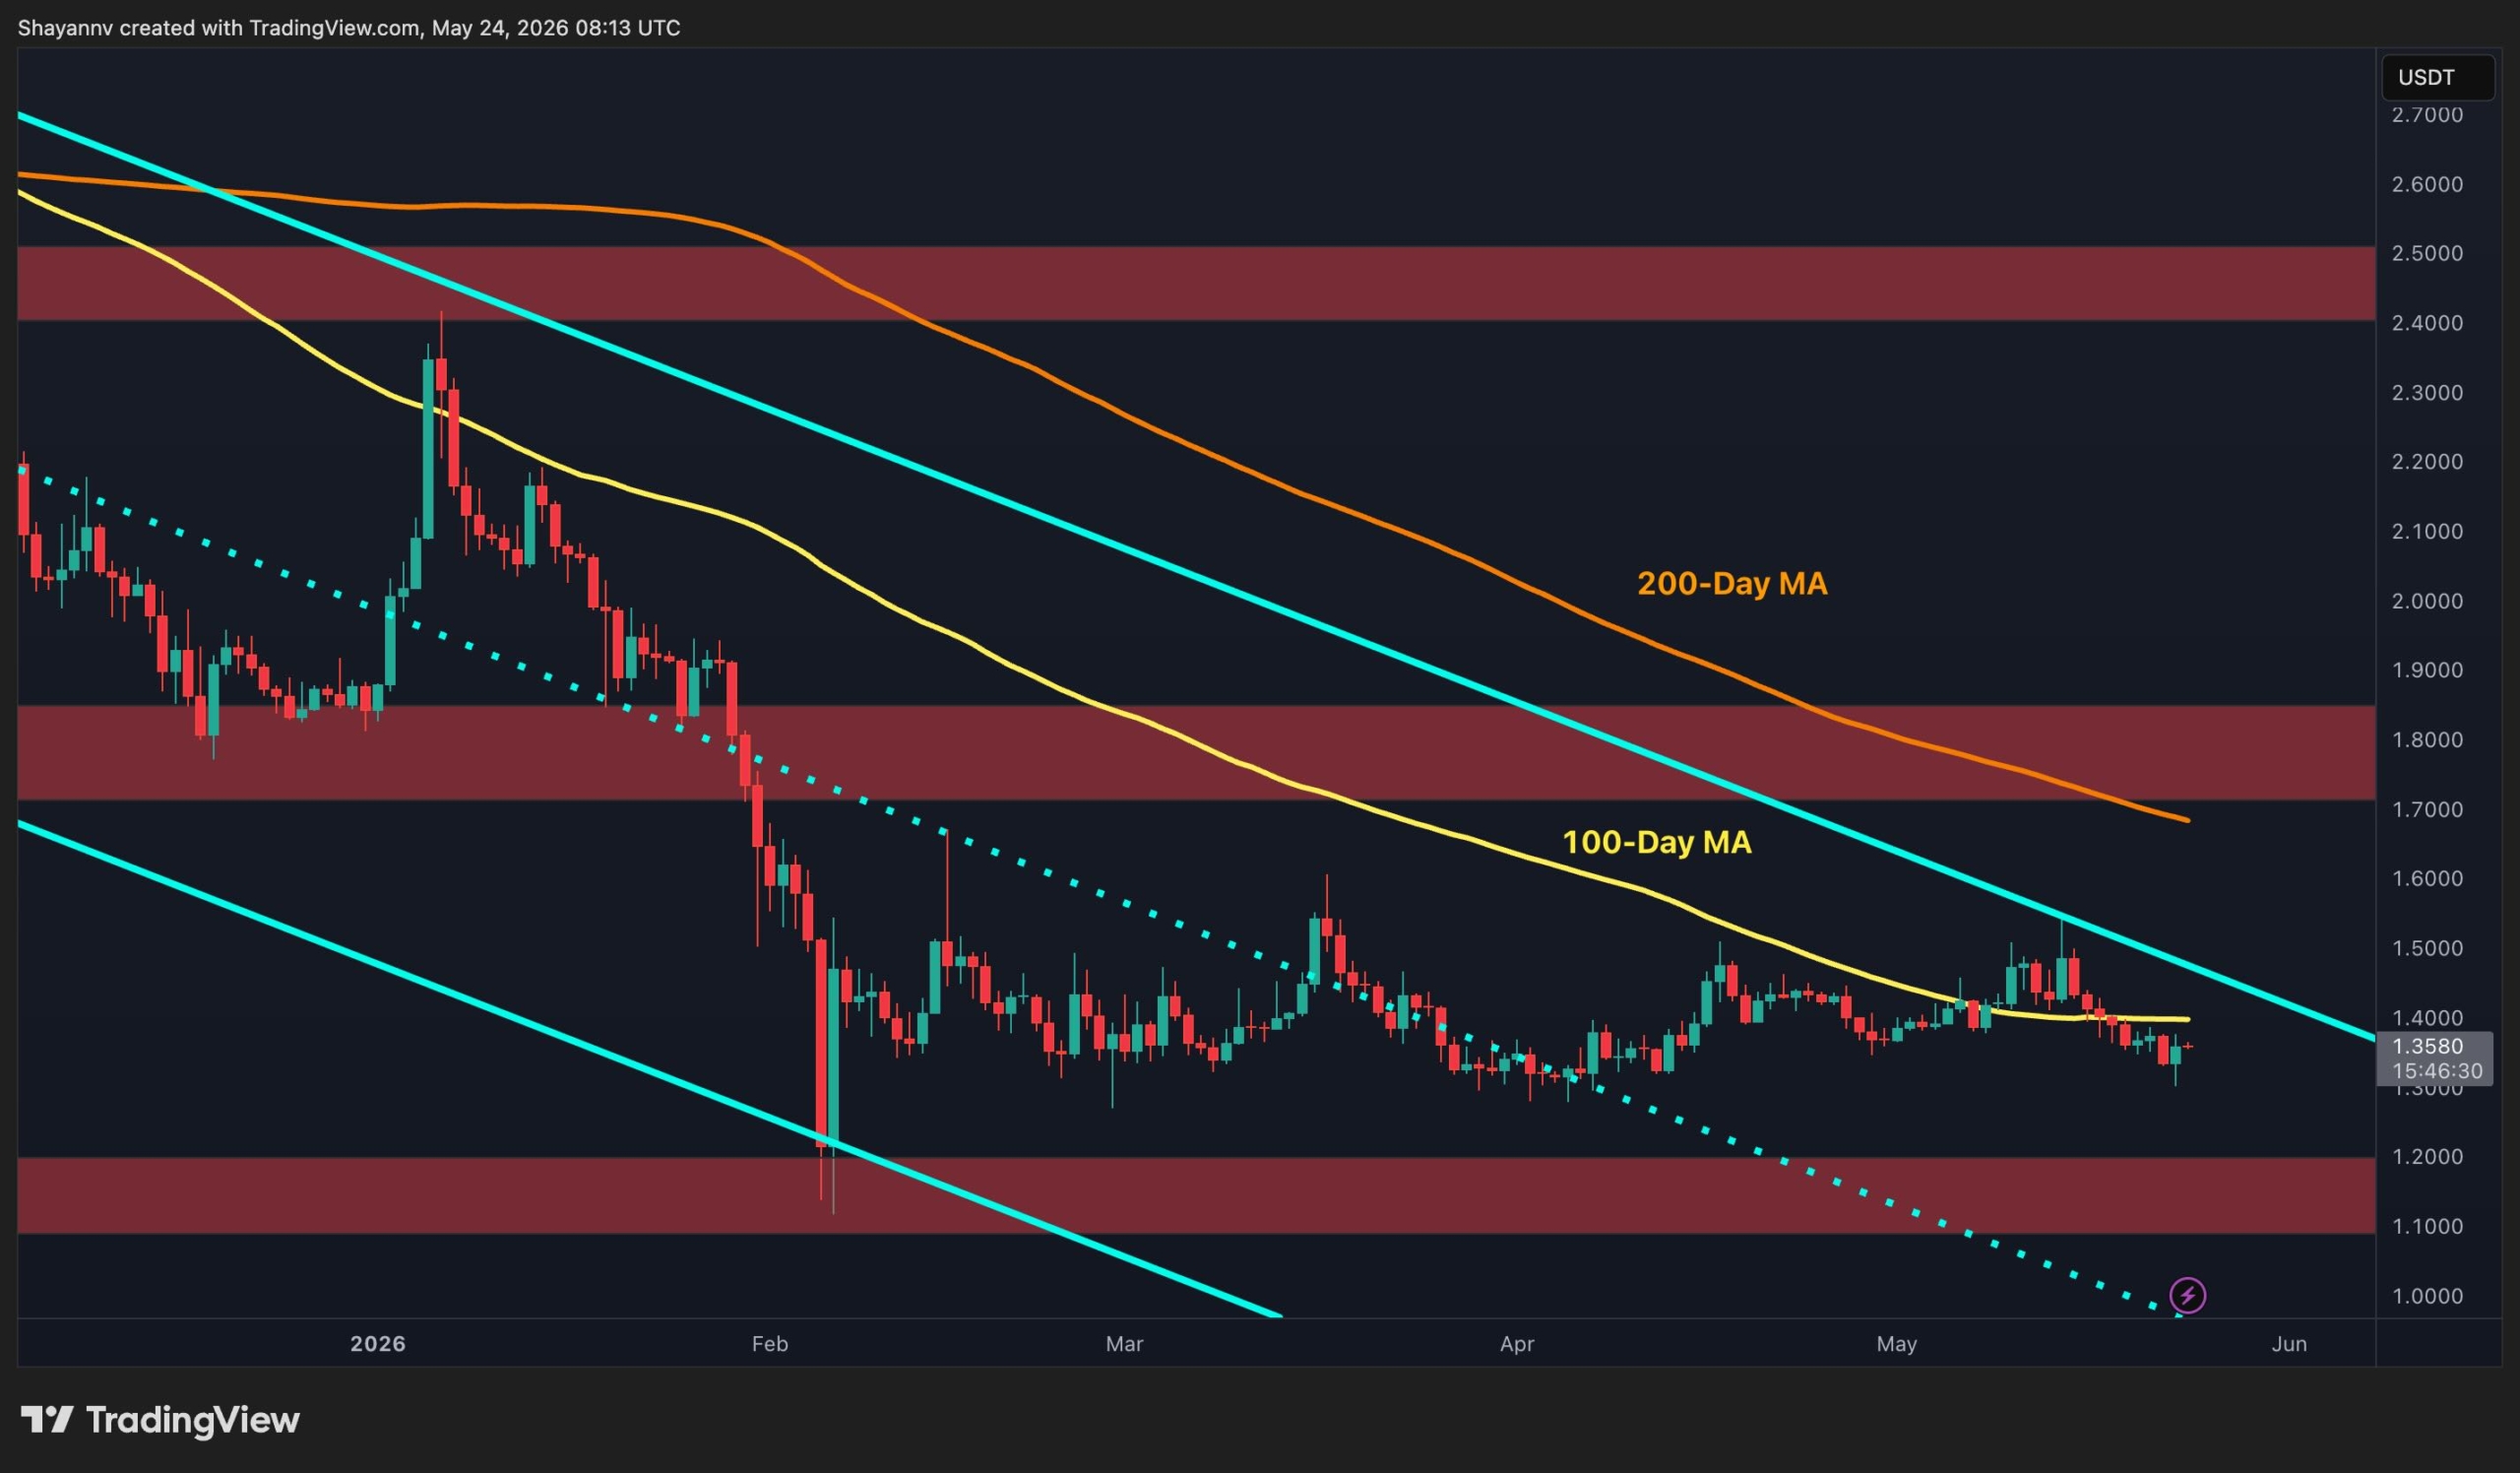
    On the daily timeframe, XRP remains below a long-term descending trendline and is struggling around the 100-day moving average, currently near $1.38. This moving average has recently acted as dynamic resistance, preventing buyers from sustaining upward momentum.

    The price is also approaching the narrowing section of a broader descending channel, suggesting a potential breakout is developing. As volatility compresses, XRP appears to be entering a decision zone where prolonged consolidation becomes less likely.

    Currently, the primary resistance level is the $1.75-$1.85 supply region, with stronger resistance around the 200-day moving average near $2.0. On the downside, key support is located around the $1.10-$1.20 demand zone.

    The most probable short-term scenario is continued compression around the 100-day moving average at $1.38, followed by an impulsive breakout. A bullish breakout above the descending channel and the $1.40-$1.45 area could trigger a recovery toward the $1.75-$1.85 resistance region. Conversely, rejection from current levels may reinforce the broader bearish trend and expose lower support levels.

    4-Hour Chart Analysis

    The 4-hour chart reveals a clearer range-bound structure. XRP has been oscillating between support around the $1.27-$1.30 zone and resistance near $1.53-$1.57 for several weeks, forming a relatively stable consolidation range.

    Recently, the price revisited the lower boundary of this range near $1.30, triggering another bullish reaction. This suggests buyers continue to defend the support area, increasing the possibility of a short-term move higher.

    As long as XRP holds above the $1.30 support region, the path toward the upper boundary around $1.53-$1.57 remains open. Such a move would represent a corrective bullish swing within the broader sideways structure rather than confirmation of a larger trend reversal.

    However, repeated tests of support tend to weaken demand over time. Therefore, failure to maintain the $1.30 level could invalidate the consolidation range and increase the probability of renewed downside pressure. For now, the market structure favors continued ranging behavior, with the upper resistance zone near $1.55 acting as the primary target for any short-term recovery.

  • Dogecoin Eyes Breakout After Fibonacci Retest

    Dogecoin Eyes Breakout After Fibonacci Retest

    Dogecoin Approaches Key Technical Level, Echoing 2024 Rally

    Dogecoin is currently navigating a technical zone that will be familiar to traders who followed its 2024 rally. The weekly chart indicates that Dogecoin is testing a long-term Fibonacci fan structure, drawn from its 2021 peak. The current retest is occurring near the 0.618 Fib fan, following a similar retest of the 0.5 Fib fan that preceded a significant price increase in October 2024. While this technical setup alone does not guarantee a breakout, it places Dogecoin at a crucial weekly decision point.

    Familiar Fibonacci Fan Structure

    The core of this technical analysis centers on Dogecoin’s ongoing trade within a long-term descending resistance structure, which originated from its all-time high of $0.7316 in 2021. The analysis also incorporates Fibonacci wave indicators, specifically expanding fan lines extending from the memecoin’s peak price. These lines have historically served as long-term resistance and breakout markers for DOGE since 2021.

    Dogecoin spent much of 2022 and 2023 trading below these fan lines, only experiencing substantial recoveries after reclaiming one of them. The October 2024 retest provides a point of comparison. During that period, DOGE fell below the 0.5 Fib fan area, consolidated below it for a period, and subsequently rallied, reaching as high as $0.48 in December 2024. The chart now shows a similar retest developing around the 0.618 Fib fan, with Dogecoin currently trading in the $0.10 to $0.11 range.

    Potential for Another Wave?

    Dogecoin’s current interaction with the indicator suggests it may be testing whether another Fib level can act as support. If it holds, the setup would indicate that Dogecoin is establishing another base at a Fib fan level, mirroring the Q4 2024 run.

    A bullish scenario would see DOGE holding above $0.095, breaking through $0.115, and then climbing back above $0.14. This would make the 0.618 Fib fan retest resemble the October 2024 setup, where a technical hold preceded a larger price increase. Conversely, a failed setup would undermine the pattern’s credibility, potentially leading Dogecoin to retest lower support zones. A weekly breakdown below $0.095 would weaken the current pattern and likely result in consolidation between $0.095 and $0.08.

    While Dogecoin’s current price structure is not yet bullish, historical precedent suggests a bullish outcome is the more probable scenario, as Dogecoin has not previously spent a significant amount of time trading below any Fibonacci fan level. At the time of writing, Dogecoin is trading at $0.1028.

  • Bitcoin Long-Term Holder Supply Surge Doesn’t Indicate True Demand

    Bitcoin Long-Term Holder Supply Surge Doesn’t Indicate True Demand

    Bitcoin’s price appeared poised for further declines over the weekend, dipping below the $75,000 mark on Saturday morning. However, the leading cryptocurrency has since recovered somewhat and is attempting to reclaim the $77,000 level as of this writing. Simultaneously, an increase in the supply held by Bitcoin’s long-term investors was observed, though the significance of this signal is questionable.

    Why BTC LTH Supply Data Is Potentially Misleading

    In a recent post on the X platform, the pseudonymous analyst Darkfost highlighted a surge in the Bitcoin supply held by long-term holders (LTH) over the past few days. However, this apparent rise in LTH activity may not be as indicative of Bitcoin’s growth as the data might suggest.

    Citing data from CryptoQuant, Darkfost noted that the long-term holder supply has increased from 15 million to 15.8 million BTC in the last two days. The on-chain analyst pointed out that this metric is among several data points affected by Coinbase’s movement of approximately 800,000 BTC in November 2023.

    Between November 22nd and 23rd, the U.S.-based crypto exchange transferred 800,000 BTC, then worth nearly $70 billion, between its internal wallets. As Darkfost explained, this maintenance transfer invalidated old LTH UTXOs (unspent transaction outputs) and created new, but skewed, Bitcoin datasets.

    The crypto analyst wrote on X: “As a result, datasets across multiple platforms incorporated this movement, affecting UTXO-based metrics, age and value cohorts, STH/LTH cost basis, realized value, volumes, and more.”

    Saturday, May 23rd, marked six months since the Bitcoin transfer, with the moved BTC now fully transitioned from the short-term holder (STH) to the long-term holder supply. Typically, an increase in LTH supply suggests increased accumulation and growing confidence among experienced crypto investors. However, market participants should exercise caution when interpreting this on-chain signal, as it may not accurately reflect an increase in investor demand.

    What’s Next For Bitcoin Price?

    In a separate post on the X platform, Darkfost identified the next major resistance level for Bitcoin’s price. Highlighting the STH cost basis, the analyst stated that this resistance currently sits just above the $80,000 mark. According to Darkfost, short-term investors appear to be opting to cut their losses rather than holding for a reversal, as evidenced by the resistance Bitcoin faces at their average cost basis. Therefore, the leading cryptocurrency needs a sustained break above the $80,000 ceiling for its recovery to continue.

    As of this writing, BTC is valued at around $76,490, reflecting a 1% price increase in the past 24 hours.

  • XRP Price Hints at Final Dip Before Potential Rally

    XRP Price Hints at Final Dip Before Potential Rally

    XRP Price Faces Critical Juncture as Compression Phase Tightens

    XRP is currently undergoing a compression phase, with technical analysis suggesting that its price action is nearing a pivotal point. This could see patience give way to panic before a clear direction emerges. The cryptocurrency’s chart presents a picture of uncertainty, but a crucial support level could determine XRP’s next move, along with a key price point needed for bullish confirmation.

    Descending Broadening Wedge Pattern

    XRP’s price has been trending downward, marked by lower highs since the start of the year. This extends to a correction from its July 2025 peak of $3.65. According to technical analysis by crypto analyst Egrag Crypto, this price action has formed a descending broadening wedge on XRP’s higher-timeframe chart.

    A descending broadening wedge pattern often appears during late-stage accumulation phases, characterized by expanding volatility within downward-sloping boundaries, rather than indicating outright weakness. “This is NOT a random formation,” the analyst wrote. “Historically, these structures often produce final capitulation THEN violent expansion.” Egrag Crypto’s chart indicates a 57% probability of an upside resolution, compared to a 43% chance of further downside. Current price action supports a downward move, leading Egrag to describe the current phase as short-term bearish compression, even though the broader macro structure remains bullish unless the pattern breaks.

    Key Levels to Watch

    The most critical downside level on the chart is $1.11. Egrag identifies this as crucial support, acting as the boundary between normal volatility within the structure and a more significant breakdown. XRP is currently trading around $1.36, below moving averages including the EMA20 at $1.391, the EMA50 at $1.404, and the EMA200 at $1.684. A drop below $1.11 would weaken XRP’s technical position and potentially lead to a 70% decline to $0.32. While not the analyst’s base case, this scenario highlights the potential for a liquidity sweep if the descending broadening wedge breaks downwards.

    The bullish outlook hinges on XRP confirming a move above $3. The analyst also noted that a weekly or monthly reclaim above the $2.65 to $3 range would be significant, as it would signal XRP breaking above the upper resistance area that has contained the broadening wedge.

    The CLARITY Act, which passed the Senate Banking Committee on May 14 and awaits a Senate floor vote, could potentially drive an additional $4 billion to $8 billion in ETF inflows into XRP. This influx of capital could realistically trigger a retest of that zone. Should XRP reclaim and hold above $3, Egrag’s expansion targets range from $7 to $11.

  • Ripple ETFs Hold Steady Amid Market Downturn, XRP Price Stays Flat

    Ripple ETFs Hold Steady Amid Market Downturn, XRP Price Stays Flat

    During a week of significant volatility for most exchange-traded funds (ETFs) tracking major digital assets, those following XRP’s performance remained positive. However, the underlying asset itself struggled to gain traction, even dipping to a multi-month low before a minor recovery.

    ETF Inflows Amid Broader Market Downturn

    Spot XRP ETFs experienced net inflows of just over $22 million during the previous week, extending a streak that began in May to three consecutive weeks. According to SoSoValue data, the last day with more outflows than inflows was April 30.

    While $22 million is less substantial than some previous inflows for Ripple ETFs, it’s notable that this occurred during a week when Bitcoin and Ethereum ETFs faced significant outflows. Spot Bitcoin ETFs recorded their worst trading week since late January, with over $1.25 billion leaving the funds. Ethereum ETFs saw a net withdrawal of $216 million, slightly less than the previous week’s $255 million. Furthermore, ETH ETFs have not seen a single day in the green since May 8.

    In contrast, ETFs tracking SOL gained over $15.5 million, while the two HYPE funds attracted over $72 million as the underlying asset outperformed and reached a new all-time high of just over $63.

    XRP Price Stagnation

    Despite the positive performance of the spot Ripple ETFs, XRP’s price failed to surpass $1.42. After being rejected at $1.55 the previous week, the token declined, starting the new business week at $1.42. It continued to fall with the broader market, culminating in a significant price drop yesterday to below $1.30.

    This marked its lowest price in over a month and a half, representing a 15% loss in value since the May 17 surge to $1.55. However, it rebounded in the last 24 hours, likely due to positive developments regarding the US-Iran war, and is now trading near $1.35.

    Technical Analysis and Outlook

    Ali Martinez warned that XRP has broken out of its rising trend line within a symmetrical triangle on the daily chart. He predicted a further decline to around $1.14 if the token fails to reclaim the $1.40 level soon.