Tag: Market Trends

  • Analyst: Crypto Market Resembles Nvidia Before AI Boom

    Analyst: Crypto Market Resembles Nvidia Before AI Boom

    Jeff Park has drawn a parallel between the current state of the cryptocurrency market and the pre-mainstream artificial intelligence era of Nvidia, arguing that the technological shift is apparent to early adopters but not yet widely recognized. In a Sunday post on X, Park defended the ideological foundations of crypto, characterizing the industry as being in a challenging “middle game” before on-chain capital markets become self-evident infrastructure.

    Nvidia Comparison

    Park’s comparison centers on Nvidia CEO Jensen Huang and Elon Musk’s first public appearance together at GTC 2015, a moment he described as occurring within a narrow window before AI became a mainstream consumer or institutional priority. By that time, Huang had spent decades supporting parallel graphics processing and had backed CUDA since 2006, while Musk had already had what Park called his “Hassabis moment” in 2012. OpenAI, he noted, had not yet been founded. “This is that narrow window where a revolution is visible to some but not others,” Park wrote, “in which both of these geniuses had early inklings of recognizing AI’s pervasive potential, but the broad public was not yet made aware. It would take another 10 years for it reach mainstream applications of course.”

    Crypto’s Current Position

    Park sees crypto in a similar position today. Before GPUs became central to the AI boom, the technology was supported by gamers, hobbyists, and researchers who pushed its capabilities without necessarily knowing they were helping subsidize a much larger computing transition. In his analogy, early DeFi played a comparable role for crypto by subsidizing the development path toward institutional tokenization. “Gamers subsidized AI’s development, just like early DeFi subsidized the institutional tokenization development,” he wrote.

    The core of Park’s argument is that crypto’s most difficult phase is not the early ideological phase or the eventual mature phase, but the transitional stage between them. He referenced Elon Musk’s remarks about autonomous driving at GTC 2015, where Musk said the simplest parts were very low-speed driving, where a vehicle can stop, and high-speed driving, where rules are more structured. The hardest part, in Park’s telling, is the 10-to-50 mph zone: urban environments with bikes, children, cones, manholes, and edge cases requiring both precision and speed.

    Park applied that framework to crypto infrastructure. The “0-10 mph” phase was permissionless money, a use case he said people could understand from a practical standpoint. The “50 mph+” phase, in his view, will be on-chain capital markets becoming obvious because of self-custody, capital efficiency, money velocity, and settlement optimization. The difficult part is what sits in between. “But its the 10-50 thats hard, where money in a pre-internet financial infrastructure is hitting AML/KYC, offshore capital conduits, discretionary bank risk models, lagging reporting regimes create all kinds of need of need for precision and speed that institutional infrastructure today needs to develop further,” Park wrote. “Its fundamentally solvable, but this is the most challenging portion of fulfilling the dreams of onchain capital markets.”

    Bitcoin vs. Crypto

    Park also distinguished between Bitcoin and the wider crypto sector, while rejecting the idea that support for one must exclude the other. He said Bitcoin and crypto are not trying to solve identical problems, even if both originate from a similar ideological impulse around open access. “I love bitcoin. But contrary to some opinion, I believe its possible to love crypto too, because bitcoin is a monetary experiment enabled by the evolution of technology, while most of crypto is the inverse: a technology experiment enabled by the evolution of money,” he wrote. “They are fundamentally solving different problems, though rooted in one ideal: to make its access as much of a public good as possible.”

    The Future of Crypto

    Park’s broader thesis is that the ideology behind crypto is not fading but changing shape. He described the “winning ideology” as “technological financialization,” a form of hyperfinancialization with decentralizing elements that exports sovereign finance, agentic rails, and self-determination as public goods. That framing matters because much of the industry’s current debate is focused on whether crypto’s institutionalization weakens its original purpose. Park’s answer is that the ideological layer remains essential, but the practical expression of that ideology is now moving through financial infrastructure, tokenized markets, and systems that need to interact with existing compliance and banking regimes. “This ‘middle game’ period will be remembered as the most critical juncture for the industry,” Park wrote, adding that the future belongs to “those who recognized it was always ideological.”

    At press time, the total crypto market cap stood at $2.55 trillion.

  • BitMine Eyes Liquidity Boost After Russell Index Inclusion

    BitMine Eyes Liquidity Boost After Russell Index Inclusion

    BitMine Immersion Technologies to Join Russell 1000 Index

    BitMine Immersion Technologies is set to join the Russell 1000 Index, an index that tracks the largest public companies in the U.S. and serves as a benchmark for equity exposure in institutional portfolios.

    Inclusion Driven by Semi-Annual Reconstitution

    The inclusion, scheduled to be finalized after the market closes on June 26, is part of FTSE Russell’s semi-annual reconstitution. This process reshuffles the market-capitalization boundaries between various equity groups to reflect changes in the market.

    Market Capitalization Exceeds Threshold

    BitMine’s market capitalization of $10.7 billion is well above the $5.7 billion threshold for large-cap inclusion, according to Chairman Tom Lee, who made the announcement in a post on X on Saturday. He noted that many active managers only purchase equities listed on the Russell 1000.

    Potential for Increased Demand

    Passively managed index funds and exchange-traded funds that track Russell benchmarks typically hold 20% to 25% of a member company’s total market cap, Lee added, suggesting a potential for significant forced buying that could drive demand.

    Stock Performance and Company Mission

    BitMine’s shares closed on Friday around $18.88, reflecting a 30% year-to-date decrease, according to Yahoo Finance. The stock has largely traded sideways since falling to a low of $17.19 in February, after reaching a high of $161 last year. (Disclosure: Lee is an investor in Dastan, the parent company of Decrypt.)

    For BitMine, inclusion in the Russell 1000 could attract inflows from investors who may not be fully aware of the company’s goal to increase its Ethereum holdings per share and secure 5% of Ethereum’s total supply, a sum valued at approximately $12.8 billion on Monday.

    The company currently holds 4.6 million Ethereum, worth $10 billion, representing 3.8% of Ethereum’s total supply, according to Strategic Ethereum Reserve. The firm began aggressively accumulating Ethereum last July.

    Ethereum traded around $2,100 on Monday, according to CoinGecko. The second-largest digital asset by market capitalization has decreased by 7.8% over the past month.

    Other Crypto Firms Affected

    BitMine isn’t the only crypto firm impacted by the reconstitution. Ethereum treasury company SharpLink is slated to join the small-cap Russell 2000 Index alongside the crypto exchange Gemini. Meanwhile, crypto financial services firm Galaxy Digital is expected to join the large-cap Russell 1000 Index.

    Historical Context

    Strategy, the world’s largest corporate holder of Bitcoin, joined the Russell 1000 Index approximately two years ago. In January, MSCI indicated that it would allow companies like Strategy to remain in its flagship global equity indexes, while shelving a controversial proposal.

    The proposal would have removed index eligibility from public firms holding more than 50% of their total assets in digital currencies. However, the decision ultimately averted what analysts estimated could have resulted in billions of dollars in forced institutional selling.

  • Korean Analyst Predicts XRP Could Reach $5

    Korean Analyst Predicts XRP Could Reach $5

    XRP Could Surge to $20, Analyst Says, Citing Potential Breakout

    XRP could potentially reach $20 if a breakout pattern from 2018 repeats itself, according to Ninedex, a pseudonymous Korean financial analyst. This projection, though not his primary forecast, depends on the token breaking above the upper boundary of a channel structure that has governed its price movements for over a decade.

    Current Price and Support Levels

    XRP is currently trading around $1.34, reflecting a nearly 13% decrease from its May 14 high of $1.54. Despite this pullback, Ninedex believes the token is maintaining a crucial support zone within a multi-year ascending channel, which has influenced XRP’s price since its inception in 2013.

    His analysis suggests that this support level is just above the lower boundary of the channel’s middle layer and aligns with the Fibonacci 0.382 level, corresponding to the $1.40 price range. This zone was established over an extended period between 2022 and 2024, which Ninedex considers a strong long-term support level in XRP’s history.

    XRP initially traded within the lower section of this channel before a broad crypto rally in early 2017 propelled it into the middle range. It briefly entered the upper channel in January 2018 when prices exceeded $3, but a subsequent correction pulled it back into the middle layer. Ninedex notes that the token has remained in this middle layer for the past eight years, and its ability to hold this zone has kept it among the major assets in the market.

    Technical Indicators and Future Outlook

    Ninedex highlighted two technical signals supporting his bullish outlook. The weekly stochastic indicator has rebounded from 15 to 20 points, a level he says has historically indicated rare oversold conditions for XRP.

    Additionally, the Moving Average Convergence Divergence (MACD) has formed a golden cross on its Exponential Moving Average (EMA) lines, with the oscillator returning to positive territory, which he interprets as a sign of increasing market momentum.

    His primary target is $5, achievable if XRP moves towards the upper boundary of the middle channel. However, he also noted that XRP’s history of sharp rallies and its large community could potentially drive prices significantly higher. If XRP breaks into the upper channel again, a $20 price target becomes a possibility.

  • Bitcoin Miner to Fly First Mars Mission.

    Bitcoin Miner to Fly First Mars Mission.

    Bitcoin Miner to Command SpaceX Mars Mission

    SpaceX has selected Chun Wang, co-founder of the Bitcoin mining pool F2Pool, to command its first private crewed interplanetary mission, which will fly past Mars.

    During a livestream of the Starship V3 launch, Wang delivered a pre-recorded announcement from Bouvet Island, confirming his role in the two-year Mars flyby mission. Wang, who co-founded F2Pool in 2013, has mined over 1.3 million BTC, representing more than 9% of all Bitcoin blocks ever produced.

    The funds for Wang’s space ambitions reportedly stem from over a decade of mining pool fees and his stake in the proof-of-stake business stake.fish, launched in 2018.

    This development highlights the maturation of crypto wealth, as Bitcoin mining profits are now directly financing interplanetary travel. SpaceX’s increasing ties to the crypto world add a structural demand narrative.

    Bitcoin Market Analysis

    Bitcoin is currently consolidating at $77,500, within a high-level compression zone just below the $80,000 psychological barrier. Trading volume has remained consistent, and key technical levels are clearly defined.

    Support is established at $75,000, the previous breakout zone with significant open interest and confirmed buyer absorption. Immediate resistance is between $82,000 and $83,000, where sellers have repeatedly capped rallies in recent sessions. The moving average structure remains bullish, with the price holding above its medium-term trend lines and no confirmed bearish crossover.

    Three potential scenarios are currently in play:

    • Bull Case: Continued ETF inflows push Bitcoin past $82,000, potentially opening a path toward the $100,000+ cycle targets predicted by major U.S. banks and asset managers for 2025–2026, based on post-halving supply dynamics.
    • Base Case: Bitcoin trades sideways between $74,000 and $80,000 due to market stress related to Middle East tensions.
    • Bear/Invalidation: A close below $70,000 would break the current structure and signal a downside resolution of the consolidation. However, current data does not support this scenario.

    Bitcoin Infrastructure Opportunities

    At $77,500, the asymmetric upside that early Bitcoin miners like Wang captured is no longer available on the spot market. This has led traders to seek opportunities in early-stage Bitcoin infrastructure.

    Bitcoin Hyper ($HYPER) is positioning itself as the first Bitcoin Layer 2 with Solana Virtual Machine (SVM) integration. It claims to offer sub-second transaction finality and smart contract execution faster than Solana, while leveraging Bitcoin’s security.

    The presale has raised nearly $33 million at a current price of $0.0136, with a 36% APY staking program already live for participants.

    The core thesis behind HYPER is that Bitcoin’s limitations, such as slow transactions, high fees, and lack of programmability, represent a market gap. HYPER aims to address this with a decentralized canonical bridge for BTC transfers and low-cost execution infrastructure.

  • Dogecoin Whales Shift Holdings

    Dogecoin Whales Shift Holdings

    Dogecoin’s price performance appears lackluster at first glance, but significant activity among the largest holders suggests a more complex dynamic. On-chain data indicates that major DOGE holders have resumed accumulating the cryptocurrency, even as its price remains below key technical levels for the year.

    Whale Activity Amidst Price Weakness

    Dogecoin has faced persistent downward pressure throughout much of 2024, with rallies repeatedly failing to surpass $0.10. This has amplified the significance of whale behavior, as large holders often accumulate during periods when smaller traders are selling, remaining on the sidelines, or losing interest.

    According to on-chain data tracked by crypto analyst Ali Martinez and sourced from Santiment, large DOGE holders purchased over 525 million tokens within a 96-hour period. This accumulation occurred while Dogecoin’s price was tightly consolidated just below its 200-day moving average, a long-term trend line currently hovering around $0.12. This level has acted as a resistance point for much of 2024. The rapid pace of this accumulation, occurring within just four days, is particularly noteworthy, demonstrating that large wallets were actively absorbing supply during a compressed trading window. Such buying activity can alleviate immediate selling pressure on Dogecoin.

    Notably, these large wallet inflows do not appear to be driven by Spot Dogecoin ETFs, which have recorded only $860,960 in inflows over the past week, a relatively small figure compared to the whale accumulation. Based on Dogecoin’s current price, the 525 million DOGE purchased by large holders is valued at over $52 million.

    The 200-Day Moving Average: A Key Hurdle

    The primary technical challenge for Dogecoin is its 200-day moving average. As of this writing, the 200-day MA is at $0.12, while Dogecoin is trading at $0.1025, approximately 15% below the moving average.

    A price breakout above the 200-day moving average would provide bulls with their first significant technical confirmation in months. It would suggest that the whale accumulation is beginning to influence the chart and could prompt short-term traders to reassess Dogecoin’s position.

    According to crypto analyst Cryptollica on X, Dogecoin is currently presenting an opportunity that has only materialized a few times in the past 12 years, referencing previous cycle bottoms in 2015, 2020, and 2022. In each instance, DOGE experienced a prolonged period of inactivity. The Dogecoin Cycle Score has now fallen back into the rebuild zone, a level consistently observed when interest in the meme coin is at its lowest. A break above the 200-day MA could potentially trigger a rally.

  • HYPE Token Surges Past $60 Amid Whale Accumulation

    HYPE Token Surges Past $60 Amid Whale Accumulation

    HYPE Surges to New Highs Amidst Whale Accumulation

    HYPE has surged to an all-time high, reaching $65 yesterday, a move that has captured the attention of the broader crypto market at a time when most assets are experiencing selling pressure. The breakout is significant in itself, but data from Hyperliquid reveals details about who is accumulating the asset, adding a layer of conviction to the price action that the chart alone cannot provide.

    Whale’s Strategic Accumulation

    Garrett Jin, the trader identified as the one who placed a $735 million short position on Bitcoin immediately before the October 10 market crash – a call that became one of the most discussed and accurate large-scale trades of the cycle – has been buying HYPE over the past four days. This accumulation totals 145,050 tokens at an approximate cost of $9.05 million. More significantly, Jin has placed a TWAP order – a time-weighted average price execution that automatically continues buying at measured intervals – to acquire an additional 39,940 HYPE worth approximately $2.44 million.

    TWAP orders are not reactive trades. They are deliberate, systematic accumulation strategies used by participants who want to build a position over time without moving the market against themselves. Garrett Jin is not responding to HYPE’s all-time high breakout; he has been building towards it and has automated the next phase of that build to continue regardless of short-term price fluctuations. The trader who called October’s crash is signaling something specific about where he believes HYPE is headed.

    A $9M HYPE Bet Alongside $77M in Active Positions

    The Hyperliquid data reveals the full portfolio context that makes the HYPE accumulation more significant than a standalone transaction. Garrett Jin is actively managing a multi-asset book simultaneously, and the HYPE position is being built alongside, not instead of, his existing commitments.

    On the long side, Jin holds 504.4 Bitcoin worth approximately $38.9 million, a substantial directional bet on Bitcoin’s recovery that reflects continued conviction in the broader crypto market despite recent weakness. This position size places him in a category of trader whose Bitcoin view carries real financial consequence.

    On the short side, Jin holds 57,460 ZEC worth approximately $38 million, a position currently down approximately $2.11 million, representing a deliberate bet against Zcash that he has maintained through that unrealized loss. The willingness to hold a losing short reflects the same conviction management that characterizes his track record.

    The combined picture describes a trader running approximately $77 million in active directional positions across three assets simultaneously while systematically adding to HYPE through an automated accumulation order. This is not a casual allocation or a momentum chase; it is a calculated addition to an already substantial and actively managed book from the same participant who identified October’s crash before it happened.

    HYPE Enters Price Discovery

    HYPE has entered a powerful price discovery phase after breaking decisively above its previous all-time highs near the $50 level. The daily chart shows a clear acceleration in momentum over the past two weeks, with buyers reclaiming control after months of consolidation and gradually building higher lows since March. The breakout above the previous resistance zone triggered an explosive expansion move that pushed HYPE toward the $65 region, confirming one of the strongest trend structures currently visible across the crypto market.

    The combination of price strength and volume expansion makes the move particularly significant. Recent candles show rising participation as HYPE pushed vertically higher, suggesting the rally is not occurring on thin liquidity alone. Volume increased aggressively during the breakout, reflecting strong market interest and sustained buying pressure rather than a temporary short squeeze.

    Technically, HYPE remains firmly above the 50-day and 100-day moving averages, both of which are now trending upward and acting as dynamic support zones. The 200-day moving average sits far below current price levels near the mid-$30 range, highlighting how extended the current bullish structure has become. As long as HYPE holds above the former breakout area around $56–$58, bulls maintain control of the trend. However, after such a sharp expansion, volatility and profit-taking risk are likely to increase substantially in the short term.

  • PI Network Price Forecast for the Week

    PI Network Price Forecast for the Week

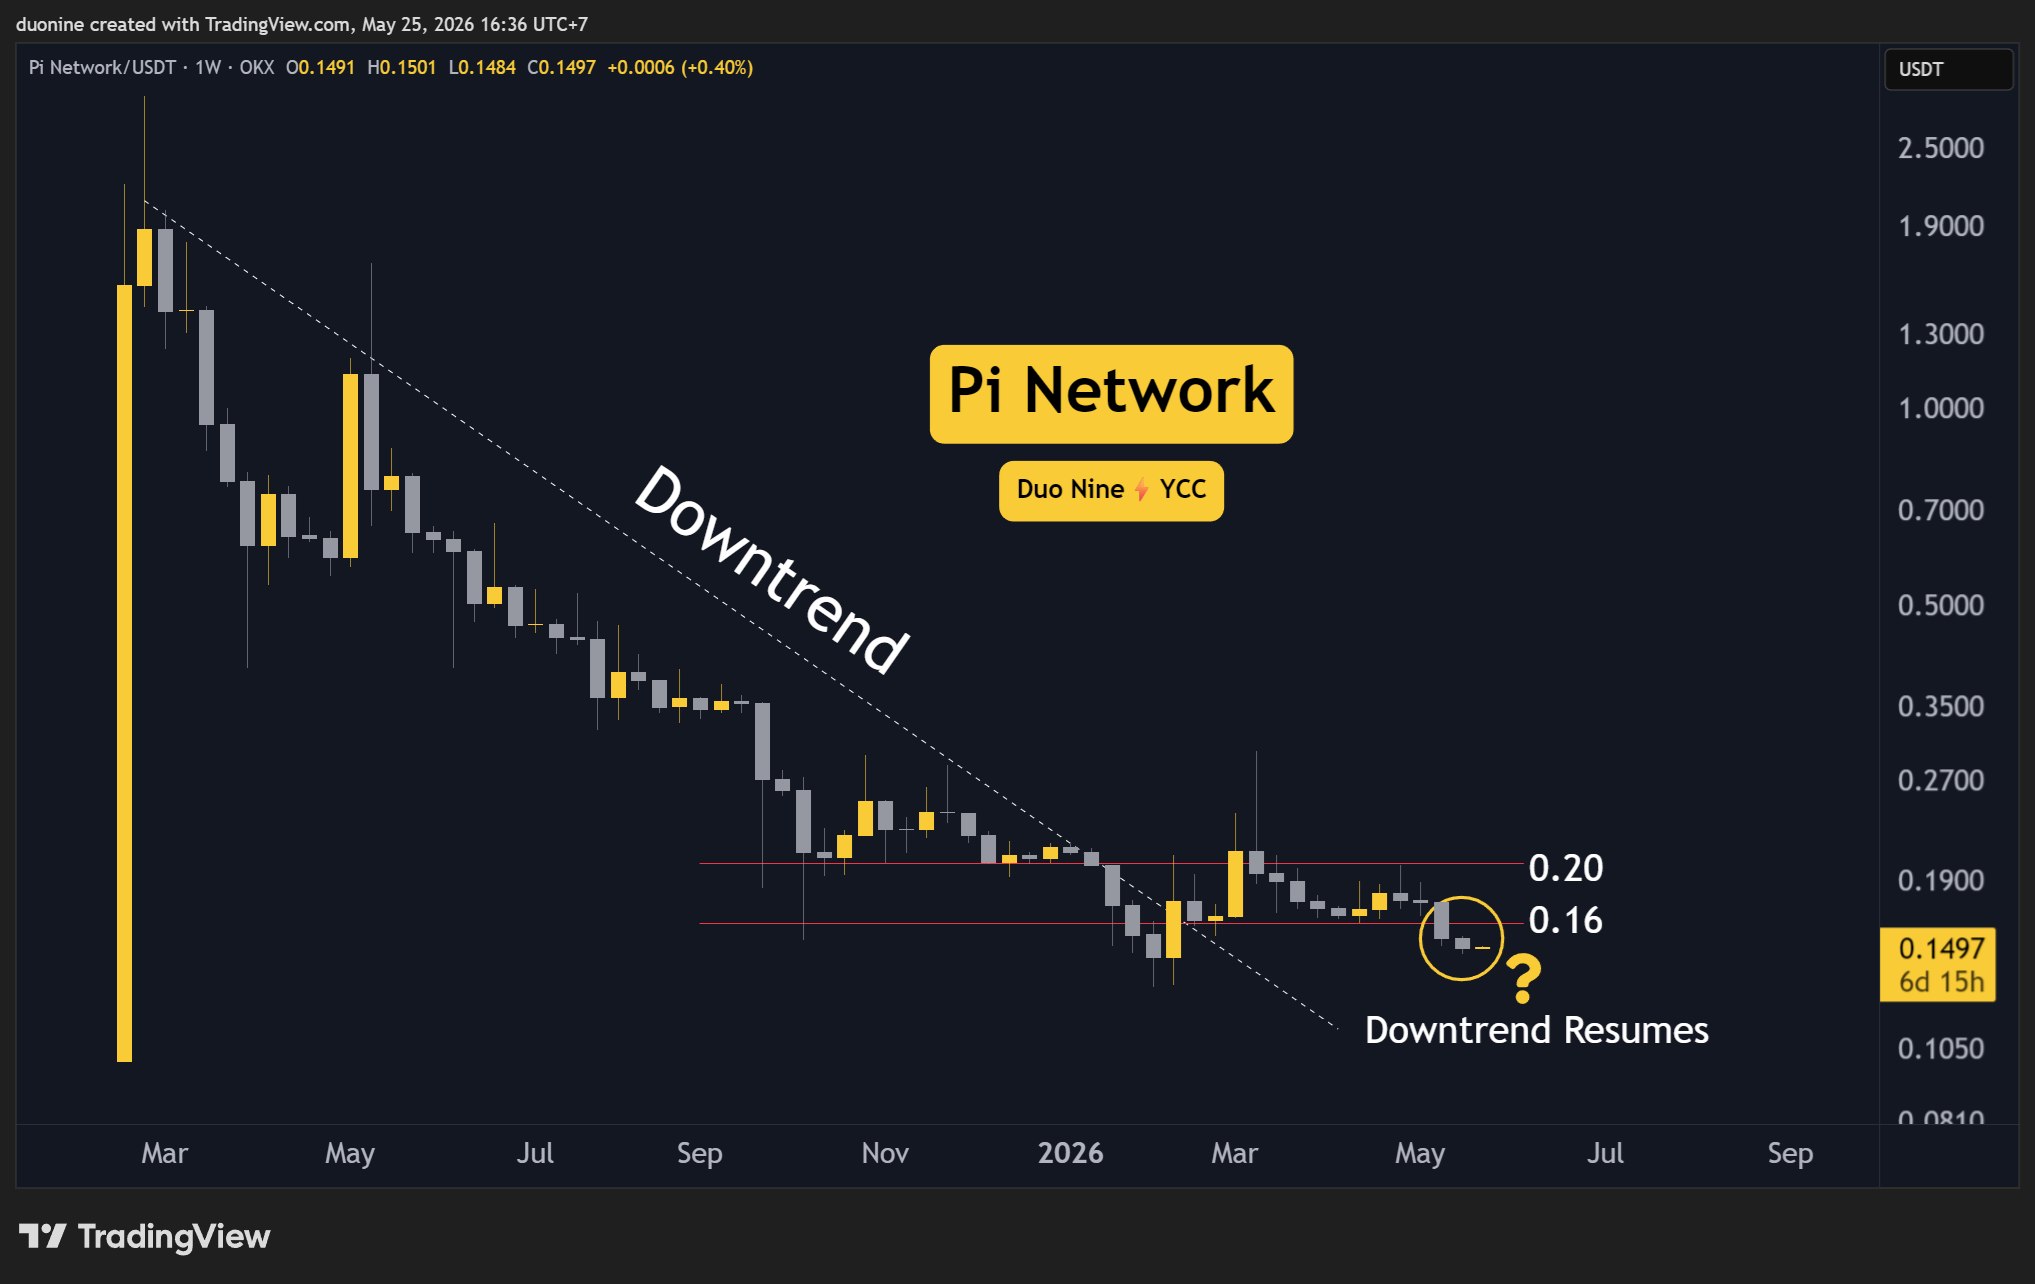
    Support at $0.15 Tested for Pi Network

    Key Support Levels: $0.15, $0.13
    Key Resistance Levels: $0.16, $0.20

    Following the loss of support at $0.16, the price of Pi Network (PI) quickly fell to $0.15, where some buying interest has emerged. However, it remains uncertain whether this support level will hold. A stronger support level is seen at $0.13, which has previously prevented further declines.

    With this recent breakdown, sellers have regained control, potentially driving PI lower, even as buyers attempt to halt the downtrend. This is notable given that PI has already corrected by 96% from its all-time high.

    Despite the current advantage for sellers, their trading volume remains low, creating lower highs. This suggests a lack of strong conviction or limited interest in pushing PI’s price significantly lower.

    If the $0.15 support level holds, buyers could attempt to reclaim $0.16 and regain momentum, potentially reversing the recent losses since the price action turned bearish.

    The 3-day Moving Average Convergence Divergence (MACD) continues to fall to new lows, as indicated by its histogram. While this is bearish, it is occurring with decreasing sell volume. This could be interpreted as a bullish divergence, suggesting a potential reversal.

    If the MACD histogram flattens this week, it would signal that sellers are losing control of the price, potentially leading to a relief rally.

  • Ripple (XRP) Price: Three Key Factors to Watch

    Ripple (XRP) Price: Three Key Factors to Watch

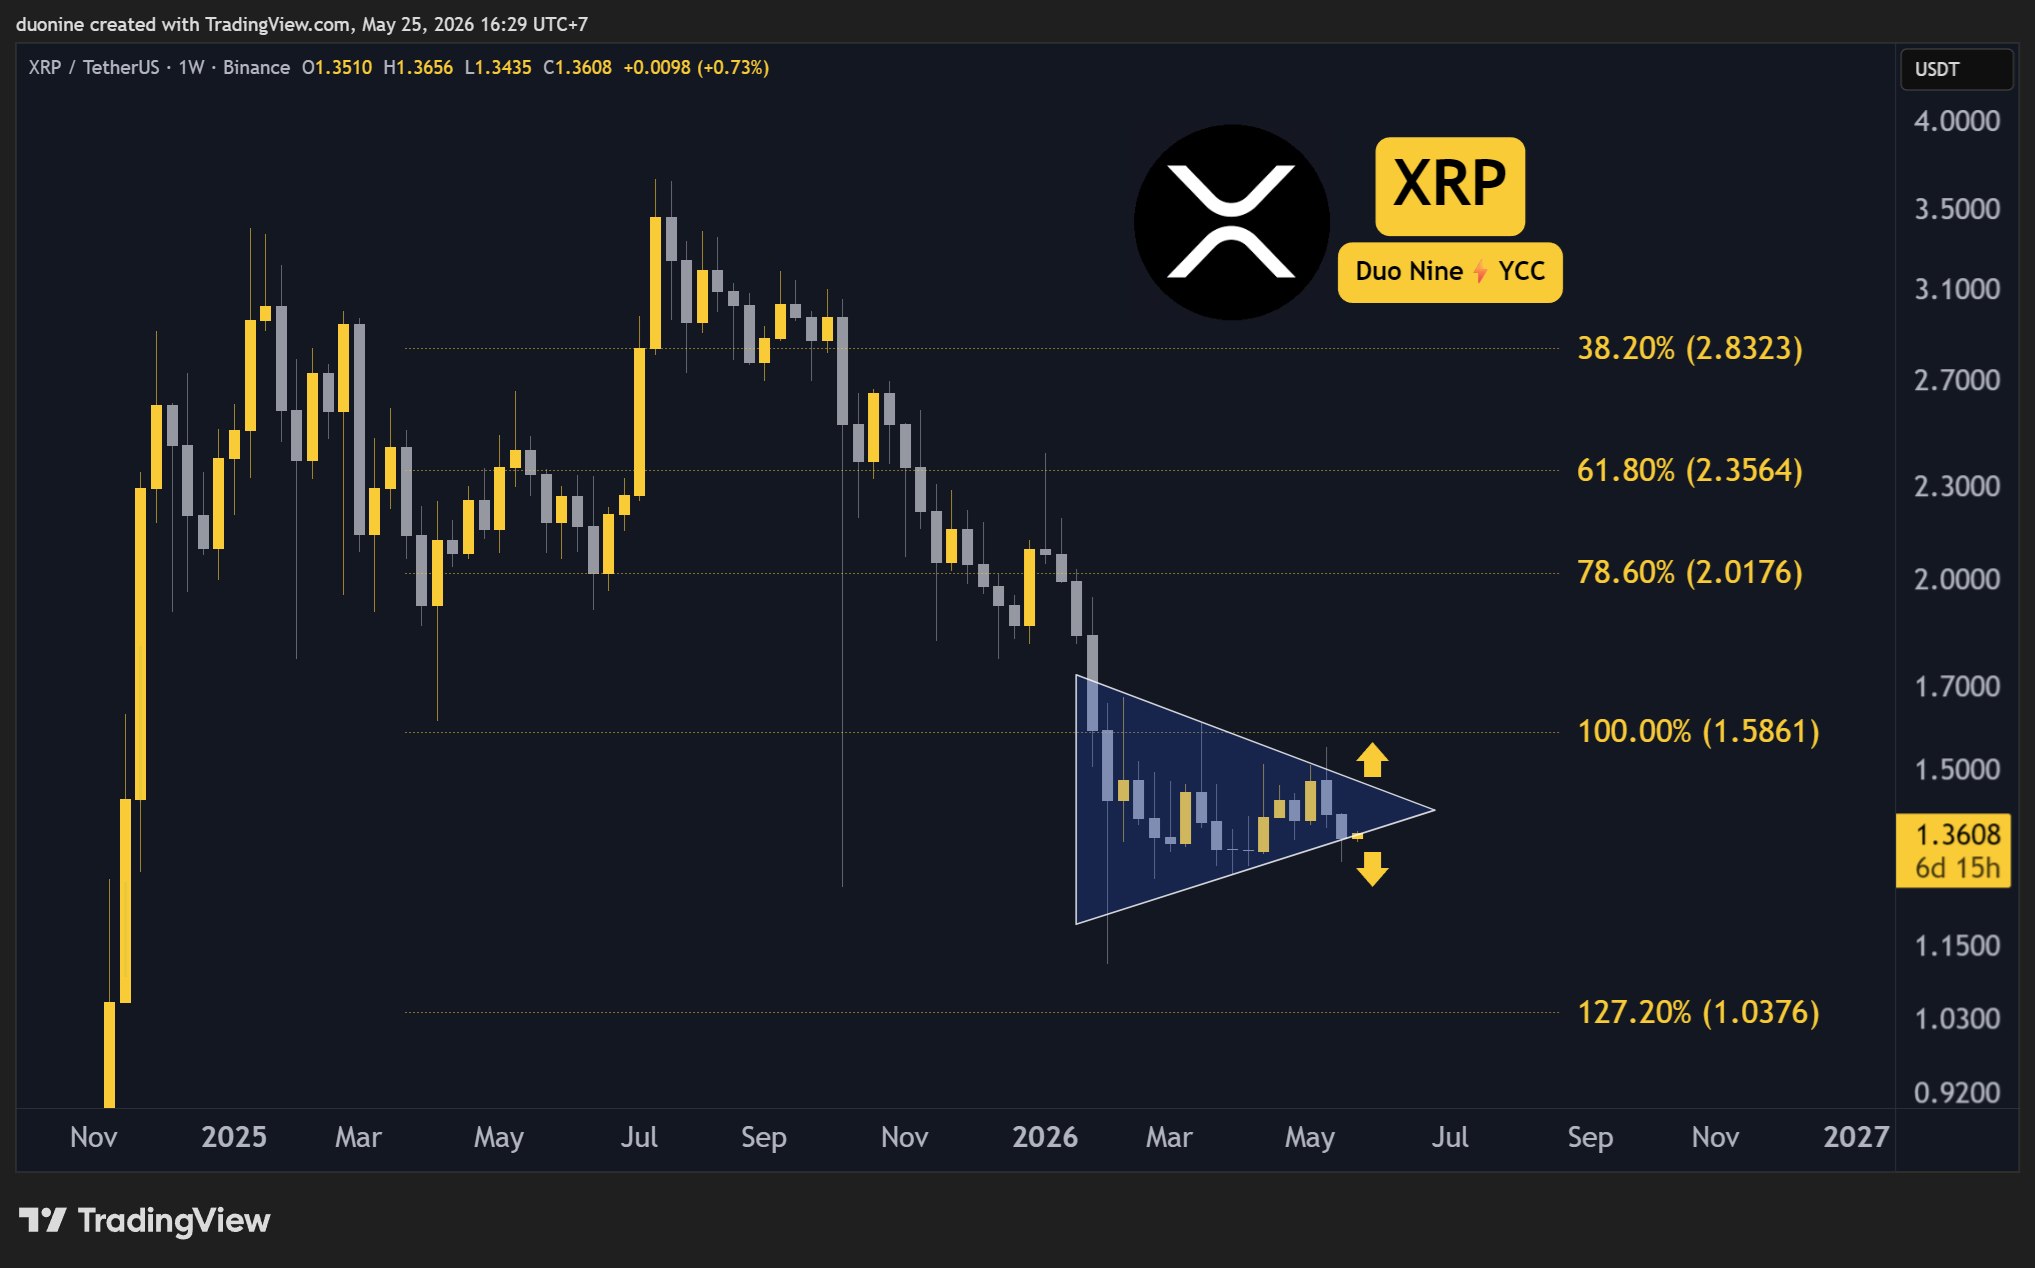
    XRP Attempts to Regain $1.4 Support

    Key support levels: $1.2, $1
    Key resistance levels: $1.4, $1.6, $2

    In a notable shift, the price of XRP has reversed course after exiting a blue pennant formation and is now attempting to reclaim the $1.4 support level. A successful recapture of this level would signal a bullish reversal.

    Halting the Downtrend

    Amidst the ongoing struggle between buyers and sellers, XRP has managed to temporarily halt its downtrend. The price has also established a higher low, which is another positive indicator.

    Seller Exhaustion

    The price decline from $1.6 to $1.3 was swift, with no periods of respite. Sellers were highly active, but they now appear to be losing momentum. Since the price touched $1.3, the selling volume has diminished, and buyers are re-entering the market.

    Potential for Recovery

    This shift positions the price favorably for recovering some of its recent losses. This recovery could be further strengthened if buyers successfully reclaim the $1.4 support level, potentially establishing a solid foundation for a retest of the next resistance level at $1.6.

    RSI Indicators

    The 4-hour Relative Strength Index (RSI) has already bottomed out and is demonstrating clear higher highs and higher lows. The RSI moving average is also trending upward. If bulls can sustain this buying pressure and volume, the RSI is likely to remain above 50 and potentially reach 70, which would indicate a strong uptrend.

    If the initial days of this week close in the green, the cryptocurrency has a strong possibility of breaking out from the pennant, with $1.6 as a key target for its rally.

  • XRP Liquidity on Exchanges Hits Lowest Point Since 2020

    XRP Liquidity on Exchanges Hits Lowest Point Since 2020

    XRP Price Outlook: Exchange Liquidity Lowest Since 2020

    XRP’s price is signaling potential volatility as the exchange liquidity index for XRP has fallen to its lowest level since 2020, indicating a significant structural shift.

    Market Dynamics

    The tightening supply of XRP is evident in declining exchange reserves and increased holdings by large investors, raising concerns about a potential liquidity crisis. This development coincides with a drop in XRP spot volume on Binance following recent market downturns. The price of XRP has fallen to $1.35, representing a 2% decrease this week.

    The combination of thin liquidity and the ongoing discussion surrounding a potential Exchange Traded Fund (ETF) creates conditions that could lead to significant price fluctuations.

    Technical Analysis

    XRP is currently consolidating below its recent high of $1.50, struggling to maintain its position within the upper range of its weekly trading band. Support levels are clustered around $1.31, which marks the lower boundary of the seven-day trading range.

    Momentum indicators are mixed. The 0.5% daily price drop is mirrored by stagnation in futures activity and at the exchange level. These factors have been highlighted as contributing to market instability in recent weeks, and data from Binance confirms that this pattern is intensifying.

    Potential Scenarios

    Three potential scenarios could unfold in the near term:

    • Bull Case: Increased speculation regarding ETF approval could drive XRP to retest $1.50. DeepSeek’s AI model projects a price target of $5 by late 2025 if institutional adoption accelerates.
    • Base Case: Consolidation continues within the $1.30-$1.40 range as the market awaits a catalyst, such as the Clarity Act.
    • Bear Case: Deteriorating liquidity could accelerate, widening spreads and potentially pushing the price towards the $1.31 support level.

    The ETF flow dynamic remains a key factor to monitor in the coming months.

    Infrastructure Solutions

    XRP’s low liquidity highlights a broader structural issue affecting multiple assets. Fragmented liquidity across different blockchain networks contributes to the price distortions currently observed in XRP. For traders, the underlying infrastructure becomes a crucial aspect of their investment strategy.

    LiquidChain ($LIQUID) is a Layer 3 infrastructure project designed to address this issue. Its Unified Liquidity Layer integrates liquidity from Bitcoin, Ethereum, and Solana into a single execution environment.

    With LiquidChain, developers can deploy applications once and access all three ecosystems simultaneously. Its Single-Step Execution and Verifiable Settlement features aim to eliminate the multi-step bridging processes that contribute to liquidity fragmentation.

    The LiquidChain presale has surpassed $800,000, with the current price of $0.01463 per $LIQUID. Capital is increasingly flowing into on-chain infrastructure projects as the $1 million milestone approaches.

  • Whale Dumps $9 Million in HYPE, More Sales Expected

    Whale Dumps $9 Million in HYPE, More Sales Expected

    HYPE’s price has experienced a significant surge over the past week, increasing by 40% and reaching a new all-time high above $64.

    Profit-Taking Slows Rally

    The rally appears to have slowed in the last 24 hours, with some investors opting to take profits rather than pursue further gains. HYPE climbed from below $40 to over $64 in the past few weeks, marking the most impressive rally in the crypto market during that period. This surge added billions of dollars to Hyperliquid’s total market capitalization and was driven by increased trading volume and substantial interest.

    Whale Activity Signals Shift

    As anticipated, the rally has begun to slow as some investors seek to realize profits. The on-chain analytics account Lookonchain identified a wallet that sold 151,574 HYPE, valued at $9.25 million, a few hours ago. The trader has also placed limit sell orders for an additional 170,000 HYPE, worth approximately $10.6 million, at prices between $63.45 and $70.55.

    Market Position and ETF Performance

    At the time of this report, HYPE is the 11th-largest cryptocurrency project by total market capitalization, estimated at around $15 billion. The altcoin is undoubtedly the best-performing large-cap crypto this week, and its price surge has brought it close to surpassing Dogecoin for the 10th position.

    HYPE-based spot exchange-traded funds are also experiencing a surge in assets under management, contrasting with a generally declining market. While Bitcoin ETFs saw over a billion dollars in AUM outflows, HYPE attracted more than $70 million, according to CryptoPotato.