Tag: Market Trends

  • Render Token Surges 30% Amid On-Chain Gains

    Render Token Surges 30% Amid On-Chain Gains

    Render’s value has surged to a four-month high, driven by increased demand for AI infrastructure and a surge in on-chain activity. Over the past week, Render has risen by more than 30%, bucking the trend of consolidation seen across the broader cryptocurrency market.

    Recent Performance

    The altcoin’s recent performance is illustrated in the following chart. Last Tuesday, RENDER was trading around $1.80, but has since climbed to $2.35. This represents an increase of over 30% in the last seven days, bringing the asset’s value to its highest point since January.

    Factors Driving the Surge

    Several factors may be contributing to this rally. Render differs from many cryptocurrencies in that its network functions as a marketplace for GPU computing power. The decentralized platform connects users seeking GPU rendering capabilities with those willing to rent out their hardware. As the AI sector has experienced recent growth, demand for GPUs has increased significantly. This has positively impacted platforms like Render, potentially explaining some of the momentum seen by the network’s native token.

    On-Chain Activity

    This momentum has been accompanied by a rise in the blockchain’s activity-related metrics, according to data from on-chain analytics firm Santiment.

    Santiment noted on X that Render has seen a notable jump in Daily Active Addresses and Network Growth recently. Daily Active Addresses tracks the total number of addresses making at least one transaction on the blockchain each day, providing an estimate of daily user participation. Network Growth measures activity from newly generated wallets, indicating the level of adoption the chain is experiencing.

    The following chart, shared by Santiment, illustrates the changes in these two indicators for RENDER over the past month. The chart shows a rise in both Network Growth and Daily Active Addresses alongside the recent price rally, indicating increased user adoption and activity. Currently, there are 394 active addresses and 118 new wallets on the network, the highest daily levels since March.

  • HYPE Fuels Rally, Eyes $170 Target

    HYPE Fuels Rally, Eyes $170 Target

    Whale Traders Bullish on HYPE Token as Retail Sentiment Dips

    Whale traders have established their most aggressive net-long positions in eight months on Hyperliquid’s HYPE token, even as retail investors hold a 12-month bearish extreme. Data suggests this divergence typically resolves in favor of the larger players.

    Diverging Positions

    Data from Alphractal indicates that since early May, large traders have been quietly accumulating leveraged long positions, while retail participants have turned bearish and begun short selling into the rising trend. Historically, such a split has triggered a wave of short covering by retail traders, pushing prices higher. At the time of reporting, HYPE was trading at $62.05, with a 24-hour trading volume of $830 million and a market capitalization exceeding $15 billion. The token experienced a 2% dip over the past day, but its technical outlook remains bullish. Prices are trading well above the 20-day simple moving average of $47.97 and have broken above the upper Bollinger Band, which analysts suggest signals strong momentum but also potential short-term overextension.

    Technical Analysis and Key Levels

    Crypto analyst Bitcoin Meraklisi noted that HYPE closed a daily candle above $59.54, a level that had previously acted as significant resistance. Based on the cup formation on the chart, this breakout opens a technical path toward $170, representing a roughly 175% increase from current prices. The $59.54 zone is now considered critical support. If the price holds above this level, traders believe the bullish case remains intact; failure to do so could jeopardize the breakout.

    Institutional Interest Grows

    In related news, Grayscale has filed a third amendment with the SEC regarding a potential Hyperliquid ETF. Payments firm MoonPay has also launched access to USDH and USDC through the Hypercore network, reflecting growing institutional interest in the Hyperliquid ecosystem.

    Broader Market Context

    The broader rally began in mid-May, following a period of consolidation in April. Prices have risen sharply since then, and the Moving Average Convergence Divergence (MACD) indicator has been trending upward in positive territory, with increasing green histogram bars supporting the move. The Bollinger Bands have widened significantly, indicating elevated volatility. TradingView data shows a sharp price increase from early February lows to its current range.

  • Ethereum Price Stalls Amid Record Staking, Analyst Says

    Ethereum Price Stalls Amid Record Staking, Analyst Says

    Ethereum has fallen below the $2,100 level as selling pressure intensifies, overshadowing a recovery that has struggled to find solid support since mid-May. While the decline is concerning, an analysis by CryptoOnchain has identified a contradiction within the network data, suggesting the current price weakness is more complex than a simple bearish outlook implies.

    The Contradiction in Data

    The contradiction lies between two data points that should not be moving in opposite directions simultaneously. The ETH 2.0 staking rate has reached a new all-time high of 32.18%, representing the largest portion of Ethereum’s total supply ever committed to the network’s validator infrastructure. This indicates that more ETH is locked in long-term staking contracts than ever before, reflecting strong conviction in Ethereum’s long-term value among a significant group of holders.

    However, the network’s organic activity tells a different story. Median token transfer size and transaction fees have plummeted by 80% to 90% compared to the 90-day average. The daily utility that drives genuine demand for block space, including transactions, DeFi activity, NFT volume, and protocol interactions, has nearly vanished. CryptoOnchain describes the current state of the Ethereum blockchain as an “on-chain ghost town.”

    This presents a paradox: record conviction on one hand, and near-zero organic activity on the other, both occurring simultaneously within the same network at the same price. The analysis examines what is holding the structure together, and the answer is the most alarming element revealed by the data.

    Record Staking and Empty Network

    The CryptoOnchain analysis poses a critical question: if organic network activity has collapsed and US institutional spot demand has disappeared, why isn’t Ethereum’s price reflecting these twin absences more severely?

    The Coinbase Premium has dropped to -0.12, confirming that American institutional spot buyers, who fueled the most significant phases of Ethereum’s previous recoveries, have reduced their active accumulation. On-chain activity metrics confirm that retail and protocol users are also largely absent. The two categories of participants whose genuine demand has historically supported Ethereum price levels are both missing simultaneously.

    The Phantom Network: Binance Leverage vs. On-Chain Ghost Town

    The analysis suggests that offshore derivatives are the key factor. Binance Funding Rates have surged 688% above the 90-day baseline, remaining positive at +0.01. Speculative leveraged positioning on the world’s largest derivatives exchange is currently sustaining Ethereum’s price in the absence of spot demand and network utility, which would typically provide that foundation.

    The structural assessment is direct. Peak staking creates a genuine supply floor, as 32.18% of total ETH locked in validators represents a meaningful reduction in immediately available sell-side supply, thus limiting downside in a structural sense. However, a price sustained by derivatives leverage rather than spot demand or network utility is vulnerable. Leverage flushes do not occur gradually. When funding rates at 688% above baseline encounter a catalyst that forces deleveraging, the adjustment happens rapidly, and the supply floor provided by staking cannot absorb the speed of that kind of unwind.

    Technical Outlook

    Ethereum continues to trade near the critical $2,100 level after weeks of sustained selling pressure. The daily chart shows ETH trapped below the major resistance region between $2,280 and $2,380, an area that repeatedly rejected bullish momentum throughout May. Technically, Ethereum remains below the 200-day moving average, which continues trending downward, reinforcing the broader bearish market structure.

    Despite the weakness, bulls are still defending the $2,050–$2,100 support region aggressively. A decisive breakdown below this area would likely expose Ethereum to a deeper move toward the broader demand region around $1,800–$1,900. Volume has gradually declined during the recent consolidation, reflecting market indecision. For bulls to regain momentum, Ethereum likely needs to reclaim the $2,200 level and then break decisively above the $2,300–$2,400 resistance cluster.


  • Bitcoin Spot Volume Plunges 81% Since October 10th

    Bitcoin Spot Volume Plunges 81% Since October 10th

    Bitcoin Faces Selling Pressure Amidst Market Uncertainty

    Bitcoin is experiencing renewed selling pressure as global financial markets remain dominated by uncertainty, though bulls have thus far managed to defend the crucial $75,000 region. The cryptocurrency remains trapped below key resistance levels after failing to regain momentum above $80,000 earlier this month, leaving traders seeking signs of stabilization or further declines.

    Spot Trading Volumes Plunge

    While recent weakness has raised concerns across the market, analyst Darkfost believes a significant indicator is the dramatic collapse in spot trading activity. According to Darkfost’s data, Bitcoin spot trading volumes have fallen to levels historically associated with bear markets. The analyst notes that one must look back to July 2023 to find a period where BTC spot volumes were this low across major exchanges.

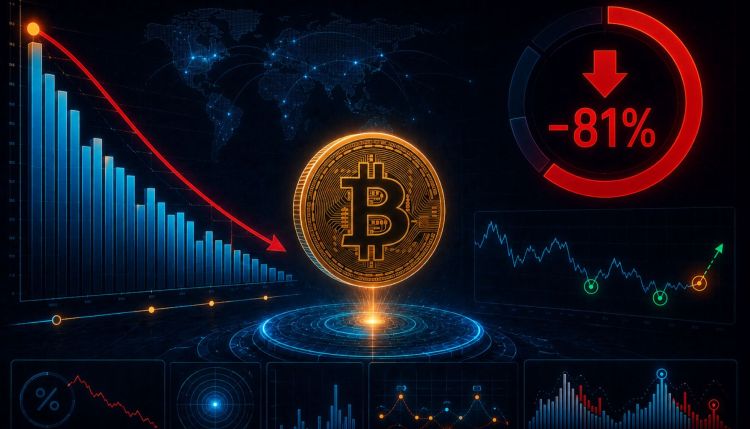
    Binance, the dominant venue in the crypto market, currently processes around $36.4 billion in trading volume. In October 2025, that figure stood at approximately $198.6 billion. The decline is significant, with Binance volumes nearly five times lower than at the cycle peak, representing an 81% decrease. Other exchanges show similar weakness, with Gateio volumes falling nearly 80% and Bybit recording a 66% drop in activity.

    Macroeconomic Factors Weigh on Crypto

    Darkfost explains that the collapse in Bitcoin spot trading activity reflects a broader macroeconomic environment increasingly hostile toward risk assets like cryptocurrencies. Rising inflationary pressures, persistent uncertainty surrounding global monetary policy, and the prolonged US/Iran conflict have pushed investors toward safer assets. Commodities, energy markets, and major equity indices have absorbed a large portion of capital flows that previously rotated into crypto during periods of stronger risk appetite, resulting in a sharp contraction in participation across spot crypto markets.

    Lower trading activity often reflects declining enthusiasm, weaker speculative demand, and reduced institutional engagement. However, Darkfost argues that the current setup may not be entirely bearish from a structural perspective. Historically, prolonged declines in spot volume have frequently coincided with the later stages of corrective phases rather than the beginning of major collapses. As participation fades, aggressive selling pressure also begins to weaken because fewer market participants remain actively distributing positions into the market. The analysis points specifically to the 2023 bear market structure, where spot volumes collapsed to similarly depressed levels shortly before Bitcoin stabilized and volatility returned. That period of extreme inactivity ultimately became the foundation for the recovery phase that followed, as exhausted sellers gradually lost control of the market.

    Bitcoin Holds Key Support

    Bitcoin continues trading above the critical $75,000 support region despite persistent selling pressure and weakening market participation. The daily chart shows BTC consolidating near $76,800 after rejecting the $82,000 resistance zone earlier this month, with price now trapped between major moving averages as traders await a decisive breakout or breakdown.

    Technically, Bitcoin remains above the 50-day moving average, which is currently acting as short-term support around the mid-$75,000 area. That level has become structurally important because it aligns closely with the broader horizontal demand zone between approximately $73,000 and $75,000 highlighted on the chart. Bulls have repeatedly defended this region throughout May, preventing sellers from regaining full control of the trend.

    However, the broader structure still reflects caution. The 100-day and 200-day moving averages continue sloping downward overhead, reinforcing the idea that Bitcoin remains inside a larger corrective environment despite the recovery from February’s lows near $63,000. For now, Bitcoin remains in a compression phase. A decisive reclaim of the $80,000–$82,000 region would strengthen bullish momentum, while losing the $75,000 support zone could expose BTC to a deeper retrace toward the $70,000 area.

  • Sharplink and Forward Industries to Join Russell Indexes

    Sharplink and Forward Industries to Join Russell Indexes

    Sharplink, a publicly traded firm holding Ethereum, will be added to the Russell 2000 and 3000 indexes on June 29, according to an announcement made Tuesday. The inclusion is part of the indexes’ semiannual restructuring.

    Peer Inclusion

    Sharplink’s inclusion follows that of BitMine Immersion Technologies, another Ethereum treasury firm, which will be added to the Russell 1000 index, tracking the top 1,000 U.S. companies by market capitalization.

    “Joining the Russell 2000 and Russell 3000 is a meaningful validation of Sharplink’s institutional-grade ETH treasury strategy and we believe will broaden SBET’s shareholder base while strengthening our access to capital markets,” said Joseph Chalom, CEO of Sharplink, in a statement.

    Sharplink currently holds 874,351 ETH, valued at approximately $1.8 billion. According to Yahoo Finance data, the firm was trading at a discount to its Ethereum holdings, with a market capitalization of around $1.22 billion at the close of trading on Tuesday.

    Forward Industries Joins

    Forward Industries, a Solana-focused crypto treasury firm, will also be included in the Russell 2000 and 3000 indexes, the company announced.

    The medical design firm, which has become a significant holder of Solana, purchased $1.58 billion worth of SOL last year at an average price of about $232 per SOL. However, SOL is now trading at $83.78, a 64% decrease since the firm’s purchase.

    Consequently, Forward Industries’ Solana holdings are now valued at approximately $588 million, significantly exceeding its current market capitalization of $350 million. Based on this valuation, the firm is approximately 2.4 times larger than the smallest market capitalization member of the Russell 2000, according to the index fund’s website.

    Index Impact

    The inclusion of these firms in the Russell Indexes places them within a group of U.S. indexes with over $12.2 trillion in benchmarks or investments.

    “We believe index inclusion will expand our shareholder base, improve trading liquidity, and increase visibility among long-term institutional investors,” said Ryan Navi, CEO of Forward Industries, in a statement.

    Shares of the firms reacted differently to the news. Sharplink (SBET) shares dipped about 0.8% on Tuesday, closing at $6.18 per share. Meanwhile, Forward (FWDI) shares rose 2.62%, trading around $4.70 at the close of trading.

  • Analyst Highlights XRP Pricing Flaw

    Analyst Highlights XRP Pricing Flaw

    A crypto analyst has identified a discrepancy in XRP’s current valuation, arguing that its low price does not reflect its true potential. The analyst believes that XRP trading at around $2 suggests the market still perceives the cryptocurrency as a speculative asset, lacking genuine growth drivers. He posits that once XRP is widely adopted for global value transfer, its price will appreciate to reflect its real valuation, potentially reaching the four- to five-digit range.

    Analyst: Single-Digit XRP Valuations Are a Misconception

    According to BarriC, a crypto market analyst on X, many investors are still treating XRP as a short-term trading opportunity rather than considering its intended purpose. The analyst considers this perspective a significant “mistake,” particularly as XRP continues to trade around $2. BarriC explained that most retail traders remain focused on price speculation, often debating whether XRP can reach targets like $3, $5, or even $10. However, the analyst believes this mindset overlooks the larger role XRP was designed to play within the global financial system.

    According to BarriC, XRP was not created to simply exist on crypto exchanges while investors wait for its price to increase. Instead, it was built to facilitate rapid and efficient value transfer across international borders. He noted that the altcoin was also designed to transfer money between institutions and within the global financial system. The asset was developed as part of Ripple, a payment network aimed at improving global money transfers and liquidity movement.

    With its use cases and core value drivers now clearly defined, BarriC argues that the real question is no longer whether XRP can climb from $2 to $5, calling such price targets “retail thinking.” Instead, he believes that investors should focus on what could happen once XRP is no longer primarily treated as a speculative trade and begins operating as part of the global financial infrastructure. According to BarriC, this shift could completely transform the conversation and narrative surrounding XRP’s valuation and long-term pricing.

    $10,000 Target Linked to Global Financial Role

    In his X post, BarriC noted that once XRP becomes a globally recognized and widely adopted financial rail, a $100 price target “stops sounding crazy.” He added that discussions about a possible move toward $1,000 could begin to spread across the market, largely due to the demand, liquidity, and transaction volume that could follow broader institutional and global adoption.

    Taking the projection further, the analyst believes that XRP could eventually enter the five-figure territory, forecasting a potential rally to $10,000. He said that such an ambitious move would be driven less by market hype and more by XRP’s role in liquidity provision, cross-border settlement, and its global scale.

    BarriC concluded his analysis by noting that many people in the crypto market are still debating the wrong valuation range for XRP. He said that they still view the cryptocurrency through the speculative lens of today’s market. However, he said his outlook is different and is based on the idea that XRP was built for a future financial system.

  • Dogecoin’s Decline Fuels Correction Fears

    Dogecoin’s Decline Fuels Correction Fears

    Dogecoin Faces Potential Correction After Channel Rejection

    Dogecoin’s failure to maintain its position at the upper boundary of its multi-week trading channel has sparked concerns of a more significant price correction. After losing momentum near resistance levels, DOGE is now testing the crucial $0.1020 support zone, where buyers must step in to prevent further downward pressure.

    DOGE Tests Key Mid-Channel Support

    Dogecoin has recently experienced a price decline following a test of its upper channel boundary. Crypto analyst Ali Charts notes that the asset has retreated to the $0.1020 level, a cooling-off period that provides a clearer view of the market’s current structural integrity after testing overhead resistance.

    This specific price point is technically significant, acting as a critical juncture for the asset. The $0.1020 level aligns with both the midpoint of DOGE’s multi-week trading channel and the 50-day Simple Moving Average (SMA), creating a strong area of technical confluence that market participants are closely watching. If buyers can successfully defend this support, the current setup favors a constructive recovery, with the price potentially aiming to reclaim lost ground and return to the upper channel resistance situated at $0.1156. Conversely, a failure to defend this support could signal a tactical dip, potentially serving as a mechanism to flush out overleveraged positions before further movement. In such a scenario, the market focus would immediately shift toward the lower boundary of the channel at $0.0883, which stands as the next significant area of interest for traders anticipating deeper volatility.

    Dogecoin Retraces After Upside Liquidity Sweep

    Trading Different highlights that Dogecoin is currently undergoing a retracement following a recent sweep of a liquidity zone to the upside. This downward move suggests that the market is attempting to stabilize, with price action currently engaged in a search for a reliable support foundation.

    To the upside, the most significant liquidity pool is firmly anchored at $0.10445. This area represents a solid cluster of accumulated orders; however, as the price continues to lose ground, this target is drifting further out of reach. Consequently, the barrier to a bullish reversal is increasing, making this level an increasingly challenging objective for the bulls to reach in the short term without a substantial shift in market sentiment.

    Looking toward the downside, substantial liquidity is concentrated at $0.10040. With bearish pressure currently dominating the market landscape and the distance to this zone remaining minimal, the technical setup suggests a high probability that this level will be swept in the immediate future. Traders are likely to closely monitor this specific pocket, as it serves as a critical magnet for the current price decline.

  • Analyst Predicts Litecoin’s Path to $1,000 After 13 Years

    Analyst Predicts Litecoin’s Path to $1,000 After 13 Years

    Litecoin Rally Roadmap Outlined by Crypto Analyst

    Crypto analyst Crypto Patel has laid out a potential roadmap for Litecoin (LTC) to reach $1,000. Patel remains bullish on the cryptocurrency, despite it trading over 80% below its all-time high, citing a multi-year accumulation phase.

    In a post on X, Patel divided the potential rally into three phases. The first phase anticipates LTC reclaiming the $100 to $140 range between now and next year. Phase two projects a rally to between $200 and $280, potentially occurring between the post-halving period and 2028.

    Phase three, according to Patel, would represent the peak of the bull cycle, occurring between 2028 and 2029. During this phase, he expects LTC to surpass its current all-time high and potentially reach a “blow-off top” between $500 and $700. Patel added that a rally to $1,000 would require a multi-cycle thesis extending beyond 2030.

    The analyst also provided a probability assessment for these targets. He estimates a 20% to 30% probability of LTC reaching $500, possibly during the next bull cycle peak. Patel believes a $1,000 target is only achievable in an extreme bull case scenario with full institutional adoption, assigning this a 5% to 10% probability. He suggests the most likely scenario involves a rally to between $150 and $300 between now and 2028, with a potential extension to $600 during peak market euphoria.

    Patel cautioned that Litecoin is not a “100x rocket” but a “slow, reliable cycle beta play,” advising investors to hold for up to five years rather than a few months. He sees value in the $40 to $50 range for spot accumulation, noting that LTC is currently in a deep, multi-year accumulation zone where institutional investors are quietly building positions.

    Reasons for Bullish Outlook

    Crypto Patel’s bullish stance on Litecoin is supported by several factors, including the launch of an LTC ETF by Canary Capital. He also highlighted the 2027 halving, which he believes could trigger a supply shock. Furthermore, Patel cited Litecoin’s mainstream adoption, the MWEB privacy layer, and the narrative positioning it as “silver to Bitcoin’s gold” as reasons for optimism.

    Bearish Considerations

    The analyst also outlined a bearish perspective. He noted that a $500 price target for LTC implies a $42 billion market capitalization, while a $1,000 target would require an $84 billion market cap. Patel also pointed out that LTC has not yet reclaimed its 2021 all-time high, unlike Bitcoin, Ethereum, and Solana, suggesting a lack of structural demand at scale. He also noted weak flows into LTC ETFs and the absence of smart contracts on the Litecoin network.

  • Hyperliquid Launches Macro Prediction Markets; HYPE Token Surges.

    Hyperliquid Launches Macro Prediction Markets; HYPE Token Surges.

    Hyperliquid has expanded its offerings by adding macro events to its outcome-based markets, just weeks after their initial launch.

    New Markets Launched

    The platform currently supports two new markets. However, both have minimal open interest at the time of this report. The initial Bitcoin “above or below” daily market has generated approximately $140,000 in volume over the past 24 hours.

    HYPE Token Surge

    This development coincides with a renewed rally in the price of the HYPE token. The token has surged by about 8% in the last few hours, reaching a new all-time high of over $64.3. HYPE has been one of the best-performing cryptocurrencies in recent weeks, rising from below $40 this month. This growth has been fueled by increasing institutional demand and overall market enthusiasm.

    Positive ETF Flows

    HYPE exchange-traded fund (ETF) flows were positive last week, contrasting with the broader industry, which experienced over $1.5 billion in cumulative outflows.

    Outcome Market Volume

    Data from hl.eco indicates that the cumulative outcome market volume has surpassed $52 million. While this is significantly less than the volumes seen on platforms like Polymarket or Kalshi, it is important to note that Hyperliquid’s outcome markets were launched only a few weeks ago.

  • XRP Struggles to Recover as RLUSD Surpasses $1.7 Billion.

    XRP Struggles to Recover as RLUSD Surpasses $1.7 Billion.

    Ripple’s RLUSD stablecoin has surpassed a $1.7 billion market capitalization, achieving one of the fastest ascents for a stablecoin since its launch in December 2024, even as the price of XRP remains stagnant.

    RLUSD Adoption and XRP’s Stagnation

    The growing use of RLUSD in settlement activity on the XRP Ledger indicates genuine adoption beyond its initial users. However, analysts confirm that the stablecoin’s growth has had little impact on the buying pressure for XRP. The contrasting trajectories of the stablecoin and XRP suggest they are, for now, separate trends.

    XRP’s Technical Outlook

    With compressed volatility, a symmetrical triangle pattern tightening on the daily chart, and a crucial resistance zone approaching, XRP is nearing a critical juncture.

    The price of XRP is currently confined within a multi-week consolidation range, compressing price action into a tighter band. The symmetrical triangle formation on the daily timeframe reflects a balance between buyers and sellers.

    Immediate resistance is clustered between $1.38 and $1.42, with a stronger ceiling at $1.45, where the 100-day moving average converges with the upper boundary of a long-term descending channel. This confluence makes the $1.40–$1.45 zone the most significant technical level on XRP’s chart at present.

    Support is equally well-defined. The $1.30–$1.32 range has held as a floor through multiple tests, but a decisive break below this level could lead to a drop to $1.20, which would shift the structure to a bearish outlook.

    Analysts monitoring the consolidation note that low-volatility environments like this often precede significant price movements.

    Opportunity Cost for XRP Holders

    XRP’s stagnation at current levels raises concerns for holders: how much further upside is possible for an asset with an $80 billion-plus market cap that has yet to break above $1.45? Waiting for a breakout, which may take weeks, carries a real opportunity cost, especially as early-stage assets are rapidly raising capital.

    Maxi Doge Presale

    Maxi Doge ($MAXI) is one presale attracting attention in the current cycle. Built on Ethereum (ERC-20), it is positioned as a meme token for the high-leverage trading mindset, embodying the relentless drive of bull market culture.

    The project is priced at $0.000282, with over $4.7 million raised to date. It also offers 65% APY staking, holder-only trading competitions with leaderboard rewards, and a Maxi Fund treasury for liquidity and partnerships.

    Meme-focused marketing with a focus on viral energy completes the community strategy.