Tag: Market Trends

  • Dogecoin’s Key Pattern Returns, Echoing 2021 Surge

    Dogecoin’s Key Pattern Returns, Echoing 2021 Surge

    Dogecoin Rally Setup Revived Amidst Technical Analysis

    Dogecoin has been trading around the $0.10 mark for several months. However, a new monthly chart shared by market analyst @TATrader_Alan is drawing comparisons to the pattern that preceded the cryptocurrency’s significant rally in 2021. The analyst highlights a recurring triangle formation that has appeared before each major Dogecoin expansion cycle. The current setup is now approaching the same breakout zone that historically triggered substantial upward momentum.

    Dogecoin Rally Setup Reappears

    The analyst’s latest monthly chart reveals a repeating formation observed across three distinct market cycles. In each instance, Dogecoin traded within a narrowing triangle structure for months before experiencing a sharp, vertical advance. The first instance occurred before the 2017 bull market, while the second preceded the massive 2021 breakout, which delivered gains exceeding 30,000% from cycle lows.

    The chart shows that both previous formations followed nearly identical patterns. Price gradually compressed between descending resistance and rising support lines before eventually breaking upward with force. Following the breakout, Dogecoin entered a rapid expansion phase characterized by large green monthly candles and increased momentum.

    The current structure appears to mirror those earlier conditions closely. Dogecoin has spent several years tightening within converging trendlines, with the price now positioned near the formation’s apex. According to the chart projection, this region historically marked the beginning of Dogecoin’s most significant advances.

    The pattern’s long-term timeframe is notable. Monthly structures often carry greater technical significance because they reflect broader investor positioning and multi-year market behavior rather than short-term volatility. Analysts tracking the setup believe the extended compression phase could amplify the intensity of any eventual breakout move if historical behavior repeats.

    Monthly Breakout Signals Growing Momentum

    The formation’s timing is also attracting attention because Dogecoin continues to hold near the psychologically important $0.10 level on the monthly chart. Despite broader market fluctuations, the asset has maintained support around that range while gradually pressing against descending resistance that has capped price action since the previous cycle peak.

    The analyst’s projection suggests the breakout zone has now been reached, mirroring the positioning seen before earlier rallies. On the chart, projected purple candles indicate a possible expansion phase that could push Dogecoin toward levels not seen since the previous bull market’s peak.

    Beyond the technical structure, market participants are also watching growing institutional involvement in the digital asset sector. Speculation surrounding crypto-based exchange-traded products, renewed meme coin activity, and increased retail participation have all contributed to improving sentiment around Dogecoin in recent months.

    While the chart does not guarantee another parabolic rally, the similarity between the current structure and the formations that preceded previous rallies has become difficult for traders to ignore. With Dogecoin now at another critical monthly inflection point, analysts believe the coming months could determine whether the meme coin will experience another historic rally.

  • XRP’s Trillion-Dollar Play Could Surge Price to $300+

    XRP’s Trillion-Dollar Play Could Surge Price to $300+

    CharuSan Reiterates Bullish XRP Prediction, Addressing Market Cap Concerns

    Crypto analyst CharuSan has again commented on his prediction that XRP could surge above $300, addressing concerns about the token’s potential market capitalization. He argues that the market cap metric is not a relevant factor for XRP’s price trajectory.

    Trillion-Dollar Markets as Catalyst

    In a post on X, CharuSan pointed to the vast sums of money in global Nostro/Vostro accounts, the foreign exchange markets, major banks, the Depository Trust & Clearing Corporation (DTCC), and institutional corporations as reasons why XRP could reach $300. He suggested that a bridge asset carrying this volume would need to reach a value of $10 trillion to prevent the system from becoming congested.

    The analyst emphasized that XRP is designed as an institutional bridge asset and liquidity tool, specifically engineered to facilitate large cross-border value transfers without slippage. He further explained that the market cap metric is more applicable to stocks and not to institutional bridge assets or liquidity tools like XRP. CharuSan believes that traditional financiers misunderstand this, dismissing an $8 to $10 trillion market cap as unrealistic. He clarified that market capitalization does not imply that all circulating coins will be cashed out at the current price; it is simply the unit price of the last transaction multiplied by the supply.

    CharuSan previously predicted that XRP would rally to $300 as banks adopt it for cross-border transactions. He explained that a high price is necessary to avoid bottlenecks and slippage during settlements. The analyst also cited the CLARITY Act as a potential catalyst for increased bank adoption of XRP.

    On-Chain Data Suggests XRP Could Be Undervalued

    On-chain analytics platform Santiment has also weighed in on XRP’s potential for a rebound. In an X post, they noted that the average XRP trader active in the past 30 days is down approximately 47%, with many selling at a loss. Santiment stated that the market value-to-realized value ratio (MVRV) historically averages out to 0%, making the current period an “extreme” zone for XRP.

    Santiment noted that XRP’s 30-day MVRV has reached its lowest level since December 2020, indicating that fear and frustration among traders have reached rare extremes. Historically, such conditions have preceded strong rebounds, suggesting a potential recovery for XRP. The platform added that this deeply negative MVRV zone creates conditions where even small positive catalysts could trigger significant price increases.

    As of the time of writing, the price of XRP is trading around $1.32, according to CoinMarketCap.

  • XRP’s MVRV Ratio Plunges to 2020 Low Amid Sell-Off

    XRP’s MVRV Ratio Plunges to 2020 Low Amid Sell-Off

    XRP Traders Face Significant Short-Term Losses

    XRP traders are currently experiencing substantial short-term losses, with on-chain analytics firm Santiment reporting that the token’s 30-day Market Value to Realized Value (MVRV) has plummeted to its lowest level since December 2020. Santiment characterized this as an “extreme undervalued zone,” noting that months of selling pressure have left recent buyers significantly underwater.

    The chart provided by Santiment, which tracks XRP Ledger’s price alongside its 30-day and 365-day MVRV ratios on Sanbase, indicates that XRP’s 30-day MVRV is approximately minus 47%. The 365-day reading is also deeply negative, hovering around minus 36%. Santiment’s analysis identifies the current situation as an “opportunity” zone, contrasting it with previous periods of elevated MVRV, which were labeled as sell-risk territory.

    Undervalued Zone Signals Potential Rebound

    Santiment stated that the data suggests the average XRP trader active over the past month has suffered significant losses, a level that has historically coincided with periods of intense capitulation. “The average XRP trader that has been active in the past 30 days is down a whopping -47% with many selling at the bottom,” Santiment wrote. “Historically, MVRV’s average trading returns will always average out to 0%, making this current time an extreme undervalued zone for XRP. The chart shows that XRP’s 30-day MVRV has now fallen to its lowest level since December, 2020, suggesting that fear and frustration among traders have reached rare extremes that have historically preceded strong rebounds.”

    MVRV, a metric used by on-chain analysts, helps estimate whether holders are experiencing unrealized profits or losses. Deeply negative short-term MVRV readings, according to Santiment, suggest that recent market participants have largely been washed out, reducing marginal selling pressure from traders who purchased near local highs.

    Market Dynamics and Broader Narratives

    XRP’s recent decline followed a strong rally in late 2024 and early 2025, according to Santiment. The firm noted that many traders entered the market near local peaks before momentum waned, leaving short-term holders vulnerable as subsequent selloffs drove the asset lower. This has resulted in a market structure where recent buyers are not only underwater but significantly so.

    Santiment also linked the current market setup to broader XRP narratives, which remain active despite the price retracement. The firm highlighted continued optimism among long-term investors regarding regulatory progress, ETF speculation, and Ripple’s adoption story, while acknowledging that the token has lost more than half its market value since the previous summer.

    “Despite the major price retracement that has seen XRP lose over half its market value since last summer, patient investors still have optimism surrounding regulatory progress, ETF speculation, and Ripple’s long-term adoption narrative,” Santiment said. “XRP rallied aggressively in late 2024 and early 2025, which left many traders buying near local tops before momentum cooled off. But since then, repeated selloffs have pushed many short-term holders deeply underwater.”

    The key question is whether the negative MVRV reading indicates market exhaustion or simply reflects the severity of the downtrend. Santiment did not present the metric as a standalone timing signal. However, the firm argued that historically depressed MVRV levels often appear when retail traders have largely capitulated, creating conditions where relatively modest positive news can have a significant impact.

    “The deeply negative MVRV zone that we’re seeing for XRP now tends to appear when retail traders have largely given up, creating conditions where even small positive catalysts can trigger strong recoveries,” Santiment wrote. “While weak MVRV readings alone do not guarantee a reversal, they often signal that the majority of panic selling has already occurred and downside risk becomes more limited compared to potential upside.”

    At the time of this report, XRP was trading at $1.33.

  • Bitwise ETF Becomes World’s Largest; Is Hyperliquid the Cycle’s Top Performer?

    Bitwise ETF Becomes World’s Largest; Is Hyperliquid the Cycle’s Top Performer?

    Bitwise HYPE ETF Sees Strong Debut

    Early volume data for Bitwise Asset Management’s physically-backed spot HYPE ETF suggest a robust launch. This raises the question of whether HYPE is emerging as a genuine cycle winner, or if the Bitwise ETF’s premium is already factored in.

    Bitwise’s BHYP debuted on the New York Stock Exchange with a 0.34% sponsor fee, temporarily waived to 0% on the first $500 million in assets under management (AUM) for the initial month. The firm manages approximately $11 billion in client assets. Within 48 hours of its launch, the two U.S.-listed HYPE ETFs experienced a 50% single-day volume surge on May 20 and recorded $25.5 million in net inflows, with $8.8 million attributed to BHYP alone. This early performance positions it as one of the largest altcoin ETF launches based on initial metrics.

    Bitwise’s HYPE Purchases

    Bitwise ETF clients purchased a total of $35.9 million in HYPE last week, representing an 18-fold increase from the previous week when Bitwise ETF flows began. BHYP launched on the New York Stock Exchange on May 15, 2026, and is the first HYPE ETF to be natively staked.

    Hyperliquid’s Derivatives Volume and Fee Revenue

    Meanwhile, Hyperliquid’s derivatives volume reached $2.9 trillion in 2025, reflecting over 400% year-on-year growth. The protocol also captured 44% of weekly blockchain fee revenue last week, generating $11 million compared to Ethereum’s $3 million.

    Hyperliquid accounts for 44.58% of all crypto fees this week, with 97% of those fees automatically allocated to buy and burn HYPE.

    HYPE’s Price Performance

    HYPE is experiencing a rally amidst the current market conditions, with major resistance levels being breached. Currently, HYPE is in a price discovery phase following a more than 50% increase in the past two weeks. It is currently outperforming the market significantly.

    If BHYP and the 21Shares product maintain eight-figure monthly net inflows, HYPE could surpass $70 decisively, with a target of $80. Moderate flows after the fee-waiver window closes could stabilize HYPE around the $60 range.

    For short-sellers, the best-case scenario involves ETF inflows reversing or stalling below $5 million weekly, which could push the price below $55 support and towards the $48 range, where structural buybacks provide a floor.

    The Assistance Fund

    The Assistance Fund mechanic is a key factor to consider. By March 2026, the Fund had accumulated 28.5 million HYPE through automated open-market purchases, spending over $1.3 billion cumulatively. This resulted in an annualized buyback rate of 7% of market cap, significantly higher than BNB’s equivalent rates.

    Bitcoin Hyper

    HYPE’s potential is real. The ETF wrapper expands access but also reduces the asymmetry available to early participants. Traders are increasingly seeking leverage earlier in the infrastructure stack.

    Bitcoin Hyper ($HYPER), currently in an active presale at $0.0136, positions itself at a different point on the risk curve. It is the first Bitcoin Layer 2 integrating the Solana Virtual Machine, offering sub-second finality and low-cost smart contract execution while settling on Bitcoin’s security layer.

    The project has raised over $32.7 million to date, with a decentralized canonical bridge enabling native BTC transfers. Staking is live with a high 36% APY for early participants. The core thesis is that Bitcoin holds $1.8 trillion in idle capital, and programmability unlocks it.

  • XRP Slides Toward $1.20 Support Amid Bearish Pressure

    XRP Slides Toward $1.20 Support Amid Bearish Pressure

    XRP Slides Toward Critical $1.20 Support as Bears Stay in Control

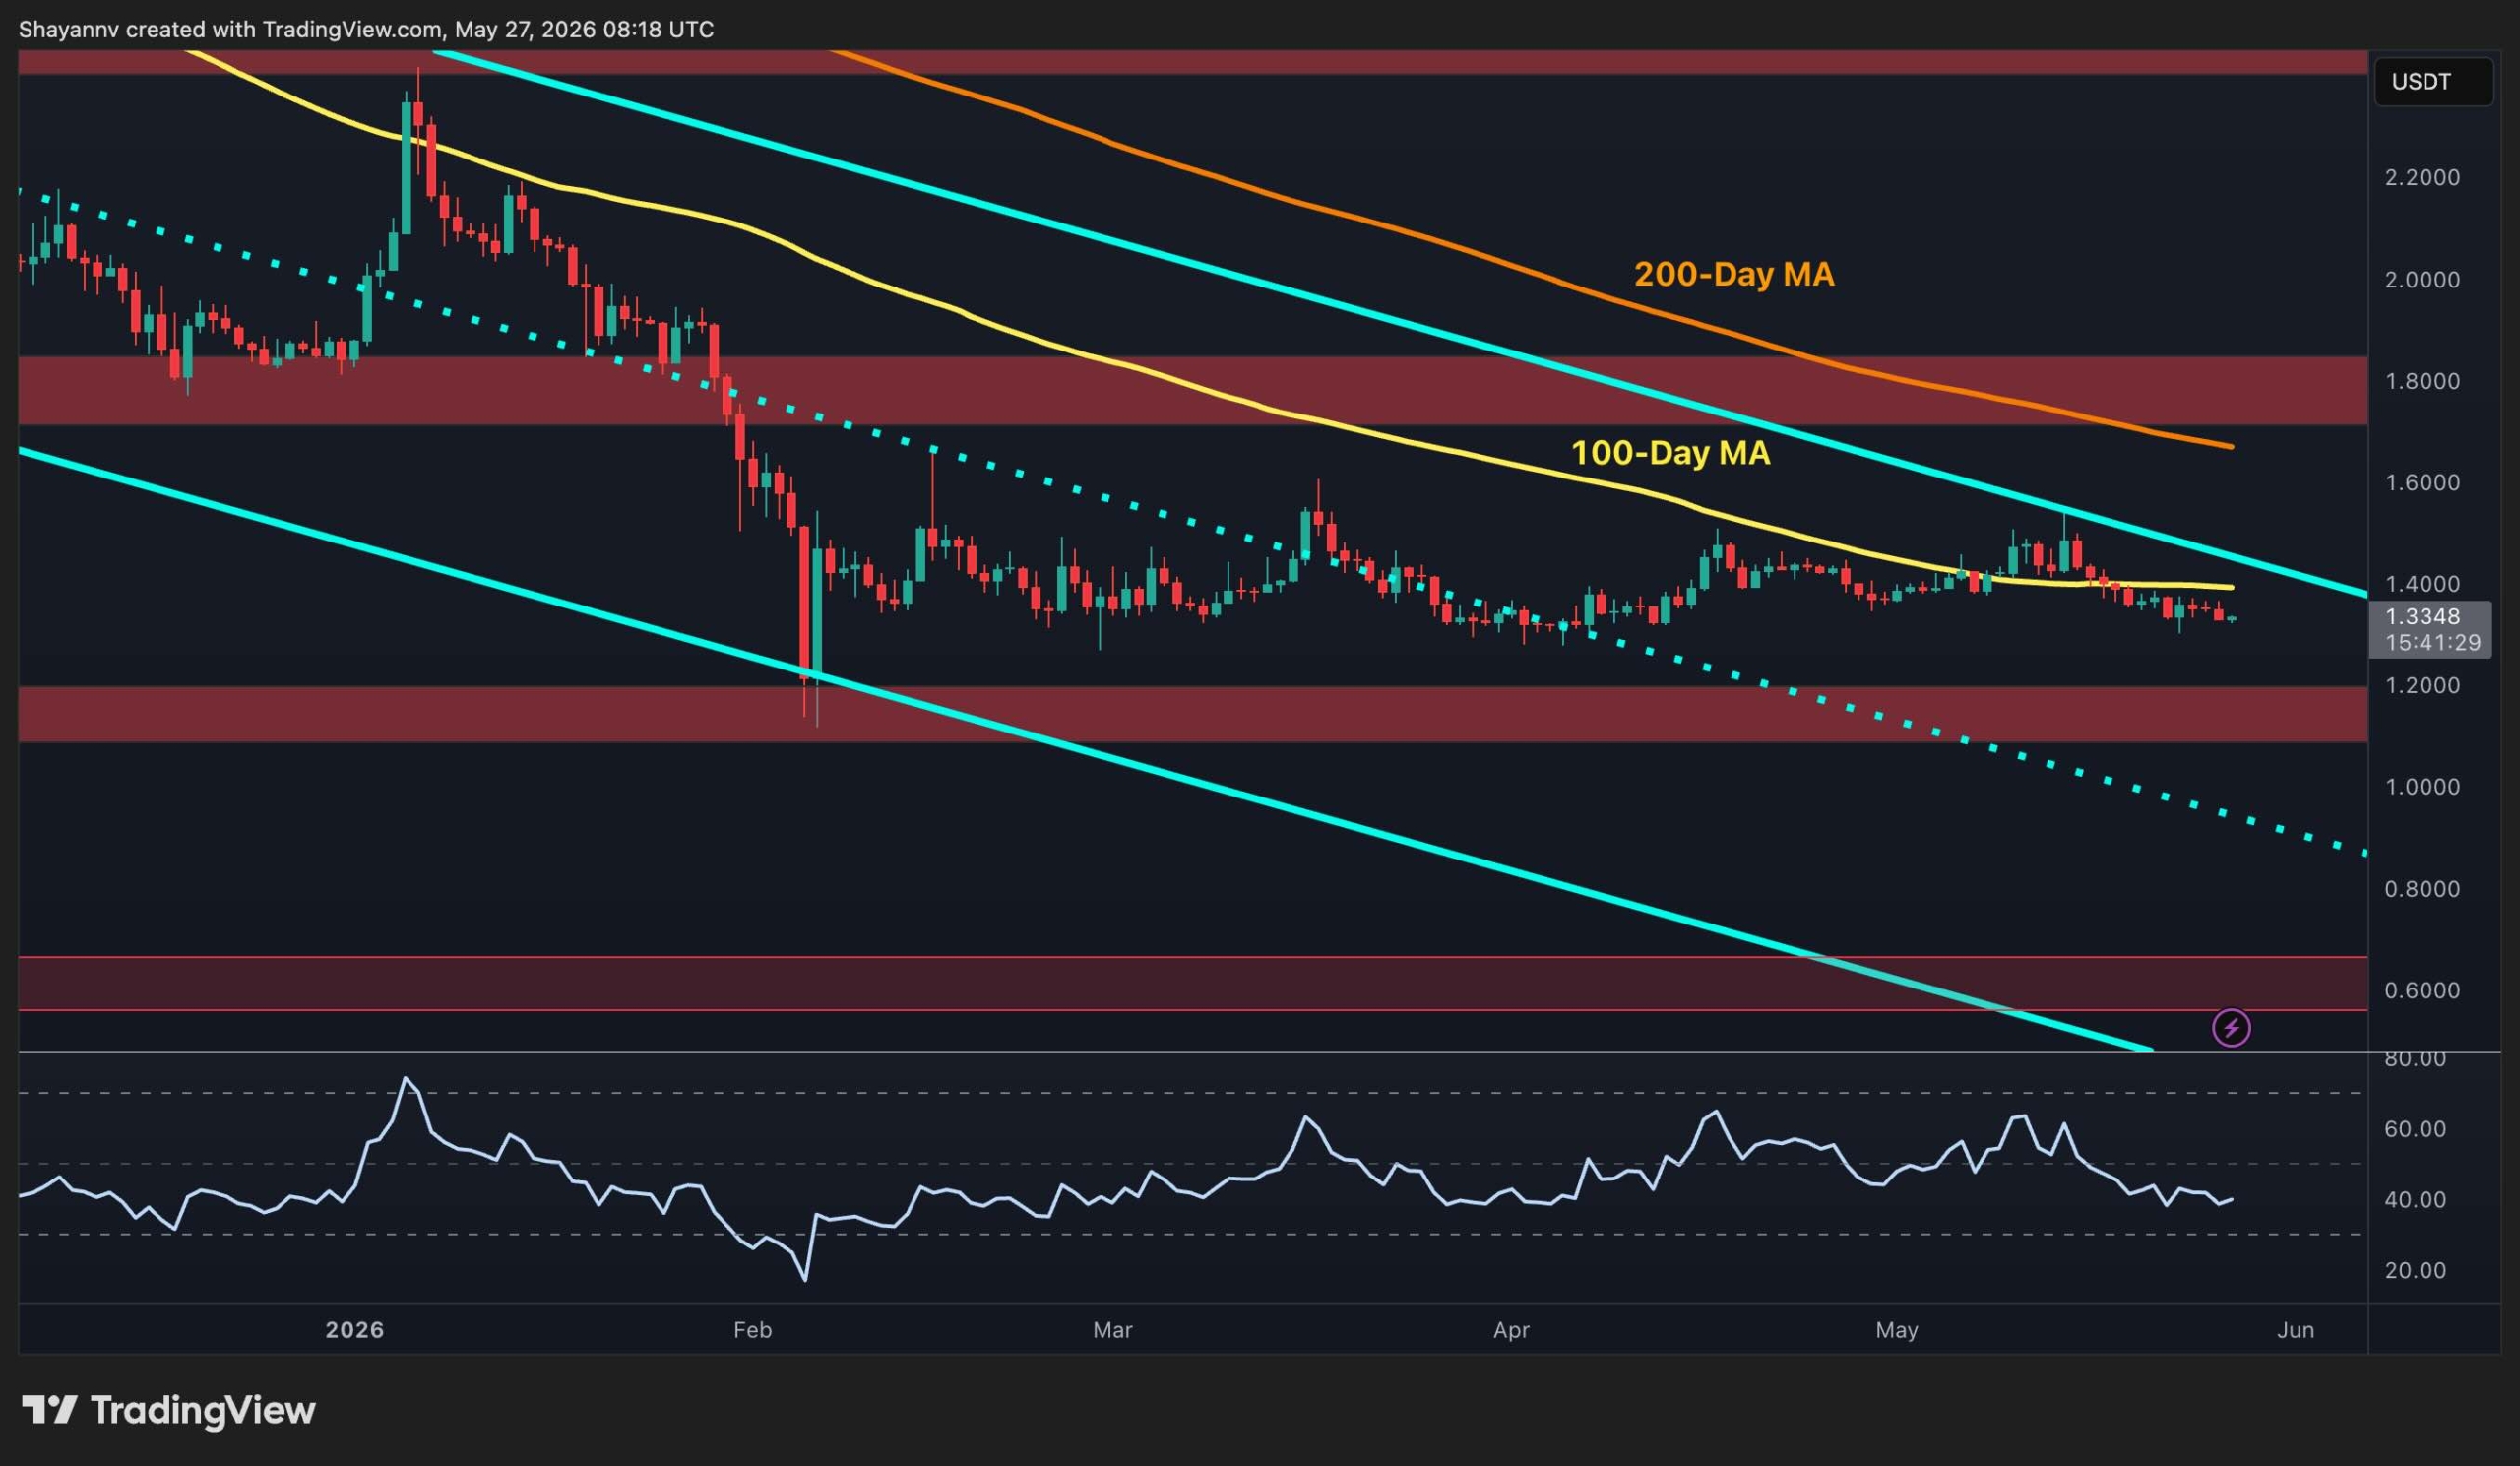
    XRP is trading at $1.33 as May concludes, steadily declining to its lowest levels since March without any specific trigger. This downward trend has characterized the altcoin’s performance throughout the latter half of the month.

    Key Support Levels Tested

    The $1.20 support level is the closest it has been in weeks, and the 100-day moving average has been breached again. The XRP/BTC pair is also testing its recent low, appearing increasingly vulnerable.

    Against USDT, the cryptocurrency is just below the upper boundary of a descending channel. The 100-day moving average, around $1.40, now acts as overhead resistance after being surpassed during May. The 200-day moving average continues to decline, currently around $1.60.

    The Relative Strength Index (RSI) is hovering around 40, indicating weak momentum with no signs of a bottom forming.

    Potential Breakdown Looms

    The $1.20 demand zone is now within reach, making the next few daily closes crucial. A potential breakdown below $1.20 would be the first breach of that level since February, potentially leading to a further decline towards the $0.60 zone. Conversely, any recovery attempt would need to reclaim $1.40 and the 100-day moving average to suggest a genuine recovery is underway.

    XRP/BTC Pair Analysis

    The XRP/BTC pair is trading at 1,760 sats and is testing the pink horizontal support level, which marks the recent low near 1,730 sats.

    The price has struggled to sustain a modest recovery above 1,800 sats. The RSI has been oscillating between 30 and 60 throughout May, without any sustained directional movement, reflecting a pair in a state of equilibrium rather than clear directional momentum.

    The 100-day moving average, around 1,900 sats, and the 200-day moving average, near 2,050 sats, remain the dynamic recovery targets on either side of the critical 2,000 supply zone.

    Below, the lower channel boundary and the demand area near 1,500 sats are the next potential targets if the recent low breaks down. XRP is expected to continue underperforming against BTC, as market sentiment remains largely pessimistic regarding Ripple.

  • XRP Price Poised for Sharp Rebound

    XRP Price Poised for Sharp Rebound

    XRP Price Analysis

    The price of XRP is currently trading at $1.33, experiencing a slight decrease today. However, technical analysis suggests an impending upward movement. The price has consolidated within a symmetrical triangle pattern on the 4-hour timeframe, and the next 48 to 72 hours could determine XRP’s price trajectory for the coming weeks.

    Over the past day, the trading volume reached $1.57 billion, while the market capitalization stands at $82 billion, trailing behind BNB. Some analysts have noted a two-week 20/50 EMA death cross, which is typically viewed as a bearish technical signal. Despite this, they also suggest that XRP could potentially rally towards the EMA cluster near $1.70.

    On the weekly chart, a similar death cross occurred in January 2026, coinciding with a lower high at $2.40. Subsequently, there was a countertrend rally towards the 20-week EMA at $1.50, followed by a rejection in May. This pattern aligns with the two-week death cross.

    The weekly chart also reveals an echo pattern, mirroring the death cross at the January lower high near $2.40, followed by a countertrend surge to the 20-week EMA at $1.50 before the May rejection.

    Market Sentiment and Technical Indicators

    Sentiment in the altcoin market remains mixed. However, the compressed volatility in XRP, coupled with a well-defined support level, suggests a potential for a significant price movement.

    The Relative Strength Index (RSI) is at 40, below its moving average of 44, indicating a lower-neutral position, not yet oversold. This suggests that buyers have not fully committed, but have not capitulated either. The Moving Average Convergence Divergence (MACD) remains below the signal line, with a slightly negative histogram, indicating weak bearish pressure, but not a significant decline.

    Key price levels are crucial, as XRP is currently trading below the 7, 14, and 30-day moving averages, which are acting as resistance. Immediate resistance is between $1.34 and $1.38. The major trigger band is between $1.40 and $1.45, defined by the 100-day moving average and the upper boundary of the descending channel.

    The coin is currently in a breakout zone. A decisive close above this zone could trigger a rapid price increase, while a rejection could push the price back towards the $1.30 to $1.20 range.

    The current XRP price action indicates an imminent decision point.

    Investment Strategy

    After a 42% annual decline, XRP presents a potential for a rebound. However, with an $82 billion market capitalization, even a 30% rally would require significant capital compared to assets with global recognition.

    Traders are increasingly shifting a portion of their large-cap exposure into early-stage infrastructure projects with structural utility before price discovery.

    LiquidChain ($LIQUID) is an L3 infrastructure project designed to address the fragmented liquidity across different blockchains. Its Unified Liquidity Layer integrates Bitcoin, Ethereum, and Solana liquidity into a single execution environment.

    LiquidChain features a deploy-once architecture with verifiable settlement and single-step cross-chain execution, providing a crucial middleware layer for DeFi.

    The presale has raised over $810,000, with a current token price of $0.01463. There is a 1400% APY bonus for buyers. LiquidChain allows developers to deploy once and access all three major ecosystems.

  • XRP Price: Expert Reveals Key to $200 Target

    XRP Price: Expert Reveals Key to $200 Target

    The Hurdles to XRP Reaching $200

    The prospect of XRP reaching $200 may seem ambitious, but according to market analysts, it hinges on a significant expansion of the cryptocurrency market, a feat the industry has yet to achieve. In a recent report, market expert Sam Daodu argues that the gap between XRP’s current trading price and the $200 target is substantial, requiring all key conditions to align simultaneously, rather than sequentially.

    The Need for a Larger Crypto Market

    Currently trading at $1.34, XRP is approximately 63% below its all-time high of $3.65, reached last year. The debate surrounding a $200 valuation remains unresolved. Daodu highlights the supply side as the initial challenge. With over 61.8 billion XRP tokens in circulation, a $200 target would equate to a total value of roughly $12.4 trillion. This figure is about five times the current total value of the entire crypto market, which stands at $2.6 trillion.

    Daodu’s analysis centers on this comparison. He believes a $12.4 trillion market capitalization for XRP is unattainable within the current crypto market size, necessitating a market-wide expansion exceeding any previous industry growth.

    Furthermore, Daodu asserts that Bitcoin (BTC) must lead this expansion. Historically, major XRP rallies have followed Bitcoin’s performance, suggesting that capital would likely flow into XRP only after Bitcoin demonstrates sustained strength.

    Institutional involvement is another crucial factor, according to Daodu. For XRP to attract the substantial inflows needed to support such a valuation, Bitcoin would need to be in a sustained breakout, with institutions already invested.

    Beyond a Price Target

    XRP’s historical performance provides context for the challenges ahead. The token spent approximately 18 months consolidating between 2015 and 2017 before its first major cycle. Later, following years of legal challenges from the U.S. Securities and Exchange Commission (SEC), the altcoin rallied from $0.50 to its July 2025 peak.

    Daodu emphasizes that significant XRP movements have historically been supported by a long base, a favorable regulatory environment, and a Bitcoin-led market. He suggests that these factors are unlikely to align quickly.

    The current cycle follows the same pattern, with XRP down 63% from its current price peak and largely trading within the $1.30 to $1.50 range throughout 2026. The token is still awaiting the regulatory catalyst of the CLARITY Act and remains more reliant on retail investment than institutional flows from exchange-traded fund (ETF) activity. Consequently, Daodu estimates the earliest timeframe for these factors to converge around 2030.

    Despite these constraints, Daodu does not dismiss the possibility of XRP reaching $200. He argues that the market is building something that extends beyond price, including payment rails, institutional partnerships, and a regulatory framework.

  • Chainlink Whales Reach Record Holdings

    Chainlink Whales Reach Record Holdings

    Chainlink Whale Wallets Reach All-Time High

    On-chain data indicates that the number of large Chainlink (LINK) wallets has reached a new all-time high, signaling increased interest from significant investors in the network.

    According to data from on-chain analytics firm Santiment, the number of Chainlink wallets holding at least 100,000 LINK has reached a record high. This metric, known as “Supply Distribution,” tracks the total number of addresses within a specific group based on their LINK holdings.

    These investor groups are categorized by the number of tokens held. For this analysis, the focus is on wallets holding a minimum of 100,000 LINK, which, at current exchange rates, equates to approximately $957,000. This threshold typically includes large-scale investors, often referred to as “whales,” whose activities can significantly influence the network.

    A chart shared by Santiment illustrates the change in Supply Distribution for these Chainlink investors over the past few months. The graph shows a rise in the number of wallets holding 100,000 LINK or more, indicating a growing presence of large investors on the network. Specifically, the Supply Distribution of LINK whales has increased by 8.2% over the last seven weeks.

    This influx of large investors has occurred while the cryptocurrency has generally traded sideways. Currently, there are 805 wallets holding at least 100,000 LINK, a new all-time high. Santiment noted that “Key stakeholders are showing bullishness toward the #16 market cap in crypto.”

    It remains to be seen whether this optimism among LINK whales will translate into price appreciation for the cryptocurrency.

    In contrast to the accumulation trend observed in Chainlink, Bitcoin has seen distribution from its large holders. Analyst Ali Martinez highlighted in a separate X post that the supply held by Bitcoin whales has recently declined. The chart indicates that Bitcoin whales sold 18,447 BTC between the 18th and 21st of this month, equivalent to approximately $1.41 billion.

    LINK Price

    At the time of writing, Chainlink is trading around $9.57, unchanged from one week ago.

  • Hayes Predicts Significant Gains for NEAR and Zcash.

    Hayes Predicts Significant Gains for NEAR and Zcash.

    Hayes on Privacy-Focused Crypto

    Arthur Hayes, Chief Investment Officer of Maelstrom, has identified NEAR Protocol and Zcash as the core of his privacy-focused cryptocurrency investments, arguing that the market is beginning to reprice assets tied to private value transfer, sovereignty in the age of AI, and sound protocol economics. In an interview with The Rollup, Hayes stated that NEAR could offer “20x potential,” while Zcash might have “5x potential” over the next year. He framed these assets as part of a broader reaction to the influence of “big tech, big government,” and AI-driven surveillance.

    Macroeconomic Shift Fuels Investment

    Hayes’ investment thesis is rooted in a macroeconomic shift. Earlier this year, he adopted a cautious stance, believing that Bitcoin had already priced in an “AI deflationary credit event.” He anticipated that monetary authorities would be hesitant to aggressively print money until a crisis forced their hand. However, he believes this changed after the Iran conflict, which crystallized a liquidity-positive environment for markets. “Governments print money to win war. AI is part of war. The AI capex will be underwritten, both in the United States and China, by the governments,” Hayes said. He added that governments in the US, China, and Europe would likely fund a wartime economy and AI infrastructure through monetary expansion, with some of that liquidity flowing into Bitcoin and select crypto assets.

    The Case for NEAR and Zcash

    Hayes’ strongest comments were reserved for privacy-focused cryptocurrencies. He reaffirmed Zcash as his “second biggest bag” and stated that the asset had become investable again after earlier concerns about its trusted setup, issuance profile, and developer subsidy faded. He views the current Zcash trade as cleaner, more liquid, and more relevant to the current political and technological climate. “There’s nothing wrong with wanting to have private money over the internet,” Hayes said. “And that’s what Zcash represents, that’s what Monero represents. And as we are learning the ability for big tech, big government and AI to essentially know everything about us and to trace everything that’s going on in our lives, to have pure, just cryptographically proven privacy with money is going to be super needed.”

    Hayes’ renewed interest in Zcash was spurred by a conversation with Naval Ravikant during Tokyo 2049. According to Hayes, Ravikant argued that Monero’s ring signatures were weaker than commonly assumed, referencing a Japanese law enforcement case involving deanonymization. Hayes subsequently purchased $1 million of Zcash and continued accumulating the asset as he researched the thesis further.

    NEAR’s Role in Private Value Transfer

    Hayes’ price targets are linked to NEAR’s role in facilitating private value transfer across assets and chains. He argues that while shielded Zcash is important, the greater opportunity lies in the ability of users to move from shielded ZEC into other assets, including stablecoins, through NEAR Intents. “Within the ZODL app, I can now send any crypto asset I want to anyone across the Internet in an anonymous way. From Shielded Zcash, using Near Intents. Now I’m into, you know, USDT on Tron and I’ve sent it to whoever I’m going to send it to in an anonymous fashion. That’s huge,” Hayes said.

    He believes Zcash remains the primary expression of the privacy trade, but NEAR may offer a more asymmetric setup due to its connection to the execution layer behind confidential transfers. “I think Near has a 20x potential where, you know, Zcash might have a 5x potential over the next year or something like that,” he said.

    NEAR’s Economic Fundamentals

    NEAR co-founder Illia Polosukhin reinforced the economic side of the argument, stating that NEAR Intents is approaching $20 billion in lifetime volume, with $18.9 billion cited during the interview, and has generated $33 million in fees. He explained that NEAR takes a fee from every transaction and uses it to buy back NEAR, while the ecosystem has already halved inflation and may push for further reductions as revenue grows.

    Hayes also highlighted NEAR’s token structure, noting that it benefits from being “fully diluted,” avoiding the large overhang of venture allocations that still affect many Layer-1 assets. He believes this clean supply profile is advantageous for a token expected to perform well in an upmarket.

    Risks and Outlook

    Hayes acknowledges that the primary risk to his thesis is macroeconomic. He intends to hold his positions until the broader liquidity backdrop changes, but he cautioned that reduced government support for AI capital expenditure or a worsening war scenario could alter the setup. For now, he sees privacy, AI-linked sovereignty, and exchange revenue as the trades with the clearest market validation.

    At the time of this report, Zcash was trading at $624.

  • XRP Faces Renewed Price Pressure, Potential Weekly Breakdown Looms

    XRP Faces Renewed Price Pressure, Potential Weekly Breakdown Looms

    XRP Price Faces Downward Correction

    The price of XRP has begun a downward correction, falling below the $1.350 mark. Currently exhibiting bearish signals, the cryptocurrency may decline further, potentially dropping below $1.3120.

    Technical Analysis

    XRP’s price initiated a downward correction after failing to sustain its position above $1.350. It is now trading below $1.340 and the 100-hourly Simple Moving Average. A bearish trend line is forming, with resistance at $1.3580 on the hourly chart for the XRP/USD pair, according to data from Kraken. The pair could continue its downward trajectory if it remains below $1.3550.

    Price Dips Below Support

    XRP struggled to maintain its position above $1.3650, triggering a fresh decline mirroring movements in Bitcoin and Ethereum. The price dipped below the $1.3550 and $1.3500 levels, subsequently falling below $1.340. This move included a clear break below the 61.8% Fibonacci retracement level, calculated from the upward movement between the $1.30 swing low and the $1.3740 high. A bearish trend line is also forming, with resistance at $1.3580 on the hourly chart for the XRP/USD pair. The price is currently trading below $1.340 and the 100-hourly Simple Moving Average.

    If the price attempts an upward move, it may encounter resistance near $1.3340. Initial major resistance is near $1.340, above which the price could rise to test $1.350. A decisive move above the $1.350 resistance could push the price towards the $1.3580 resistance and the trend line. Further gains might lead to a test of the $1.3650 resistance, with the next significant challenge for bulls potentially near $1.3740.

    Potential for Further Decline

    If XRP fails to surpass the $1.340 resistance zone, a fresh decline could be initiated. Initial support on the downside is near $1.3175. The next major support levels are near $1.3125 and the 83.2% Fibonacci retracement level, calculated from the upward movement between the $1.30 swing low and the $1.3740 high. A break and close below $1.3125 could lead to a continued decline towards $1.3020. Further support is expected near the $1.30 zone, with a potential for further losses towards $1.2920. Additional losses might lead to a test of $1.2880.

    Technical Indicators

    The Hourly MACD for XRP/USD is currently gaining momentum in the bearish zone. The Hourly RSI (Relative Strength Index) for XRP/USD is now below the 50 level.

    Major Support Levels: $1.3175 and $1.3125.

    Major Resistance Levels: $1.3400 and $1.3580.