Tag: Market Trends

  • Ethereum Consolidating Between Key Liquidation Levels, Signaling Potential Volatility

    Ethereum Consolidating Between Key Liquidation Levels, Signaling Potential Volatility

    Ethereum’s price is navigating a consolidation phase, positioned between significant liquidation concentrations on both the upside and downside. This suggests a decisive move could be triggered by a break from its current narrow range, though uncertainty remains regarding the immediate direction. Technical indicators offer mixed signals.

    ETH is trading slightly above $2.7K, having entered a consolidation period after a strong advance from the $1.85K–$1.92K support zone. Selling pressure is evident around the $2.68K–$2.77K resistance zone, preventing a sustained notable move above recent highs near $2.8K. Recent price action shows candles clustered near the lower boundary of this resistance zone, indicating that buyers have yet to fully absorb the overhead supply. However, the broader market structure is described as constructive.

    Technically, Ethereum continues to trade above a rising trendline, which has helped maintain progressively higher lows on the 4-hour chart. This trendline is currently being tested around the $2.65K–$2.66K mark. Moving averages show a bullish crossover (yellow average above orange around $2.1K), supporting the recovery outlook. The Relative Strength Index (RSI) has eased toward 60, suggesting that momentum has cooled but remains above neutral levels.

    The Binance ETH/USDT liquidation heatmap reveals substantial estimated liquidation concentrations on both sides of the current price. A prominent downside liquidation band is situated around $2.62K, with additional concentrations extending toward $2.55K–$2.6K. Above the current price, a strong cluster is visible around $2.75K–$2.78K, with a broader concentration extending toward $2.8K. This positioning places Ethereum between two meaningful liquidation pools.

    Potential Volatility Ahead

    The interplay of these technical levels and liquidation dynamics creates a scenario ripe for volatility. A loss of the 4-hour ascending support trendline could expose the $2.62K cluster, where long liquidations may amplify a potential decline. Conversely, reclaiming the nearby resistance zone could bring the overhead $2.75K–$2.8K liquidity into play, potentially accelerating an upward move through short liquidations.

    While a sustained notable move above the $2.77K resistance boundary and the recent $2.8K high could theoretically open the way toward the $2.9K–$3K resistance zone, continued rejection would bring the $2.35K–$2.51K demand zone into focus. The rising trendline provides additional technical confluence in this lower range. A decisive break below the ascending trendline would weaken the immediate bullish structure and expose the $2.6K support area, followed by the earlier swing low around $2.56K. If selling pressure extends further, the $2.44K–$2.48K demand zone would become the next important area for buyers to defend.

    Ultimately, the liquidation heatmap does not establish which side of the current consolidation Ethereum may break towards first. However, its alignment with the technical levels suggests that a break from this consolidation could trigger a sharper move as leveraged positions unwind. The uncertainty surrounding the immediate price action means that traders and investors should remain aware of the potential for significant, rapid price movements in either direction.

    Broader Context

    Source materials place the market analysis in this context: Ethereum’s rally has stalled beneath a key supply zone, with тхе ассет trading slightly above $2.7K as buyers attempt to preserve the recent bullish structure.

    Why This Matters

    Ethereum’s current price consolidation, situated between significant liquidation levels, presents a critical juncture. The potential for sharp price movements in either direction, amplified by the unwinding of leveraged positions, makes understanding these dynamics crucial for market participants. The outcome of this consolidation could significantly impact short-term price action, highlighting the immediate risks and opportunities present in the market.


  • Bitcoin Tops $85K, Ether Reclaims $2700 as PCE Data Fuels $250M Crypto Wipeout

    Bitcoin Tops $85K, Ether Reclaims $2700 as PCE Data Fuels $250M Crypto Wipeout

    Crypto Market Surges on Positive US Inflation Data, Bitcoin Tops $85,000

    The cryptocurrency market experienced a significant buying surge, fueled by positive Personal Consumption Expenditures (PCE) data from the United States. On the evening of September 30th, Taipei time, Bitcoin (BTC) decisively broke through the $85,000 mark, while Ethereum (ETH) reclaimed the $2,700 level. This sudden rally led to substantial liquidations for short-sellers, with total global liquidations reaching $255 million in the past 24 hours, according to CoinGlass data.

    Inflation Data Boosts Crypto Confidence

    Encouraging U.S. inflation figures provided a strong impetus for the cryptocurrency market. The latest PCE price index data, released recently, triggered a powerful wave of buying activity across the crypto space on the evening of September 30th, Taipei time.

    Bitcoin and Ethereum Lead the Charge

    Bitcoin (BTC), the largest cryptocurrency by market capitalization, demonstrated robust bullish momentum, surging past the $85,000 threshold. Simultaneously, Ethereum (ETH) also climbed back above the significant $2,700 level. As of this report, the overall market continues to trade with strong upward momentum.

    Short-Sellers Face Steep Losses

    The abrupt price surge caught contract market short-sellers off guard. Blockchain data platform CoinGlass reported that over the past 24 hours, a total of 72,901 traders worldwide faced liquidation, with total liquidations amounting to $255.40 million.

    The largest single liquidation occurred on the HTX exchange, involving the BTC-USDT trading pair. One investor suffered a loss of $6.91 million, making them the biggest casualty of this short squeeze.

    Market Performance and Outlook

    Bitcoin has seen a remarkable 40% surge this quarter, outperforming gold. Fidelity analysts suggest that a double-bottom breakout has been confirmed, pointing towards a potential target of $100,000.

    Bitcoin ETFs have attracted $2.8 billion in inflows within a week, even as some long-term holders take profits. The current market structure is considered healthier than previous peaks. JPMorgan noted that Bitcoin’s return to its production cost of $85,000 could alleviate selling pressure from miners.

  • US Spot Bitcoin ETFs See Nine-Day Inflow Streak, Attracting $3 Billion

    US Spot Bitcoin ETFs See Nine-Day Inflow Streak, Attracting $3 Billion

    US spot Bitcoin ETFs have recorded a nine-day streak of positive inflows, attracting approximately $3 billion in capital. This period, beginning September 17, marks a significant reversal from previous outflows and has shifted year-to-date net flows into positive territory.

    Inflow Surge Details
    The week ending September 25 saw substantial inflows, with approximately $2.4 billion entering the ETFs. The strongest single day during this period was September 21, which recorded nearly $999 million in inflows. This sustained buying activity has brought the total assets under management across US spot Bitcoin ETFs to nearly $108 billion by late September.

    Among the leading performers during this inflow streak were BlackRock’s iShares Bitcoin Trust (IBIT), Fidelity’s FBTC, and ARK 21Shares’ ARKB. For the week ending September 25, IBIT attracted approximately $1.2 billion, FBTC saw around $702 million, and ARKB garnered roughly $295 million. Together, these three ETFs accounted for over 90% of the capital inflows during that week.

    Context of Reversal
    This recent surge in inflows contrasts with earlier periods where the ETFs experienced significant capital outflows. At the midpoint of the year, the category was approximately $5.8 billion underwater. By the end of the reported streak, cumulative net flows for US spot Bitcoin ETFs had turned positive, reaching approximately $934 million. Since their launch in January 2024, these ETFs have accumulated over $57 billion in net inflows.

    Market and Investor Behavior
    During the nine-day inflow streak, the spot price of Bitcoin generally stabilized within the range of $83,000 to $87,000 USD. This price range is notably lower than Bitcoin’s peak near $126,000 in October 2025, a drawdown of approximately 34%.

    The performance of IBIT and FBTC simultaneously attracting capital suggests broad-based institutional demand, rather than a single large investor making a directional bet. The inclusion of ARKB indicates that growth-oriented investment strategies are also contributing to the inflows. This trend indicates a renewed institutional appetite for Bitcoin ETFs, with current price levels potentially viewed as an attractive entry point by value-conscious investors.

    Why This Matters

    The materials describe a narrow update: Following a period of capital outflows, US spot Bitcoin ETFs recorded nine consecutive days of inflows starting September 17, totaling approximately $3 billion. The exact end date of the nine-day winning streak beyond September 29 is not explicitly stated.

    Broader Context

    Source materials place the factual news in this context: Months of bleeding capital preceded the nine-day winning streak.

  • Bitcoin Eyes $215K as BTC Recovers Key Market Levels

    Bitcoin Eyes $215K as BTC Recovers Key Market Levels

    Bitcoin Bear Market Declared Over, With Upside Target of $215,000

    New analysis suggests the cryptocurrency’s downturn has concluded, projecting significant gains.

    A report released Wednesday by BIT Research asserts that Bitcoin’s bear market has ended, presenting an optimistic scenario for the current cycle that could see the price reach between $185,000 and $215,000. The leading cryptocurrency is currently trading above $83,000 and is poised to conclude its third consecutive month in positive territory, with quarterly gains reaching 42%.

    The firm claims to have accurately predicted the cycle’s low in late July. At that time, Bitcoin had met a downside target derived from Elliott Wave analysis and successfully held above the $62,900 level.

    Technical Indicators Signal Bullish Turn

    Key technical indicators have also pointed towards a bullish reversal. The weekly Relative Strength Index (RSI), a measure of price momentum, ceased its decline in June and July even as Bitcoin’s price hit new lows. The report draws a parallel between this divergence and the market bottom observed in 2022. Subsequently, Bitcoin surpassed its 21-week moving average at $69,272 and reclaimed the $70,000 mark. It is now trading around $83,000, exceeding its March 2024 high of $73,084.

    Cost Basis and Macro Factors Support Rally

    BIT’s analysis also leaned on cost basis data. The “True Market Mean,” which estimates the average price at which holders acquired their Bitcoin, stands at $76,897. This indicates that both typical long-term holders and recent spot ETF buyers are now in profit, a development the analysts believe removes a significant source of selling pressure.

    Furthermore, the report considers the escalating US federal debt, which has now surpassed $40 trillion. Rising Treasury yields, driven by concerns over government finances, could potentially drive capital towards both gold and Bitcoin as safe-haven assets.

    Debt Model and Potential Headwinds

    BIT’s debt model provides a reference valuation for Bitcoin near $105,000. However, the primary headwind identified is a strengthening US dollar, coupled with market expectations of further Federal Reserve interest rate hikes and ongoing geopolitical tensions in the Strait of Hormuz. Despite these challenges, the firm does not anticipate them derailing the current rally, noting that historical dollar strength has impacted gold more severely than Bitcoin.

    Recent Performance and ETF Inflows

    The original cryptocurrency has been trading within the $83,000 to $85,000 range since facing resistance near $87,000 last week. As of this writing, Bitcoin was trading just above $83,000, representing a dip of over 4% in the past seven days. Nevertheless, this price point signifies a nearly 10% increase over two weeks and a more than 7% rise compared to 30 days ago. Data from Coinglass shows the third quarter closing with gains of 42.22%, marking the best quarterly performance since Q4 2024 and the strongest Q3 since 2017.

    ETF flows have also shown improvement. Spot Bitcoin ETFs recorded net inflows of $2.8 billion in September alone, bringing cumulative inflows to $57.6 billion and total net assets under management to approximately $108 billion.

    Future Projections and Market Dynamics

    In previous cycles, Bitcoin has historically climbed at least 85% above the average holder’s cost basis, which is currently estimated at around $142,000. BIT’s analysts clarified that this level serves as a reference point for tracking a bull market rather than a minimum target or a definitive peak. While prices have historically continued to rise after crossing this threshold, they cautioned that past performance is not indicative of future results.

    During the last cycle, Bitcoin reached the 85% mark near $73,000 in March 2024 and subsequently peaked at $126,000, approximately 1.7 times higher. If this multiple were to shrink to between 1.3 and 1.5 times on the current $142,000 base, it would translate to a price range of $185,000 to $215,000.

    The timing of such a surge remains uncertain. The previous cycle took roughly 19 months to advance from the 85% level to its peak. Applying a similar pattern could place Bitcoin at $200,000 around 2028 or 2029, though the analysts emphasized the speculative nature of such pattern matching and the inherent uncertainty in timing. They also noted that the asset currently appears “stretched” after a rapid ascent, suggesting that a period of consolidation or a more significant pullback remains a possibility in the near term.

  • GhostSwap 2026: Private Crypto Swaps

    GhostSwap 2026: Private Crypto Swaps

    GhostSwap, a cryptocurrency swap platform, is built on three foundational principles: speed, user control, and privacy. Unlike conventional centralized exchanges that require account creation, identity verification, and depositing funds into exchange-controlled wallets, GhostSwap operates as a non-custodial service. This allows users to exchange various cryptocurrencies without the need for an account or Know Your Customer (KYC) procedures for standard transactions, while maintaining full control of their assets throughout the process.

    The platform positions itself as a streamlined method for exchanging digital assets across different networks, bypassing the typical setup of a full trading account. According to its official website, GhostSwap currently supports over 1,600 cryptocurrencies, including major ones like Bitcoin, Ethereum, and Solana. It also reports a user base exceeding 1.5 million worldwide, with over 2 million transactions completed and a swap volume of $750 million. GhostSwap is designed for users seeking a straightforward way to move between cryptocurrencies without holding balances on centralized exchanges.

    How GhostSwap Works

    GhostSwap simplifies the crypto exchange process into a few straightforward steps. Users first select the cryptocurrency they wish to send and the asset they want to receive. They then enter the desired exchange amount, review the quoted rate, and provide a receiving wallet address. The final step involves sending their cryptocurrency to complete the transaction, after which the converted assets are delivered to the provided wallet.

    For example, to exchange BTC for USDT, a user would select BTC as the outgoing asset and USDT as the incoming asset. They would then specify the amount, enter their USDT wallet address, review the swap details, and send BTC to the deposit address provided for that specific transaction.

    Custody and User Responsibility

    The primary distinction between GhostSwap’s model and a centralized exchange lies in custody. On traditional platforms, users deposit funds into an exchange-controlled wallet, where assets may remain for extended periods. GhostSwap asserts that it does not hold customer funds in this manner, functioning instead as a non-custodial platform where assets pass through the swap process and are ultimately delivered to a user-controlled wallet.

    This approach enhances privacy and seamlessness but places greater responsibility on the user. Without a conventional exchange account holding the resulting funds, the accuracy of the receiving address and the selected blockchain network is critical before initiating a transaction. Incorrectly entered addresses mean transactions cannot be reversed.

    Speed of Transactions

    Speed is a key component of GhostSwap’s value proposition. Most swaps are completed within five minutes, though this can vary significantly based on network load, the chosen network, congestion, and processing routes. In practice, GhostSwap’s workflow is typical of a crypto swap service prioritizing speed, privacy, and convenience.

    Privacy and KYC

    GhostSwap’s account-free model minimizes the personal information required from users. The platform emphasizes privacy as a core philosophy, aiming to collect minimal personal data while empowering users to maintain control over their funds.

    However, the absence of routine KYC has important qualifications. All swaps are automatically screened by processing partners. If a deposit is flagged during this process, GhostSwap may request identity verification from the user. This means KYC is not a standard requirement for typical swaps but is not entirely eliminated. This responsible approach to handling personal information is a notable aspect.

    For privacy-conscious users, GhostSwap eliminates the friction of registration and identity verification common to centralized exchanges. Users can initiate swaps without creating profiles or submitting identification upfront. Simultaneously, the screening policy ensures a compliance layer operates behind the scenes, and users should be aware that certain transactions may necessitate additional checks.

    Asset Coverage

    A significant selling point of GhostSwap is its extensive support for over 1,600 cryptocurrencies across major blockchain networks, offering substantial flexibility compared to services focused on a limited selection of major coins. This broad coverage allows users to exchange less common coins directly for others, avoiding the need to transfer them to a large centralized exchange and execute multiple trades.

    It is important to note that the availability of specific trading pairs depends on the network and available liquidity. Users are advised to check the live exchange interface to confirm direct swap possibilities and current rates.

    Cross-Network Swaps

    GhostSwap supports swaps involving assets on entirely different networks. For instance, Bitcoin and Ethereum operate on separate native networks, as do Solana, Monero, and XRP. GhostSwap abstracts this complexity, allowing users to simply select the asset they are sending and the asset they wish to receive.

    Privacy Coins and Anonymity

    GhostSwap supports privacy coins, such as Zcash (ZEC) and Monero (XMR), which are often a subject of debate within the crypto community. This feature is particularly relevant for users seeking access to assets not readily available on mainstream exchanges, especially after several centralized exchanges delisted Monero.

    However, support for privacy coins should not be mistaken for a guarantee of complete anonymity. As previously mentioned, GhostSwap screens transactions, and flagged deposits may be subject to identity verification.

    Liquidity Aggregation

    GhostSwap aggregates liquidity from multiple providers rather than relying on a single market source. This allows the system to search for available rates before routing transactions and executing at the best possible price. This aggregation enhances liquidity and expands the number of available swap routes, which is crucial when dealing with less common cryptocurrencies.

    Rates and Fees

    GhostSwap does not have a central order book, meaning there are no typical maker and taker fees. Instead, platform fees are integrated into the slippage, which varies based on available liquidity and the assets being swapped.

    Conclusion

    GhostSwap offers convenience, privacy, and broad cryptocurrency support, appealing primarily to users seeking a simple, account-free method for exchanging digital assets. It is well-suited for individuals who manage their crypto on-chain and prefer to avoid centralized intermediaries. The platform is particularly attractive to privacy-conscious users who wish to bypass account creation and routine KYC.

    However, for users requiring advanced trading instruments like stop losses, limit orders, or trailing stops, other platforms may offer more suitable options.

  • Kalshi Valued at $40 Billion After Four Months, Sequoia Leads Round

    Kalshi Valued at $40 Billion After Four Months, Sequoia Leads Round

    Kalshi Reportedly Seeking $1 Billion in New Funding at $40 Billion Valuation

    Funding Round Signals Rapid Growth for Prediction Market Platform

    Prediction market platform Kalshi is reportedly in advanced talks to raise approximately $1 billion in new funding, a deal that would value the company at a staggering $40 billion. This latest fundraising effort comes just four months after Kalshi secured $1 billion in Series F funding in May at a $22 billion valuation, effectively doubling its worth in a remarkably short period. Existing investors Sequoia Capital and Wellington Management are said to be leading the round, with Tiger Global and Dragoneer also participating.

    Valuation Surge Raises Eyebrows

    The speed at which Kalshi’s valuation has escalated is notable. The company’s valuation reportedly stood at $11 billion in December of the previous year, jumped to $22 billion in May, and is now rumored to be targeting $40 billion. This rapid ascent has been a subject of discussion in the market, with reports of Kalshi seeking a $40 billion valuation emerging as early as June. At that time, The Financial Times reported that the company was in fundraising negotiations with that target valuation, aiming to close the round in the third quarter. Reuters’ latest report suggests these talks are now in an advanced stage.

    Prediction Markets Gain Traction

    The prediction market sector has seen a significant redefinition over the past year. Platforms like Polymarket and Kalshi have experienced rapid growth in trading volume and user activity, drawing attention from traditional finance circles. These platforms are increasingly viewed not just as gambling venues but as novel tools for price discovery. The integration of artificial intelligence, particularly following the White House’s release of an AI self-regulation framework in early 2026, has further expanded the potential for prediction markets, serving as a crucial data layer for AI agents.

    Private Markets as a Haven for Growth Companies

    Amidst a subdued IPO market in 2026, with some crypto-related companies reportedly pausing their U.S. IPO plans, the private market has become a vital refuge for growth-stage technology companies seeking capital. The involvement of funds like Tiger Global and Dragoneer, known for their pre-IPO tech investments, signals confidence in Kalshi’s business model scalability.

    Regulatory Hurdles Loom Large

    Despite the impressive valuation, Kalshi continues to face significant regulatory challenges. This year has seen conflicting rulings from various circuit courts regarding the nature of Kalshi’s contracts. While the Sixth Circuit Court of Appeals ruled that sports-related contracts do not fall under the Commodity Futures Trading Commission’s (CFTC) jurisdiction as swaps and should be regulated by individual states, other circuits, including the Third, Eighth, and Ninth, have reached different conclusions. This “circuit split” makes a Supreme Court battle between Kalshi and the CFTC increasingly likely.

    A High-Stakes Gamble for Investors

    For investors, this legal uncertainty presents both risk and opportunity. A favorable Supreme Court ruling that supports Kalshi’s federal jurisdiction model could solidify the legal standing of prediction markets, potentially validating the $40 billion valuation as just the beginning. Conversely, an unfavorable outcome could lead to contract suspensions and necessitate a significant business restructuring, with potentially catastrophic consequences. The current capital market activity suggests investors are betting on the former scenario.

    Potential for a Landmark Deal

    The Reuters report has not yet received official comment from Kalshi or any of the involved investment firms. If this funding round closes in the fourth quarter, it would represent one of the largest and highest-valued private placements in the cryptocurrency-related sector for 2026. Further developments, particularly concerning the potential Supreme Court intervention and its impact on the broader prediction market industry’s regulatory landscape, will be closely monitored.

    Defining the Future of Prediction Markets

    Prediction markets have transitioned from a niche sector to a mainstream capital focus in 2026. Kalshi’s ability to sustain its $40 billion valuation will depend not only on user growth but also on its success in the courtroom, where it will fight for the definition of what constitutes a futures contract versus gambling.

  • Robinhood to Launch Weekend Equity Trading

    Robinhood to Launch Weekend Equity Trading

    Robinhood Disrupts Wall Street by Planning Weekend Stock Trading

    Robinhood has signaled a significant shift for Wall Street, announcing plans to offer equities trading on weekends for a select group of U.S. stocks and ETFs. This move, unveiled at the company’s HOOD Summit in Houston, marks a first for modern American brokerages.

    Weekend Trading Infrastructure

    Orders placed during the weekend will be processed through Bruce ATS, an alternative trading system operated by Bruce Markets. Robinhood and PEAK6 Investments hold majority ownership of Bruce Markets, granting the brokerage direct control over the infrastructure supporting these new trading sessions.

    Phased Rollout and Regulatory Hurdles

    The initial offering will feature a curated selection of stocks and ETFs, rather than the entire spectrum of listed securities. While a specific launch date has not yet been set, the feature requires regulatory approval and could be introduced soon or in early next year, according to Robinhood.

    Expanding Beyond Traditional Hours

    This initiative builds upon Robinhood’s previous expansion of trading hours. In 2023, the company launched its 24 Hour Market, which currently operates from Sunday 8 p.m. ET to Friday 8 p.m. ET. The proposed weekend trading would effectively bridge the remaining gap, creating a near seven-day market for participating securities.

    Evidence of Demand

    The demand for extended trading hours is already apparent. On active trading days, approximately 25% of the daily volume on Robinhood’s 24 Hour Market originates from outside conventional market hours.

    Broader Strategic Announcements

    Weekend equities trading was not the sole announcement at the HOOD Summit. Robinhood also revealed plans for AI-powered trading agents, earnings contracts through a new partnership with Cboe, and perpetual futures for select cryptocurrencies, following its acquisition of the Bitstamp exchange.

    Steve Quirk, an executive at Robinhood, articulated the underlying rationale: “Breaking news doesn’t wait for an opening bell.”

    Potential Risks and Mitigation Strategies

    However, potential risks are associated with this development. Thinner weekend liquidity could lead to wider bid-ask spreads and increased price volatility for individual trades. Alternative trading systems typically lack the order flow depth found on primary exchanges during regular trading hours. Traders not employing limit orders could face unexpected costs when trading on a Sunday.

    Robinhood’s strategy of initially limiting the offering to a curated list of tickers is likely intended to manage these risks, focusing on highly liquid securities where spreads are less prone to significant widening.

  • Bitcoin Bear Market: Shortest and Shallowest Since 2013? Analysis Amidst Rebound and Uncertainty

    Bitcoin Bear Market: Shortest and Shallowest Since 2013? Analysis Amidst Rebound and Uncertainty

    Bitcoin’s current bear market may be the shortest and shallowest since 2013, potentially lasting 267 days with a 52% drop if it concluded at the June low, according to reporting by River. This analysis comes as Bitcoin has rebounded nearly 50% from its June low, including over 10% gains in the past week.

    However, the definitive end of the bear market remains uncertain. Some market participants, including users on Reddit, suggest that a shallow bear market could signal underlying weakness in the subsequent bull market. They also note that Bitcoin has not yet achieved a positive year-to-date performance, requiring a price above $88,000 by year-end to turn positive.

    Supply-Side Dynamics Drive Rebound

    River’s analysis indicates that the recent price increase is primarily driven by supply-side factors rather than a surge in demand. Exchange trading volumes are reportedly 30% lower than at the start of the year, and Bitcoin ETFs purchased approximately 18,000 BTC in September. Furthermore, a significant portion of Bitcoin holdings, 81%, has remained unmoved for at least six months. Long-term holders have increased their positions by over 3 million BTC since 2020, and an estimated 4 million BTC dormant for over three years were moved between 2024 and 2025, with about 300,000 BTC still to be moved in the first half of 2026. This scarcity of available supply is seen as a key factor in the current price appreciation.

    Demand Lags, Macro Factors Loom

    Despite these supply-side indicators, River acknowledges that demand has not yet returned, leaving room for significant price volatility. Adding to the uncertainty, the Federal Reserve recently raised interest rates by a quarter point to a target range of 3.75%-4.00%, with indications of at least one more hike. The failure of the CLARITY Act to pass the Senate on September 15th, falling short of the 60-vote threshold, also occurred within this period.

    Historical Comparisons and Divergent Views

    Discussions among market observers highlight differing interpretations of the current cycle. Some users calculate that the return from one cycle low to the next is only about 3.7 times for this cycle, significantly lower than previous cycles which saw returns of 5, 18, and 83 times. This contrasts with the view that every bear market is the shallowest and that market cycles are not perfectly replicable. Projections suggest a potential peak price for Bitcoin at $124,700 by October 6, 2025, and a low of $58,566 on June 30, 2026, representing a 53% drop from the peak.

    Ultimately, while Bitcoin’s recent rebound and supply-side dynamics present a case for a potential end to the bear market, the absence of robust demand and ongoing macroeconomic factors contribute to a landscape of considerable uncertainty. The market’s trajectory will likely depend on the return of demand and the broader economic environment.

    Why This Matters

    The materials describe a narrow update: Bitcoin’s bear market, if it concluded at the June low, would have lasted 267 days and fallen 52%. Whether the current Bitcoin bear market has truly ended.

    Broader Context

    Source materials place the factual news in this context: Previous bear market durations and depths are referenced for comparison.

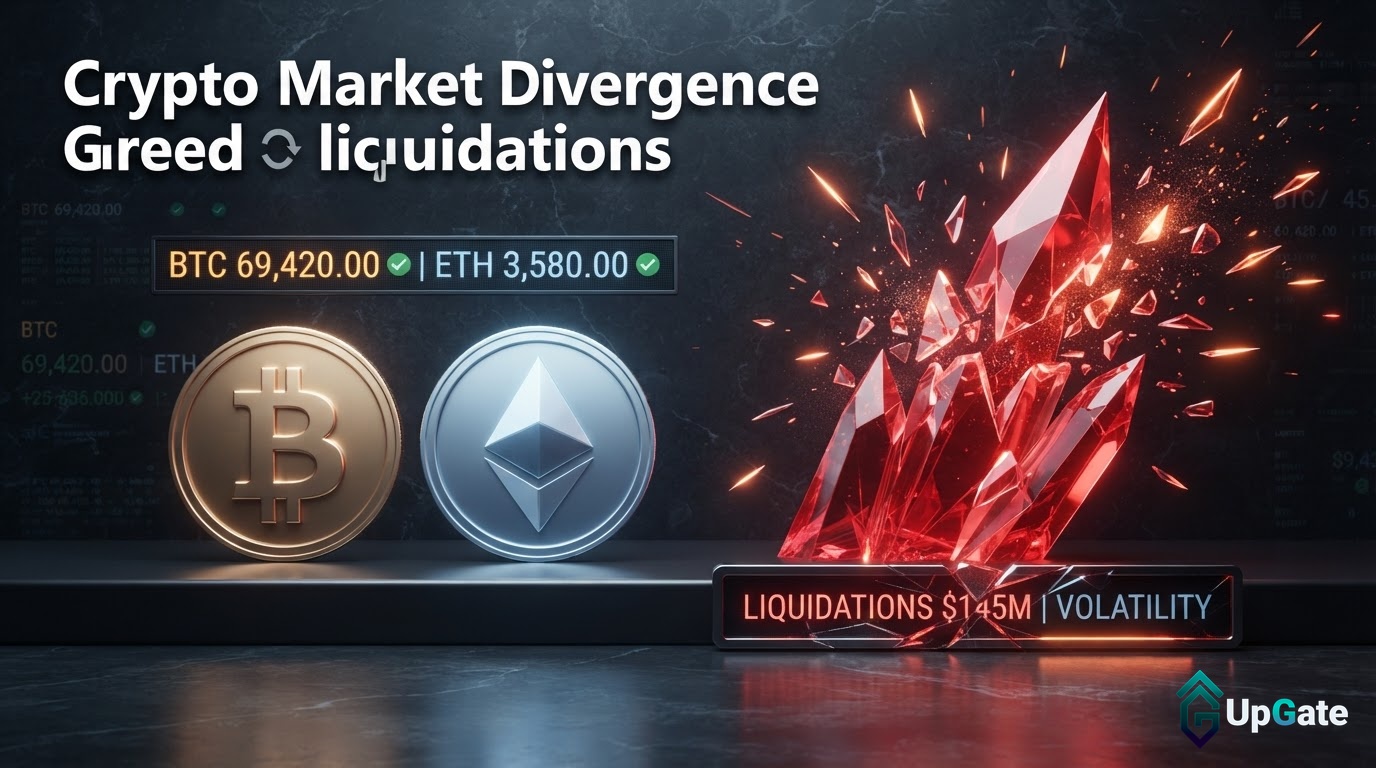
  • Crypto Market Shows Divergence: Stable Bitcoin and Ethereum Prices Amidst Liquidations and ‘Greed’ Sentiment

    Crypto Market Shows Divergence: Stable Bitcoin and Ethereum Prices Amidst Liquidations and ‘Greed’ Sentiment

    The cryptocurrency market is currently presenting a complex picture, with major assets like Bitcoin and Ethereum maintaining stable prices while the broader market experiences substantial liquidations. Investor sentiment, as measured by the Crypto Fear and Greed Index, remains in the ‘greed’ zone, even as traditional financial markets face downturns.

    On September 30, Bitcoin was trading above $83,000, marking a slight 24-hour gain of 0.33%. Ethereum hovered near $2,670, experiencing a minor dip of less than 0.2%. Despite these relatively stable price points for the two largest cryptocurrencies, the overall crypto market saw over $272 million in liquidations within the past 24 hours. Data from Binance, CoinGecko, alternative.me and CoinGlass indicates that long positions accounted for over 60% of these liquidations, totaling approximately $175 million, while short positions saw $97 million liquidated.

    This period of significant liquidations occurred against a backdrop of broader economic shifts. On Monday, September 29, major US stock indices including the Dow Jones Industrial Average, S&P 500, and Nasdaq Composite closed lower. Concurrently, bond yields rose, with the 30-year US Treasury yield reaching a multi-year high of 5.59%. These movements in traditional markets typically signal a move away from riskier assets.

    However, the cryptocurrency market’s sentiment appears to be diverging from these traditional market trends. The Crypto Fear and Greed Index, according to Alternative.me, stood at 71 on September 30, firmly within the ‘greed’ territory. This indicates that investors are feeling optimistic, a sentiment that has persisted over the last eight days with the index ranging between 70 and 74. This persistent greed, even with market downturns elsewhere, suggests that the overall investment sentiment has not turned significantly pessimistic.

    Technical indicators for Bitcoin show its price above its 20-day (80,974 USD), 50-day (76,895 USD), and 200-day (71,238 USD) simple moving averages. Bitcoin’s Relative Strength Index (RSI 14) is at 61.3, indicating a strong region. The MACD for Bitcoin shows a bearish alignment, but its histogram is narrowing, suggesting weakening downward momentum. For Ethereum, the price is also above its 20-day (2,599 USD), 50-day (2,420 USD), and 200-day (2,108 USD) simple moving averages, with its RSI 14 at 61.7. However, Ethereum’s MACD shows a bearish alignment with a widening histogram, indicating strengthening downward momentum.

    The largest single liquidation event reported occurred on HTX for the ETH-USDT pair, amounting to $5.06 million. Other cryptocurrencies also saw price movements, with SOL trading at $118.84, up 0.67% in 24 hours, and XRP at $1.4914, up 0.24% in the same period.

    Uncertainties remain regarding the specific triggers for the substantial long position liquidations despite stable major asset prices. Additionally, the future direction of Bitcoin and Ethereum prices is subject to interpretation given the mixed signals from technical indicators. The market continues to digest expectations that the Federal Reserve may maintain high interest rates for an extended period, a factor that could influence risk asset flows.

    Why This Matters

    The cryptocurrency market’s current dynamics, characterized by stable major asset prices, significant liquidations, and optimistic sentiment amidst broader economic headwinds, present a complex scenario for investors. Understanding these divergent signals is crucial for navigating the current economic landscape.

    Broader Context

    Source materials place the factual news in this context: Bitcoin’s price is above its SMA20 (80,974), SMA50 (76,895), and SMA200 (71,238), with moving averages in a bullish alignment. MACD for Bitcoin shows a bearish alignment, but the histogram is narrowing, indicating weakening downward momentum. Ethereum’s price is above its SMA20 (2,599), SMA50 (2,420), and SMA200 (2,108). MACD for Ethereum shows a bearish alignment and the histogram is widening, indicating strengthening downward momentum.

  • Robinhood Expands Perpetual Futures Trading to Traditional Assets in Europe

    Robinhood Expands Perpetual Futures Trading to Traditional Assets in Europe

    Robinhood announced on July 1 that it is expanding its perpetual futures trading offerings in Europe to include traditional assets such as commodities, exchange-traded funds (ETFs), and foreign exchange (FX) pairs. This move marks a significant diversification beyond the cryptocurrency-only perpetual futures that the platform previously offered in the region.

    Eligible European customers can now trade perpetual futures contracts linked to assets including gold, crude oil, popular ETFs like QQQ and EWY, and FX pairs such as EUR/USD. These new offerings come with up to 10x leverage and are available for trading 24 hours a day, seven days a week. Perpetual futures are financial contracts that allow traders to speculate on an asset’s price without owning the underlying asset, and they do not have an expiration date. Their price is typically kept aligned with the spot price through a mechanism known as funding rates.

    This expansion into traditional assets represents a notable step for Robinhood, moving beyond its initial focus on crypto perpetual futures. According to the FactSheet, when Robinhood first introduced perpetual futures for Bitcoin and Ethereum in Europe, the product line eventually expanded to include other cryptocurrencies like XRP, DOGE, SOL, and SUI, offering up to 7x leverage. These crypto perpetual futures quickly became one of the fastest-growing products on the platform following their European rollout.

    The expansion of perpetual futures to traditional assets is part of a broader international strategy for Robinhood. The company is actively pursuing other international market opportunities, including seeking crypto trading capabilities in the United Kingdom. Additionally, Robinhood has acquired WonderFi to establish a presence in the Canadian market and is pursuing a capital markets service license in Singapore.

    Beyond product and market expansion, Robinhood is also developing its own blockchain infrastructure. The company is working on Robinhood Chain, a Layer-2 blockchain designed for tokenized assets, with a public mainnet launch planned. Furthermore, users of the Robinhood Wallet in eligible regions can access decentralized perpetual futures through the Lighter exchange, which includes incentive structures tied to the $LIT token.

    This strategic diversification and international push indicate Robinhood’s ambition to broaden its appeal and service offerings to a wider range of investors and markets globally.

    Why This Matters

    The materials describe a narrow update: Robinhood has launched perpetual futures trading for traditional assets such as commodities, ETFs, and foreign exchange pairs in Europe. The expansion into traditional assets represents a meaningful leap beyond Robinhood’s previous crypto-only perpetual futures.

    Broader Context

    Source materials place the factual news in this context: Robinhood announced on July 1 that it’s expanding its perpetual futures offerings in Europe to include traditional assets like commodities, ETFs, and foreign exchange pairs, a meaningful leap beyond the crypto-only perps it launched earlier.