Tag: Market Trends

  • Bitcoin Breaks $85K Sell Wall, Eyes Further Gains

    Bitcoin Breaks $85K Sell Wall, Eyes Further Gains

    Bitcoin’s formidable $85,000 resistance level may have just weakened. A significant sell wall, a large concentration of sell orders at a specific price, has reportedly been dismantled by buyers, according to a post on X. This development could pave the way for further price appreciation by reducing the overhead supply of sell orders.

    Understanding Sell Walls

    A sell wall is a technical indicator in cryptocurrency markets representing a substantial cluster of limit sell orders placed at a particular price point. For the price to surpass this level, buyers must absorb all these outstanding sell orders. The larger the sell wall, the more buying pressure is required to break through it.

    On-chain analytics firm Glassnode identified a sell wall on the Binance exchange situated between $85,000 and $85,500. This wall had reportedly tripled in size between September 24 and September 30, 2026.

    Recent Price Action and Influencing Factors

    On September 21, Bitcoin briefly breached the $85,000 mark, reaching an intraday high of approximately $85,248. A portion of this surge was attributed to the liquidation of roughly $648 million in short positions. Short liquidations occur when traders who bet on a price decline are forced to buy back the asset to close their positions, thereby adding to buying pressure during an upward move.

    However, after the short squeeze subsided, Bitcoin struggled to maintain its position above $85,000 and subsequently retreated.

    Two primary forces contributed to this price pullback. Firstly, demand from U.S. spot Bitcoin Exchange-Traded Funds (ETFs) showed signs of cooling. Net inflows into these ETFs experienced a sharp decline after September 22, reaching a low of just $24 million on September 28.

    Secondly, long-term Bitcoin holders began to take profits. Their share of realized profits increased significantly, rising from 34% to 55% in the week ending September 29.

    Throughout this period, Bitcoin managed to hold above several key support levels. These include the Short-Term Holder Cost Basis, which hovers around $73,300, and the True Market Mean, located near $77,200.

    Key Indicators to Monitor

    Several factors will be crucial in determining Bitcoin’s next move.

    The first is the sustainability of the sell wall’s removal. Sell walls are composed of limit orders, which can be canceled or repositioned at any time. Therefore, monitoring the order book depth on Binance within the $85,000 to $85,500 range will be important.

    The second signal to watch is ETF flows. The significant drop in inflows to $24 million on September 28 highlighted how rapidly institutional demand can fluctuate.

    The third factor is the behavior of long-term holders. With their realized profit share at 55%, these long-term investors have been a significant source of supply at current price levels.

    The price action on September 21 also offers a cautionary tale. The brief surge above $85,000, partly fueled by liquidations, ultimately proved unsustainable.

    On the downside, the True Market Mean near $77,200 and the Short-Term Holder Cost Basis around $73,300 represent critical levels. A sustained break below these points could signal a weakening market structure.


  • Bitcoin Shows Strength in September Amid ETF Inflows and Easing Economic Concerns, but Key Uncertainties Remain

    Bitcoin Shows Strength in September Amid ETF Inflows and Easing Economic Concerns, but Key Uncertainties Remain

    Bitcoin began the fourth quarter on a stronger footing than traditional markets in September, buoyed by substantial inflows into U.S.-listed spot Bitcoin ETFs, ongoing corporate accumulation, and improving economic conditions. The cryptocurrency saw a gain of approximately 8% during the month, significantly outperforming the S&P 500, which remained largely flat, and gold, which experienced a decline of over 6%.

    Several key factors underpinned Bitcoin’s rally. U.S.-listed spot Bitcoin ETFs attracted billions of dollars in September, signaling a resurgence in institutional interest. Corporate entities also continued to expand their Bitcoin holdings, with Strategy acquiring an additional 1,665 BTC and Strive purchasing 1,107 BTC for $94.5 million. This consistent corporate accumulation is viewed as a positive indicator for market sentiment.

    The macroeconomic landscape also contributed to Bitcoin’s upward movement. Lower-than-expected U.S. inflation data for August helped to alleviate concerns regarding further Federal Reserve rate hikes, consequently reducing pressure on Treasury yields. This shift in the economic outlook fostered a more favorable environment for risk assets, including cryptocurrencies, which demonstrated stronger gains compared to traditional markets that showed a more muted response.

    According to Santiment, crypto markets are entering Q4 with several potential growth drivers. These include sustained ETF demand, continued corporate accumulation, progress in regulatory clarity, and renewed participation from altcoins. While acknowledging that elevated yields and crowded leverage can still precipitate sharp pullbacks, the analytics firm noted that “crypto currently has catalysts that traditional assets simply haven’t matched.”

    From a technical standpoint, Bitcoin is currently trading near the $86,000 level. Crypto Patel suggests this price point could be pivotal in determining Bitcoin’s future direction. A sustained breach above $86,000 might open the possibility for a move towards $100,000. However, if Bitcoin fails to maintain this level, traders may be closely watching support zones at $82,886, $80,300, and $76,400.

    Analysis of whale wallets, specifically those holding between 10 and 10,000 BTC, reveals significant accumulation, with these wallets adding 41,025 BTC in just 10 days, bringing their total holdings to 13.64 million BTC. Bitcoin’s longer-term outlook also appears robust, as evidenced by the MVRV Z-Score remaining above its 365-day moving average. Historically, this level has served as support during broader rallies. CryptoQuant’s analysis indicates that if the Z-Score sustains its position above this average, the broader valuation trend remains supportive of further upside. However, a sustained drop below the 365-day average could signal a weakening of the longer-term structure.

    Despite these positive indicators, several uncertainties persist. The critical factor to monitor is Bitcoin’s ability to break and hold above the $86,000 resistance level. Furthermore, the behavior of the MVRV Z-Score relative to its 365-day moving average will be crucial in assessing the sustainability of the current trend. A sustained break below this average could indicate potential weakness in the longer-term structure, and specific support levels to watch if the $86,000 level fails include $82,886, $80,300, and $76,400.

    Why This Matters

    The materials describe a narrow update: Bitcoin gained approximately 8% in September, outperforming the S&P 500 and gold. Whether Bitcoin may break above $86,000 and hold remains a key uncertainty.

    Broader Context

    Source materials place the factual news in this context: Bitcoin outperformed stocks and gold in September as it entered the fourth quarter on a high note, according to Santiment.

  • Perplexity AI Forecasts XRP Rally Through 2026

    Perplexity AI Forecasts XRP Rally Through 2026

    Perplexity AI has forecast a significant surge for XRP, predicting it could reach as high as $4.25 by the end of 2026 in a full bull market. While this figure might appear modest to some, it represents a substantial return for investors over the coming three months.

    Beneath the surface of XRP’s price movements, Perplexity AI observes a notable shift. Activity on the XRP Ledger is accelerating, coinciding with increased institutional engagement and ongoing network upgrades.

    In August and September, active addresses on the XRP Ledger saw an impressive 84% increase, reaching 43,543, while daily payments surpassed 2.6 million. This influx of users and transactions provides the XRP rally with a crucial element that speculation alone cannot: demonstrable network demand.

    The latest iteration, XRPL v3.3.0, further enhances XRP’s utility. Confidential Transfers introduce Zero-Knowledge (ZK) privacy features for tokens, and atomic Batch transactions are designed to support more complex settlement workflows, including institutional use cases involving real-world assets (RWAs).

    Furthermore, regulated demand is beginning to materialize. Recent 13F filings from the Bank of Montreal and the National Bank of Canada revealed exposure to XRP ETFs, integrating XRP into portfolios that collectively manage hundreds of billions of dollars.

    Technical indicators are starting to signal a bullish trend. XRP, which experienced a decline from over $3.00 last year, has recently shown signs of recovery, reclaiming the critical $1.50 level.

    This juncture, however, represents a pivotal test rather than a confirmed reversal. Immediate support is situated around the $1.00 mark; a breach of this level could trigger a downward movement, potentially ranging between $0.90 and $0.75. For bullish momentum to reassert itself, XRP must first regain the approximately $1.10 to $1.20 range.

    XRP concluded trading at $1.51, marking an 8.2% decrease overnight, after fluctuating between $1.48 and $1.63. The Relative Strength Index (RSI) indicates heightened selling pressure, currently standing at 35.75 against a signal line of 40.64. This deficit of 4.89 points suggests that short-term momentum is favoring sellers.

    While XRP is approaching oversold territory, its current low price does not automatically guarantee an imminent reversal. If XRP can maintain its position above $1.50 and break its pattern of lower highs, it would establish a robust technical foundation for Perplexity AI’s $3.50 forecast.

    XRP’s optimistic outlook is significantly tied to advancements in its network capabilities for payments, tokenization, and institutional settlements. Projects like LiquidChain aim to address market fragmentation by enabling seamless capital movement across major ecosystems, rather than treating each blockchain as an isolated unit.

    LiquidChain is currently developing a Layer 3 execution environment designed to unify liquidity across Bitcoin, Ethereum, and Solana. Its architecture prioritizes unified liquidity, streamlined execution, and verifiable settlement, thereby eliminating the need for developers to duplicate product development efforts across different networks.

    This approach offers a novel perspective for the forthcoming crypto cycle. Should capital begin to shift away from established large-cap cryptocurrencies, infrastructure that facilitates cross-chain liquidity could become instrumental in this market reevaluation.

    However, this emerging opportunity is accompanied by the inherent risks typical of early-stage projects. LiquidChain will need to demonstrate its viability through adoption, successful execution, and presale liquidity as it transitions from a conceptual framework to functional infrastructure.

  • Altcoin Volume Surges 4x Bitcoin’s Amid Trader Exodus

    Altcoin Volume Surges 4x Bitcoin’s Amid Trader Exodus

    Altcoin Trading Volume Surges to Four Times That of Bitcoin Amid Market Overheating Concerns

    The altcoin market is exhibiting signs of overheating, with spot trading volumes now four times higher than that of Bitcoin. This surge in activity has also led to increased leverage across the market.

    In response to these conditions, one prominent trader has opted to take profits and reduce their exposure to altcoins. The trader, known as Doctor Profit, reported selling ONDO with a 73% profit and closing a position in HBAR with a smaller gain. XRP remains under observation, with a potential entry point being eyed at a more favorable price. The trader expressed a lack of interest in acquiring more altcoins while market conditions remain so heated, describing them as a “great distraction and liquidity grab.”

    “This is why I’m out of Alts!” Doctor Profit declared.

    Instead, the trader is anticipating a correction in Bitcoin, a stance they have previously articulated. A short position was initiated at $86,200, with additional short orders placed between $86,500 and $89,500.

    While maintaining an overall bullish outlook, Doctor Profit had previously indicated a potential pullback toward $79,000, near the 50-week moving average, before the broader uptrend resumes. The analyst had identified bearish signals across the Relative Strength Index (RSI), MACD/PPO, and Money Flow Index (MFI), while the Average Directional Index (ADX) suggested weakening trend strength.

    Earlier this week, analyst Darkfost also highlighted several warning signs. According to Darkfost, Total2, a metric tracking the altcoin market capitalization excluding Ethereum, has seen inflows exceeding $371 billion since June 2026, representing a 45% increase in just a few months.

    This shift is also evident on the Binance exchange, where 87% of listed altcoins are trading above their 200-day moving average. This marks a significant change from August, when 80% were trading below this key trend level. Darkfost interpreted this move as indicative of growing euphoria surrounding altcoins, a sentiment that has historically proven difficult to sustain over extended periods.

    Another signal is the increase in altcoin deposits to exchanges. Weekly deposit transactions have surpassed 22,700 on Binance and 8,300 on Coinbase, with approximately 32,000 additional deposits across other platforms. While these numbers remain below the levels observed at the beginning of the previous bull cycle, Darkfost also pointed to a developing bearish divergence on Total2’s RSI, suggesting that altcoin momentum may begin to cool following the recent surge.

  • Bitcoin Achieves 44% Quarterly Gain in Q3 2026 Amid Strong ETF Inflows

    Bitcoin Achieves 44% Quarterly Gain in Q3 2026 Amid Strong ETF Inflows

    Bitcoin concluded the third quarter of 2026 with its most significant quarterly gain in over two years, climbing 44%. This performance marks its strongest third-quarter showing since 2017 and ends a streak of three consecutive losing quarters for the cryptocurrency, which historically averages an 8% to 9% return in the third quarter.

    According to the data, Bitcoin opened Q3 2026 between $58,500 and $58,600 and closed the quarter between $84,000 and $86,000, representing a price increase of approximately $26,000. Each month within Q3 2026 closed in positive territory.

    ETF Flows Reverse Course

    The primary driver behind this surge was a notable reversal in the flow of funds through US spot Bitcoin ETFs. The analysis indicates that at the end of July 2026, these funds experienced year-to-date outflows totaling roughly $5 billion. However, by late September, this trend had flipped, with the ETFs recording approximately $1 billion in net inflows. This shift represents a swing of about $6 billion from the July low, which included a single-week inflow record of $2.39 billion.

    This reversal in ETF flows may suggest a return of institutional capital, according to the article. If these inflows persist, it could signal renewed institutional buyer interest.

    Outperforming Traditional Assets

    Bitcoin’s Q3 performance significantly outpaced traditional assets. Gold saw a gain of approximately 8.7% over the same period, while major US stock indices rose by about 2%.

    The SEC’s issuance of exemptions for certain tokenized-stock platforms on September 17, 2026, while not directly impacting Bitcoin, is seen by some as a signal of regulatory openness to blockchain-based financial products.

    Future Outlook and Uncertainties

    Despite the strong quarterly performance, Bitcoin would need to increase by approximately 50% from its late September trading levels of $83,000 to $84,000 to revisit its all-time high of nearly $126,000, which was set in October 2025.

    Looking ahead to Q4 2026, the article notes that this period has historically been strong for Bitcoin. However, macroeconomic conditions present potential risks. Rising Treasury yields could make safer assets more attractive, and shifts in Federal Reserve policy might influence overall risk appetite. It is uncertain whether the current ETF inflows will be sustained.

    Investors are advised to monitor weekly ETF flow data closely, as this has been a key indicator of institutional investor activity. The sustainability of these inflows and the broader macroeconomic environment will be critical factors influencing Bitcoin’s trajectory in the coming months.

    Why This Matters

    The materials describe a narrow update: Bitcoin’s price increased by approximately 44% during the third quarter of 2026, marking its strongest quarterly performance since Q1 2024 and ending a streak of three consecutive losing quarters. Whether the current ETF inflows will hold.

    Broader Context

    Source materials place the factual news in this context: Bitcoin’s Q3 2026 performance is compared to its Q1 2024 performance and its third-quarter performance in 2017.

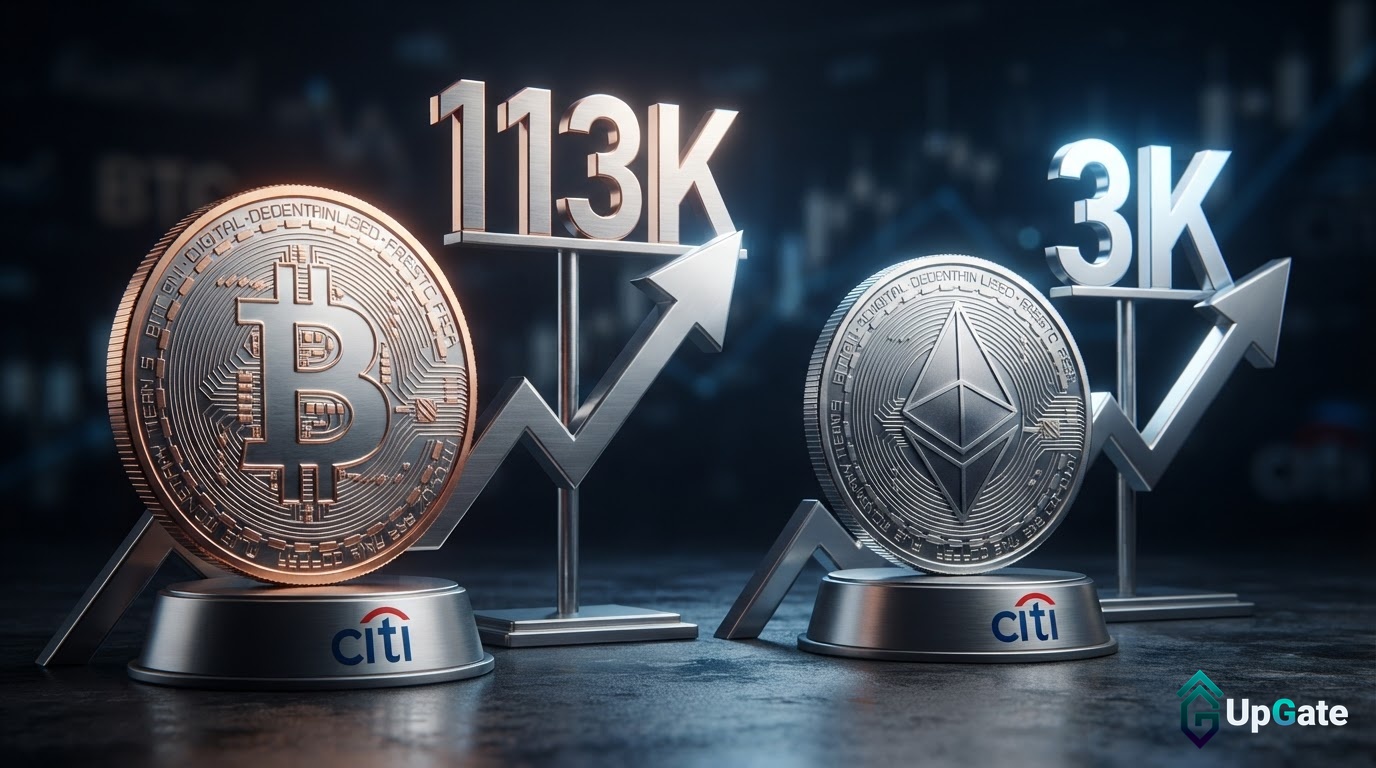
  • Citi Boosts Bitcoin Target to $113K, Ether to $3,028

    Citi Boosts Bitcoin Target to $113K, Ether to $3,028

    Citigroup Boosts Bitcoin Price Target to $113,000, Cites ETF Inflows and Macro Conditions

    Citigroup has significantly raised its 12-month price target for Bitcoin, projecting the cryptocurrency could reach $113,000, a substantial increase from its previous $82,000 forecast. This upward revision reflects a more bullish outlook driven by renewed cryptocurrency activity, improving macroeconomic conditions, and anticipated inflows into crypto exchange-traded funds (ETFs).

    Bitcoin’s Path to New Target

    Bitcoin is currently trading around $83,773. To reach Citigroup’s new 12-month target of $113,000, the digital asset would need to appreciate by approximately 34.8%.

    Shifting Outlook on Bitcoin

    This latest adjustment marks a reversal from Citigroup’s more cautious stance earlier in the year. The bank had initially set a $143,000 target for the start of 2026, subsequently lowering it to $112,000 in March and then to $82,000 in July. The recent upward revision suggests a renewed confidence in Bitcoin’s potential.

    Ether Price Target Also Raised

    In addition to Bitcoin, Citigroup also increased its 12-month price target for Ether (ETH). The new forecast stands at $3,028, up from a previous target of $2,240. With Ether currently trading around $2,700, this represents a required growth of roughly 12.1% to meet the revised target.

    Key Drivers for the Bullish Forecast

    Citigroup attributes its upgraded outlook to several factors:

    • Stronger Crypto Activity: The bank has observed a resurgence in engagement and trading within the cryptocurrency market.
    • Supportive Macroeconomic Backdrop: Easing inflation and other favorable economic indicators are contributing to a more positive environment for risk assets.
    • Resuming ETF Inflows: Citigroup forecasts approximately $5 billion in crypto ETF inflows over the next 12 months. This influx of capital is expected to provide significant support for cryptocurrency prices.

    Gradual Inflow Expected

    While optimistic about ETF demand, Citigroup does not anticipate a sudden surge of buying activity. Instead, the bank expects inflows to return at a more measured, yet consistent, pace. This gradual increase is attributed to financial advisors and brokerages slowly integrating Bitcoin into their clients’ portfolios.

    Additional Supporting Factors

    Citigroup also highlighted a softer U.S. dollar and buybacks of longer-dated U.S. Treasury bonds as elements contributing to the recent recovery in cryptocurrency markets. The bank noted that while the failure of the CLARITY Act vote initially presented a challenge to market structure legislation, subsequent announcements from the Securities and Exchange Commission (SEC) helped to mitigate negative sentiment.

    Ether’s Performance

    Ether has shown strong performance in recent months, gaining nearly 68% over the past three months. However, it remains down approximately 9% year-to-date.

  • XRP Price Outlook: October Surge Expected

    XRP Price Outlook: October Surge Expected

    XRP Enters October on a High Note, But Historical Patterns Hint at Caution

    XRP is heading into October following three consecutive months of gains, prompting questions about whether the cryptocurrency can sustain its recovery or is due for a correction based on past market behavior.

    The digital asset saw a 2.10% increase in July and a significant 29.94% surge in August. September was also on track to close positively, with estimates placing the monthly gain between 6% and 10%.

    However, historical data reveals a recurring pattern: XRP’s price has tended to decline after periods of three straight months of positive performance. XRP has experienced four prior instances of three consecutive “green” monthly candles. In each of these cases, the subsequent month concluded with a price decrease.

    These past declines have been substantial, averaging approximately 40% in 2014, 39% in 2017, 18% in 2023, and 29.3% during the 2024-25 period. Furthermore, the three months following these drops were also negative in three out of the four recorded instances. XRP fell 66% in 2014, 26% in 2017, and 27.8% in 2025. The exception was in 2023, when XRP managed to gain about 2% in the subsequent three months.

    Shifting Market Dynamics

    Despite these historical precedents, the current market setup presents some differences from earlier periods. The previous rallies were often followed by much larger monthly price increases, whereas XRP’s gains in July and August of this year have been more moderate. This divergence makes it uncertain whether the current three-month advance signals a temporary pause before a correction or the commencement of a more significant price movement.

    Inflows and Accumulation Signal Demand

    Adding to the complex picture, XRP-focused exchange-traded funds (ETFs) have recorded consistent inflows in recent weeks. Data indicates 14 positive weeks out of the last 15, with notable weekly inflows including approximately $3.96 million, $75 million, $9.56 million, and $18.98 million. These sustained inflows suggest ongoing demand for XRP investment products. The key question remains whether this demand can counteract a potential seasonal or technical correction.

    Further bolstering the bullish sentiment, large XRP holders, often referred to as “whales,” have been increasing their stakes. These entities accumulated nearly 500 million XRP over a five-day period around September 24. While such accumulation can be an indicator of heightened buying activity, it does not, in isolation, definitively establish the future direction of XRP’s price.

    Upcoming Events and Technical Outlook

    Several major industry events are scheduled for the coming weeks, including Korea Blockchain Week, XRP Seoul 2026, Token2049, Money20/20, and Ripple Swell. Ripple Swell, in particular, is likely to attract significant attention from XRP investors, as any announcements regarding partnerships or business developments could influence market sentiment.

    XRP has recently been trading around the $1.50 level, with $1.58 identified as a critical level to monitor. A sustained move above $1.70 could reinforce the current upward trend and bring the $2 mark into focus. Conversely, a decline below key support levels could elevate the risk of a pullback. Short-term technical analysis also suggests an overbought reading, indicating that XRP might experience increased volatility before its next significant price move.

  • Solana App Revenue Hits Nine-Month High Amid Shifting Market Share

    Solana App Revenue Hits Nine-Month High Amid Shifting Market Share

    Solana’s application revenue surged to a nine-month high of $180 million in September, marking a significant uptick in the network’s economic activity. According to DeFiLlama data, this figure represents a 32% share of all blockchain application revenue for the month. The network also saw its daily app revenue peak at $7.935 million on September 12, the highest single-day total recorded in 2026, with weekly revenue reaching $49.9 million in late September.

    Beyond revenue, Solana logged 7,699 monthly active programs in September, the highest count since August 2025. Programs are Solana’s equivalent of smart contracts, which power decentralized applications (dApps). This increase in active programs suggests growing developer engagement and a potentially expanding ecosystem.

    However, despite this strong performance in revenue and active programs, Solana’s overall market share of blockchain app revenue decreased to 32% in September from 38.1% in August. In August, Solana apps generated $143.23 million, contributing to a global app revenue total of $375.53 million. This shift indicates that while Solana’s own revenue grew, other blockchain networks also experienced growth or increased their revenue-generating activities, intensifying the competitive landscape.

    It is important to note that the precise total for Solana’s September app revenue can vary based on the methodology employed by different data trackers. For instance, one Spanish-language report estimated Solana’s September app revenue at approximately $145.75 million, a figure notably lower than the $180 million reported by DeFiLlama. This discrepancy underscores the importance of understanding tracking methodologies, as they can significantly impact reported figures.

    The combination of rising revenue and an increasing program count could signal sustainable economic growth on the Solana network. Nevertheless, the concurrent decrease in market share highlights the dynamic and competitive nature of the blockchain ecosystem. Future data will be crucial in determining the long-term implications of these trends for Solana’s position.

    Why This Matters

    The materials describe a narrow update: Solana’s applications generated $180 million in revenue in September, the highest amount in nine months. The exact total of Solana’s September app revenue depends on the methodology of different trackers.

    Broader Context

    Source materials place the factual news in this context: Programs are Solana’s version of smart contracts, the code that powers apps on the network.

  • Bitcoin Sees Volatility Post-PCE Data; Altcoins NIGHT, BTW, STX Post Significant Gains

    Bitcoin Sees Volatility Post-PCE Data; Altcoins NIGHT, BTW, STX Post Significant Gains

    Bitcoin experienced notable price volatility on September 30, reacting to the release of US Personal Consumption Expenditures (PCE) data. The cryptocurrency initially surged to $85,600 following the data publication, but faced rejection and subsequently retreated to $83,600 as of press time, according to reports.

    This price action occurred within Bitcoin’s established trading range of $83,000 to $85,000. The lower boundary of this range had been tested more frequently, with occasional dips below it, though Bitcoin managed to hold the level.

    While Bitcoin navigated its trading range, several altcoins demonstrated significant upward momentum. BTW recorded a substantial 35% increase, reaching $1.41. NIGHT saw a 26% surge, trading above $0.04, and STX rose by 22%, nearing $0.4.

    In the broader market, Ethereum continued to face resistance around the $2,700 mark. BNB traded above $765, and XRP saw a slight dip below $1.50. Other assets, including SOL, TRX, LINK, RAIN, XLM, and BCH, posted minor losses over the past day. HYPE approached $90 after a 3% increase, and QNT saw a similar daily jump, trading above $290.

    The total cryptocurrency market capitalization experienced a modest increase of just over 1% from the previous day, reaching $2.890 trillion. Bitcoin’s market capitalization stood at $1.680 trillion, with its dominance on CoinMarketCap remaining stable at 58.6%.

    Previously, Bitcoin had reached a high of over $87,000 in late January. After a vigorous rejection at this level, it had fallen to under $83,000 in September. The recent PCE data, which exceeded expectations, initially propelled Bitcoin upwards, but the momentum proved unsustainable, leading to its retreat to the $83,600 level.

    Why This Matters

    The materials describe a narrow update: Bitcoin’s price fluctuated significantly after the US PCE data release, initially surging to $85,600 before falling to $83,600. The exact timing of the ‘wild price moves’ for Bitcoin after PCE data.

    Broader Context

    Source materials place the factual news in this context: The article is a market watch report from CryptoPotato.

  • Citi’s Bitcoin Price Forecast Raised to $113K, Ether to $3K, Amidst Conditional Inflows

    Citi’s Bitcoin Price Forecast Raised to $113K, Ether to $3K, Amidst Conditional Inflows

    Citi has raised its 12-month price forecast for Bitcoin to $113,000, an increase from its previous $82,000 projection, and lifted its Ether forecast to $3,028 from $2,240, according to reports on October 1. These revised targets are conditional on a gradual resumption of institutional inflows rather than an immediate surge.

    Conditions for Credibility
    According to Citi, the updated Bitcoin forecast reflects stronger crypto activity, a more supportive macroeconomic backdrop, and the potential for renewed exchange-traded fund (ETF) inflows. The bank anticipates approximately $5 billion in crypto inflows over the next 12 months. This slower-but-steadier expectation suggests a base case where institutional participation rebuilds over time, potentially providing a persistent bid without the sharp price movements often associated with concentrated inflows.

    The revised forecast profile is described as constructive but less forceful than one built on an immediate wave of new allocations. Citi noted that if demand were to stall or reverse, the updated target would have less near-term flow support, highlighting the conditional nature of the projection.

    Market Context and Recent Performance
    This forecast revision follows a recent recovery in Bitcoin’s price. The cryptocurrency rose nearly 40% over the three months leading up to October 1, narrowing its year-to-date loss to approximately 4%. While this recovery improves the momentum backdrop, Citi’s analysis suggests that a rally already recorded is not evidence that the next phase of growth is assured.

    Regulatory and Macro Influences
    Citi’s assessment also considers the regulatory environment. While the Senate’s failure to advance the Clarity Act was noted as a setback for the digital-asset industry, Citi indicated that subsequent Securities and Exchange Commission rule announcements helped to dampen negative sentiment. Macroeconomic factors, such as a softer dollar and the US Treasury’s move to buy back longer-dated bonds, are also cited as contributing to Bitcoin’s recent recovery. However, the bank cautions that these factors shape risk appetite and financial conditions, but their timing does not alone explain Bitcoin’s advance.

    Outlook and Uncertainties
    The $113,000 Bitcoin projection is considered more credible if ETF demand returns and builds in line with Citi’s gradual-allocation scenario, alongside continued supportive crypto activity and a favorable macro backdrop. The relevant signal for sustained demand is not a single positive-flow session, but rather sustained demand over time. A renewed stretch of outflows would challenge the demand assumption underpinning the upgrade.

    For market positioning, Citi’s forecast serves as a higher 12-month reference point, rather than a standalone entry signal. The next test for the market, according to Citi’s view, is whether institutional flows can extend Bitcoin’s recent recovery rather than merely follow it. The bank’s revised Bitcoin price target remains conditional on this measured pace of inflows.

    Why This Matters

    Citi has raised its 12-month price forecast for Bitcoin to $113,000 from $82,000 and for Ether to $3,028 from $2,240. Whether slower, steadier institutional allocations can sustain the upgrade without sharp acceleration remains a key uncertainty.