Tag: Market Trends

  • Altcoin Bull Run Poised for Record Highs, Analyst Claims

    Altcoin Bull Run Poised for Record Highs, Analyst Claims

    Altcoin Market at a Potential Turning Point, Analyst Suggests

    The altcoin market may be poised for a significant shift, with several key indicators breaking out of year-long downtrends, according to analyst Matthew Hyland. His analysis suggests that smaller cryptocurrencies are gaining momentum against Bitcoin and traditional risk assets, though a rise in leverage also heightens the risk of a sharp correction.

    Chart Breakouts Signal Potential Shift

    In a September 7 post, Hyland highlighted that Ethereum (ETH), Total 2 (tracking altcoins excluding Bitcoin), Total 3 (excluding Bitcoin and Ethereum), and OTHERS (focusing on tokens outside the top 10) have all signaled the end of their extended declines by forming higher highs.

    Bullish Outlook for Altcoins

    Hyland initially questioned whether these movements were merely a “bear market rally” but later offered a more optimistic assessment. In a subsequent post, he stated, “The largest #Altcoin Bull Run of all time is loading,” predicting it could surpass the gains seen in 2020-2021. This forecast is supported by a chart comparing the dominance of cryptocurrencies outside the top 10 against the S&P 500 (OTHERS.D/SPX).

    This ratio has been in decline for years following a peak during the 2017-2018 Initial Coin Offering (ICO) boom. The current reading is positioned near the lower end of this long-term downtrend. Furthermore, an oscillator on the chart has entered oversold territory around 20-30, a setup being compared to the overbought conditions near 80 observed in 2017. While this doesn’t definitively confirm a new altcoin cycle, it underpins Hyland’s belief that smaller tokens may be entering a period of relative strength.

    Increased Trading Activity and Market Cap Growth

    Evidence of heightened trading activity is emerging, with data from Coinalyze indicating that altcoin perpetual futures open interest has surpassed Bitcoin’s for the first time since December 2024. This shift coincides with altcoins outside the top 10 seeing their combined market capitalization rise to $213 billion, an increase of nearly 12% since the beginning of September.

    Notable Altcoin Performances

    Zcash (ZEC) has been a standout performer, recently surpassing $1,200—a 370% surge from its early June low. Its market capitalization also moved above $20 billion, positioning it ahead of Hyperliquid (HYPE) and Dogecoin (DOGE) at the time of writing. Both HYPE and DOGE had experienced gains exceeding 11% in the preceding 24 hours. Dogecoin itself and BNB also posted significant gains, with DOGE climbing 12% from its Friday low to $0.094, while BNB approached $780, its highest level since early February.

    Warning Signs of Leverage

    However, a cautionary note has been sounded. Zcash perpetual futures open interest reached $2.7 billion, according to CoinGlass. The cryptocurrency’s move above $1,200 triggered $24 million in liquidations over the past 24 hours, with over $17 million of that amount being short positions. Historically, similar shifts in derivatives positioning have preceded corrections in mid-cap tokens.

    Competing Signals and Future Outlook

    The market currently presents two contrasting signals: improving breadth in altcoin movements and breakouts on several long-term charts, juxtaposed with rapidly accumulating leverage. Despite these competing factors, Hyland views the positive chart developments as strong indicators that the market may be entering a more substantial altcoin phase.


  • Crypto Holders Leaned on Digital Asset Loans in 2026 Amidst Market Downturn

    Crypto Holders Leaned on Digital Asset Loans in 2026 Amidst Market Downturn

    In 2026, cryptocurrency holders increasingly turned to loans backed by digital assets as market conditions weakened, prompting shifts in borrowing behavior and collateral preferences, according to research from CryptoQuant. This trend allowed users to access liquidity without immediately selling their holdings.

    The data reveals a significant uptick in loan activity. The average number of loans per retail user surged by 74%, from 30.8 in 2025 to 53.5 in 2026. High-net-worth users also saw an increase, with the average number of loans rising 18% from 16.5 to 19.4 over the same period. Repeat borrowing became more common, with the percentage of users taking multiple loans climbing from 61.9% to 65.1%. Retail borrowers also adjusted their cadence, spacing out loans by an average of 21 days in 2026, up from 11 days in 2025.

    Collateral composition saw notable changes. For high-net-worth individuals, Bitcoin’s share as pledged collateral dropped substantially from 57.8% to 30.5%. Concurrently, Zcash gained prominence, accounting for 24.2% of pledged assets among this group. This rise is partly attributed to Zcash’s significant price rally, which saw its value increase from around $50 in late 2025 to approximately $800 in 2026.

    Retail users also diversified their collateral. While XRP remained a popular choice, its share decreased from 41.7% to 35.2%. Other assets such as TRON, Stellar, BNB, Kaspa, and Velo also saw increased use as collateral.

    In terms of trading volume, Tether and Bitcoin maintained their top positions, with USD Coin moving into third place. Flare, Ether, and Ondo also entered the top 10, while Solana, Stellar, and Shiba Inu fell out.

    These evolving borrowing and collateral strategies indicate that crypto holders were adapting to the challenging market environment of 2026, seeking financial flexibility through digital asset-backed lending.

    Why This Matters

    The materials describe a narrow update: In 2026, crypto holders, both retail and high-net-worth, increased their reliance on loans collateralized by digital assets as market conditions weakened. The exact reasons for the shift in collateral preferences beyond Zcash’s price rally are not fully detailed.

    Broader Context

    Source materials place the factual news in this context: Crypto-backed loans allow holders to access cash without immediately selling their digital assets.

  • XRP Spot Trading Volume Reaches Six-Month High in August Amidst Mixed ETF Signals

    XRP Spot Trading Volume Reaches Six-Month High in August Amidst Mixed ETF Signals

    XRP’s spot trading volume surged to a six-month high in August, coinciding with a price rebound and increased network activity, according to reported data. However, recent net outflows from U.S. spot XRP Exchange Traded Funds (ETFs) suggest a potential cooling of institutional demand, presenting a mixed picture for the cryptocurrency.

    August Trading Surge
    Binance recorded $7.28 billion in XRP spot trading volume during August, the highest monthly figure since February. Upbit and Bithumb also reported substantial activity, with approximately $4.68 billion and $2.59 billion in XRP spot trading volume, respectively. This elevated trading activity occurred as XRP’s price recovered from lows in the $1.30s back towards the $1.40 to $1.45 area.

    Network Activity Increases
    Beyond trading volume, network metrics indicated heightened engagement. Exchange outflows reportedly reached a six-month high, and active addresses on the XRP Ledger (XRPL) reportedly jumped by 659%. These combined metrics suggest increased participation and demand for XRP.

    ETF Demand Cools
    Despite the robust spot trading and network activity, institutional investor signals present a more nuanced view. After an 11-session streak of inflows totaling approximately $170 million, U.S. spot XRP ETFs experienced net outflows of $7.2 million on a recent Wednesday. This cooling of institutional demand contrasts with the heightened trading volume observed on exchanges.

    Interpreting the Signals
    Analysts suggest that while the increased spot trading volume and network activity may indicate renewed interest, these metrics alone do not suggest accumulation. Traders are advised to wait for price confirmation before treating the activity spike as a definitive signal. XRP is currently facing resistance between $1.45 and $1.50. A decisive breakout above this level with sustained volume is considered important for strengthening the case for further price increases.

    Conversely, the $1.30 to $1.32 zone is identified as key support. A loss of this level could invalidate the current support structure and expose XRP to lower prices, potentially in the low $1.20s. The upcoming price action is expected to test whether underlying demand for XRP remains strong, particularly in light of the recent cooling of ETF inflows.

    The current situation presents a complex outlook for XRP, characterized by strong on-chain and trading activity but tempered by mixed signals from institutional investment vehicles. The ability of XRP to sustain its price above key resistance levels, alongside continued network activity, will be crucial in determining its near-term trajectory.

    Why This Matters

    The materials describe a narrow update: XRP’s spot trading volume on major exchanges, particularly Binance, reached its highest point in six months during August. Whether the increased spot trading volume and network activity suggest accumulation for XRP.

    Broader Context

    Source materials place the factual news in this context: The article discusses XRP price predictions and market activity.

  • XRP ETFs Continue Inflows for Eighth Week, But Signs of Softening Demand Emerge

    XRP ETFs Continue Inflows for Eighth Week, But Signs of Softening Demand Emerge

    Spot XRP Exchange-Traded Funds (ETFs) have achieved their eighth consecutive week of net inflows, attracting approximately $19 million in the last full week of August. Despite this sustained positive trend, recent data suggests potential signs of waning demand, including a notable absence of inflows on a recent Friday.

    Sustained Inflows Amidst Emerging Concerns
    The cumulative total net inflows for XRP ETFs have reached an all-time high of $1.68 billion. However, the inflows for the last full week of August, while positive, were lower than the previous week’s figures. Further signs of a slowdown appeared on Wednesday of the previous business week, which saw outflows totaling $7.20 million. This marked the first ‘red day’ for Ripple ETFs since August 5, breaking a near one-month streak of net inflows. While Thursday saw a return of inflows amounting to $6.14 million, Friday recorded zero inflows, according to data from SoSoValue.

    This pattern of reduced inflows and a no-inflow day has reignited discussions about the underlying demand for XRP ETFs, a concern that had been less prominent during previous weeks of consistent positive flows. Before a market-wide revival experienced after August 19, August saw seven ‘no-reportable flow’ days out of 11 trading days for spot XRP ETFs.

    XRP Price Action and Analyst Outlook
    In parallel with the ETF performance, the price of XRP has experienced some volatility. The asset dipped below the key support level of $1.40 last weekend and further declined to $1.33 earlier this week. However, XRP showed resilience, recovering to $1.45 on Friday and trading at $1.41 as of press time. This price action indicates that XRP remains above its crucial $1.40 support level.

    Despite the recent fluctuations and concerns about demand, some analysts maintain a bullish outlook on XRP, suggesting that its bull phase may have commenced. Analysts such as Ali Martinez and EGRAG CRYPTO have outlined ambitious price targets for XRP, projecting potential figures of up to $60 by the culmination of the current bull market. However, these projections are subject to significant uncertainty and should be viewed as speculative.

    Conclusion
    The current situation presents a mixed picture for XRP. The sustained inflow trend into its ETFs is a positive indicator, contributing to a substantial cumulative net inflow. Nevertheless, the recent dip in daily inflows and the occurrence of outflows and zero-flow days warrant attention as potential indicators of softening investor interest. The ability of XRP’s price to hold above the $1.40 support level will be a key factor to monitor in the coming period, alongside future ETF flow data.

    Why This Matters

    The materials describe a narrow update: Spot XRP ETFs experienced their eighth consecutive week of net inflows, totaling approximately $19 million. The actual demand for XRP ETFs.

    Broader Context

    Source materials place the factual news in this context: The article is from CryptoPotato.

  • ZEC Hits $1,200: Surge Explained

    ZEC Hits $1,200: Surge Explained

    Zcash Surges Past $1,200, Rebounding Sharply After Privacy Vulnerability Scare

    Just three months ago, Zcash (ZEC) was engulfed in fear, uncertainty, and doubt (FUD) following the disclosure of a vulnerability in its Orchard privacy pool. The incident raised uncomfortable questions about the security of the privacy-focused cryptocurrency. However, the situation has dramatically reversed, with the protocol patching the issue and Zcash emerging as a top performer among large-cap altcoins in the past quarter.

    From Vulnerability to Recovery

    The vulnerability was initially revealed by Zcash founder Zooko Wilcox and members of Shielded Labs. They explained that a hacker could have exploited the weakness to create an unlimited supply of fake ZEC within Orchard, Zcash’s shielded transaction layer, without immediate detection. Although the flaw was rectified by the time of the public announcement, the news prompted some prominent figures, including Arthur Hayes, to divest their holdings, citing concerns about potential future risks.

    The immediate impact on Zcash’s native token was significant. The asset, trading at $650 prior to the disclosure, plummeted by 60% to $260 within approximately 24 hours as FUD spread.

    A Meteoric Rise

    The trend for the privacy coin began to reverse thereafter. Zcash stabilized around the $500 mark, where it remained for the subsequent two months. A substantial upward movement commenced with a market-wide breakout on August 19, propelling the price to $900. While other cryptocurrencies saw their gains stall, ZEC continued its ascent, briefly surpassing $1,200 earlier today for the first time in nearly a decade.

    This remarkable surge represents a 370% increase from its early June low. Zcash’s market capitalization now exceeds $20 billion, positioning it ahead of HYPE and DOGE.

    Market Reactions and Analyst Outlook

    Data from CoinGlass indicates that ZEC’s impressive surge over the past 24 hours has led to $46 million in short liquidations, the highest across all cryptocurrencies.

    Shortly after the mid-August rally began, Grayscale launched its Zcash ETF on August 25, which has already attracted $34.4 million in net inflows.

    “The bigger question isn’t whether Zcash can keep going up. It’s whether the ETF era is creating a new pathway for capital to rotate into crypto assets that were previously overlooked. ZEC may be an early test of that thesis,” commented The Wolf of All Streets.

    Meanwhile, Ted Pillows noted that a significant whale has been dollar-cost averaging (DCA) into ZEC between 2022 and 2024, accumulating 22,840 ZEC for approximately $1.1 million. This position had grown to $23 million by today, when the whale transferred the entire amount to Binance, potentially to realize profits.

    Crypto Patel offered an optimistic outlook on ZEC’s price potential, identifying a “Beautiful Cup & Handle Pattern” on the weekly chart. He suggested that the asset’s break above the pattern’s neckline/resistance could signal another substantial surge, potentially reaching $2,200.

    As Per $ZEC Chart, you can see a Beautiful Cup & Handle Pattern formed on the Weekly Timeframe. @Zcash has already broken the Neckline/Resistance of this pattern, and if the pattern follows the 100% target, the target could be around $2,200.

    No doubt, Cup & Handle is a strong… pic.twitter.com/Eys4EivIHQ
    — Crypto Patel (@CryptoPatel) September 6, 2026

  • Ancient Bitcoin Wallet Awakens, Turns $120 Into $3 Million

    Ancient Bitcoin Wallet Awakens, Turns $120 Into $3 Million

    Ancient Bitcoin Wallets Resurface, Hinting at Potential Sales

    A steady stream of long-dormant Bitcoin wallets has continued to reawaken in recent days, with at least four more substantial stashes of the cryptocurrency stirring, one of which appears to be destined for sale.

    According to blockchain monitoring by Galaxy Research, these newly active wallets collectively moved 202.84 BTC, valued at approximately $15.73 million, between August 29 and September 4.

    The largest of these awakened holdings, containing 146.06 BTC (about $11.31 million), had remained untouched since November 2013, a period of nearly 12.8 years. This move represents a staggering gain of about 12,902% from its original cost basis, which was near $595. Following this was a 40 BTC wallet dormant since November 2011, now worth around $3.09 million. This particular holding saw an astonishing increase of 2,571,899% from an average cost of roughly $3, meaning this patient holder effectively turned approximately $120 into over $3 million by holding onto it for close to 15 years.

    Two smaller wallets completed the recent batch: one holding 10 BTC untouched since June 2011, valued at about $777,000, and another with 6.78 BTC last active in February 2011, worth near $551,000. The oldest coins in this group displayed astronomical paper gains, with the 2011-era holdings up more than 2,000% and, in one instance, over 500,000% from their initial purchase price.

    This latest flurry of activity extends a trend that has accelerated over the summer. Recent data from Galaxy charts indicates that Bitcoin’s oldest cohort – coins dormant for a decade or more – are stirring at a pace rarely observed. An earlier wave in August saw six wallets move roughly $40 million within a single 10-day period.

    Typically, the fate of coins moved from such dormant wallets remains ambiguous, as a simple transfer does not reveal whether the owner intends to sell, consolidate, or shift funds to new custody. However, this latest instance provided a clearer indication from one wallet.

    Galaxy tagged the 6.78 BTC transfer with a recipient attribution of Coinbase, suggesting that these decade-old coins were sent to the exchange. Such a move is commonly associated with an intention to sell rather than merely relocating funds.

    Several of the reawakened wallets also carried “Noah Doe” sender tags. This designation refers to a New York lawsuit aiming to have thousands of dormant addresses declared abandoned property. Wallets linked to that case have been stirring regularly since a judge paused proceedings in June.

    The reasons behind the current surge in activity from these vintage holders remain unclear, but each awakening reignites discussions about the potential return of long-lost Bitcoin supply to the market.

  • Bitcoin Consolidates Above Support, Faces Resistance Near $80.5K-$82.5K

    Bitcoin Consolidates Above Support, Faces Resistance Near $80.5K-$82.5K

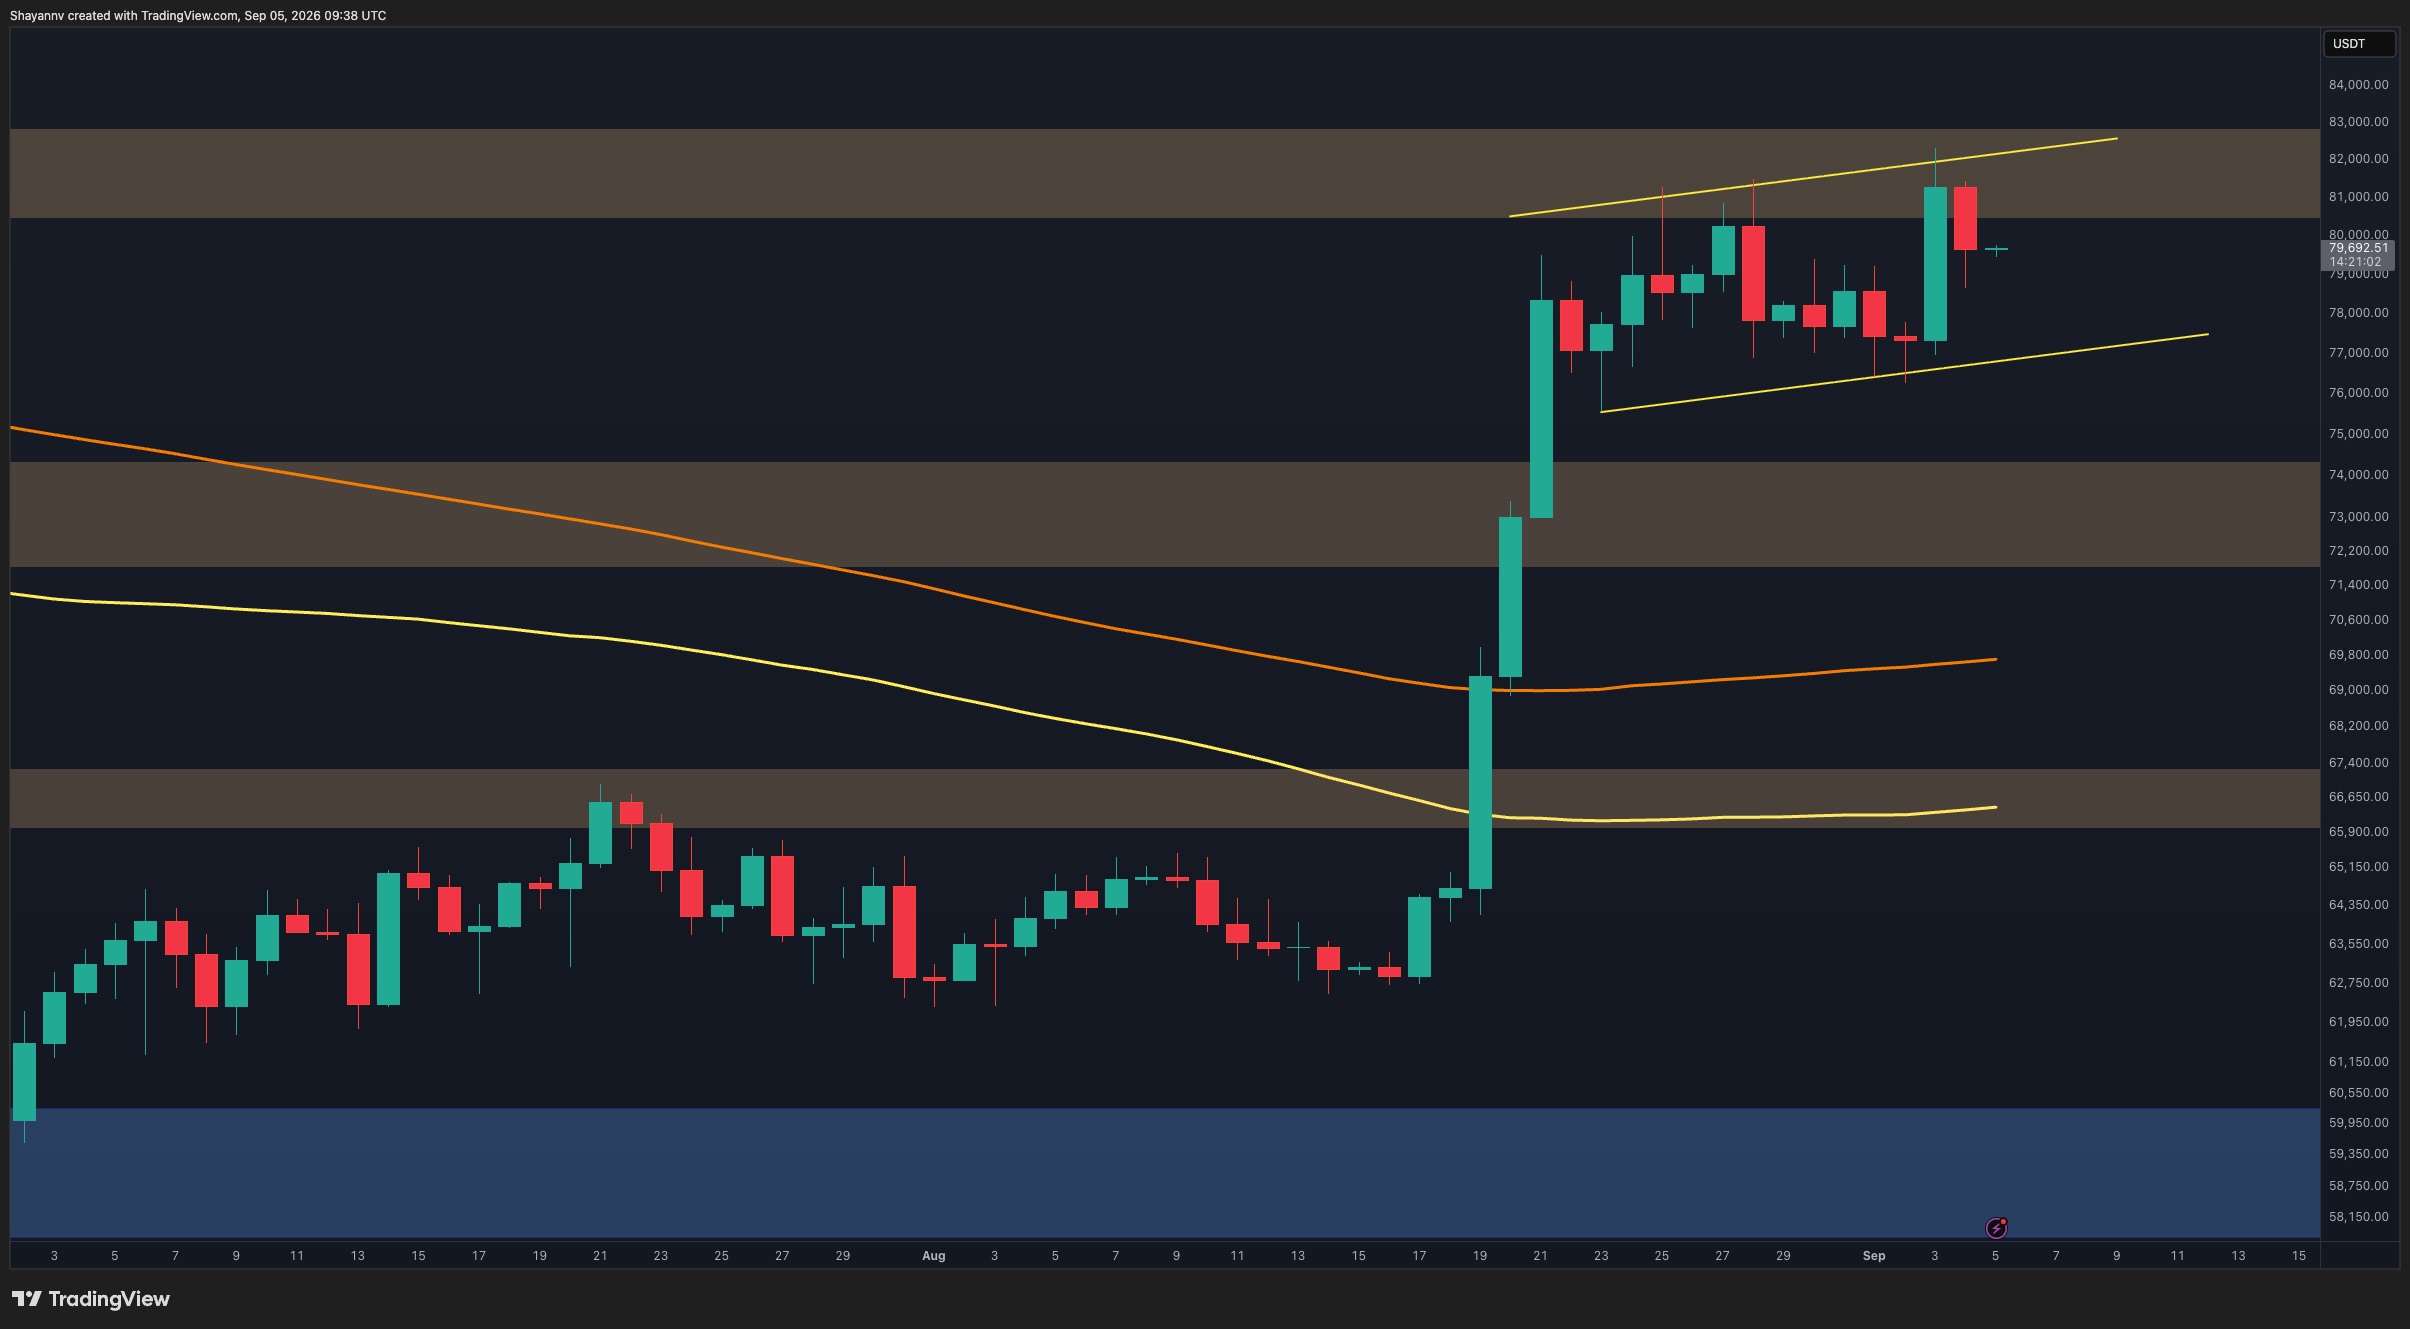
    Bitcoin is currently consolidating, trading below the $80,000 mark but holding above a crucial support channel near $76,000-$77,000. The cryptocurrency recently experienced a rejection from the resistance zone between $80,500 and $82,500, following a period of consolidation after a notable price move. This price action indicates that while the broader trend remains constructive, buyers are struggling to sustain momentum above key levels, leaving the market susceptible to liquidity-driven movements.

    Current Price Action and Key Levels

    Bitcoin’s daily structure shows strength compared to its pre-August phase. The asset remains above the former $72,000-$74,500 resistance zone and both moving averages, suggesting the overall bullish shift is intact despite recent momentum challenges. However, repeated selling pressure has been observed within the $80,500-$82,500 resistance area. The latest attempt to breach this zone briefly reached towards $82,000 before sellers pushed the price back below $80,000. This inability to establish acceptance above resistance indicates that supply remains active at higher price points.

    Technical Analysis: Support and Resistance Dynamics

    The asset continues to trade within a gradually ascending channel, with its lower boundary around the $76,000-$77,000 region serving as the most important nearby structural support. As long as Bitcoin remains above this level, the current price action can be interpreted as consolidation following a sharp rally, rather than a reported bearish reversal. A decisive move above the $80,500-$82,500 zone would strengthen the continuation scenario. Conversely, a loss of the channel support around $76,000-$77,000 could trigger a more substantial correction, potentially targeting the former $72,000-$74,500 zone as the next major area of interest.

    Liquidity Dynamics and Potential Scenarios

    The 4-hour chart highlights the market’s current indecision. Bitcoin rallied from the lower boundary of its ascending structure near $76,500-$77,000 and quickly tested the $81,000-$82,000 area. Sellers rejected this move, causing the price to drop towards $79,500, where it has entered tight short-term consolidation. This pattern contrasts the rising channel with repeated failures near its upper boundary. Buyers are defending higher lows, but they have yet to demonstrate sufficient momentum to convert the $80,500-$82,500 supply area into support. The $76,500-$77,500 region remains crucial; another test could determine the survival of the ascending structure. A strong reaction would keep a renewed push towards $81,000-$82,000 in play, while a move below this level would signal a transition into a deeper corrective phase.

    Analysis of the one-week Bitcoin liquidation heatmap reveals substantial liquidity on both sides of the current price, supporting the possibility of continued choppy trading and liquidity sweeps. Above the market, notable liquidation concentrations are observed around $81,000-$82,000, extending towards approximately $84,000. These clusters could attract price action if buyers regain momentum. However, the downside liquidity is particularly relevant following the latest rejection. A broad and dense concentration of liquidity is visible below the market, especially around the $76,000-$78,000 region, aligning closely with the lower boundary of the ascending technical structure. Consequently, the analysis suggests a downside liquidity sweep towards $76,000-$78,000 is a plausible near-term scenario before another recovery attempt. Such a move would not automatically invalidate the broader bullish setup, but a sustained move below this region would increase the probability of a deeper retracement towards the $72,000-$74,500 support zone.

    Why This Matters

    This market analysis is significant because Bitcoin’s current price action represents a critical juncture. The asset is holding above key support levels ($76K-$77K) and former resistance ($72K-$74.5K), indicating a constructive broader trend. However, repeated rejections at the $80.5K-$82.5K resistance zone highlight buyer struggles and the potential for liquidity-driven swings. The interplay between these levels and the surrounding liquidity pools will likely dictate Bitcoin’s near-term directional move.

    Broader Context

    Bitcoin remains locked in a consolidation phase after a notable price move. The latest rejection from the upper end of the structure shows that buyers are still struggling to generate sustained momentum above $80K. The broader trend remains constructive, although the current range leaves BTC vulnerable to further liquidity-driven swings before its next directional move.

  • Binance Coin Reaches 7-Month High Driven by US Futures Launch and BNB Chain’s Tokenized Asset Activity

    Binance Coin Reaches 7-Month High Driven by US Futures Launch and BNB Chain’s Tokenized Asset Activity

    Binance Coin (BNB) has surged to a seven-month peak, trading at $770, a significant price movement attributed to two key developments: the launch of regulated perpetual futures contracts for BNB in the US by Kalshi, and reports highlighting the substantial role of BNB Chain in the trading of tokenized equities.

    In the past 24 hours, BNB experienced a notable increase of over 6%, reaching its highest point since early February. This rally occurred despite a broader market downturn following a strong US jobs report, which had previously was associated with a retracement in BNB’s price from $725 to $710 yesterday. The asset found support at $710 before its subsequent surge to $770.

    Regulatory Catalyst: Kalshi Futures
    The introduction of regulated BNB perpetual futures contracts in the US by Kalshi, an exchange overseen by the Commodity and Futures Trading Commission (CFTC), is a significant factor. For eligible US traders, leverage on these contracts is capped at approximately 4.5x. Kalshi also supports integrations with BNB Smart Chain (BSC) for managing international accounts and has previously added support for other altcoins such as ADA, AAVE, WLD, and VVV.

    Tokenized Asset Growth: BNB Chain’s Role
    Complementing the regulatory news, a Grayscale report, cited by Wu Blockchain, indicates that BNB Chain is a widely utilized network for trading tokenized equities. The report noted that the weekly spot volume for tokenized equities reached a peak of nearly $3 billion in August. Currently, only 5% of the tokenized equity market is deployed in on-chain finance. Among the networks facilitating this trading, Robinhood Chain leads, followed by BNB Chain and Solana.

    Grayscale has suggested that increased regulatory clarity in the US could potentially expand tokenized stocks from global, around-the-clock trading products into more productive on-chain financial assets. This perspective underscores the evolving landscape of tokenized markets and the potential for further integration with traditional finance.

    While BNB’s performance has shown resilience against broader market trends, certain uncertainties remain. The long-term impact of regulatory developments on tokenized assets and the precise definition of ‘eligible US traders’ for Kalshi’s futures contracts are areas that warrant continued observation. The future trajectory of BNB’s price will likely depend on these evolving regulatory frameworks and the sustained growth of utility on the BNB Chain.

    Why This Matters

    The materials describe a narrow update: Binance Coin experienced a significant price surge, reaching $770, its highest point in seven months. The exact impact of the US jobs report on BNB’s price beyond the immediate retracement.

    Broader Context

    Source materials place the factual news in this context: Binance Coin is among the top performers in the past 24 hours in the altcoin space, surging by over 6% and further extending its lead above XRP in terms of market cap placement.

  • XRP Rally Ignites, Analysts Predict Shocking Targets

    XRP Rally Ignites, Analysts Predict Shocking Targets

    XRP Surges Amidst Analyst Optimism, With Some Predicting Astonishing Price Targets

    Despite a recent pullback from its mid-August peak, Ripple’s cross-border token, XRP, has demonstrated resilience, remaining up 40% from multi-year lows established less than a month ago. This upward momentum has fueled significant optimism among analysts, with some projecting exceptionally high future price points.

    A Shift in Analyst Sentiment

    While market observers like EGRAG CRYPTO have consistently expressed bullish views on XRP, the recent price target set by analyst Ali Martinez has captured the community’s attention. Martinez believes XRP has already reached its cycle bottom and is now on a recovery trajectory. Previously, he had indicated a more conservative target of $1.70, a level XRP briefly touched on August 21-22 following a rapid 70% surge in under 72 hours.

    However, XRP experienced a sharp rejection at that mark, falling below $1.35 last week. Its subsequent ability to stabilize above this level and rebound to the current $1.40 has reignited bullish sentiment, with Martinez now joining the chorus of optimistic forecasts.

    The $60 XRP Prediction

    In a recent post to his 166,000 followers, Martinez highlighted that XRP has been “forming a massive ascending triangle on the monthly chart.” He posited that a breakout above the key resistance level of $3.66, with a monthly close above it, would confirm this pattern and activate a technical target of approximately $60 per XRP.

    This ambitious prediction, if realized, would represent a nearly 4,200% increase from current levels, even over a decade. Such a valuation would propel XRP’s market capitalization to around $4 trillion, surpassing current market leaders like Bitcoin and even tech giants such as Amazon and Microsoft, assuming XRP’s supply remains constant, which is not the case.

    More Grounded, Yet Still Bullish, Forecasts

    While Martinez’s $60 target stands out, other analysts, including EGRAG CRYPTO, have also issued highly optimistic, albeit less extreme, predictions. Drawing on XRP’s historical performance, which has seen rallies of up to 2,400%, EGRAG CRYPTO outlined significant targets in a September 5 analysis. The most ambitious of these, mirroring XRP’s 2017-2018 bull phase, projects a potential price of $25. Slightly more conservative targets were set between $11 and $15.8.

    Although these figures may seem ambitious given the current market conditions, the significant shift in market structure over recent weeks lends some credence to the underlying bullish sentiment.

  • XRP Defends $1.40 Support; Analyst EGRAG CRYPTO Predicts Potential 100% Rally Contingent on Resistance Breach

    XRP Defends $1.40 Support; Analyst EGRAG CRYPTO Predicts Potential 100% Rally Contingent on Resistance Breach

    XRP is currently defending a crucial support level at $1.40, following a recent correction that saw its price dip below $1.35. This defense of the support level comes as analyst EGRAG CRYPTO has projected a potential 100% rally for XRP, targeting a price of $2.70.

    The price action in late August saw XRP recover from a pullback that moved it from $1.70 to $1.33 within a little over a week. The asset has since managed to stabilize above the $1.40 mark. This recovery has coincided with a significant increase in trading activity across major exchanges, with spot trading volumes reaching their highest levels since February during late August. Binance reported nearly $7.3 billion in XRP spot trades, followed by Upbit with $4.7 billion and Bithumb with $2.6 billion.

    Analyst EGRAG CRYPTO suggests that XRP is attempting to establish a bullish continuation pattern. According to EGRAG CRYPTO, if XRP successfully overcomes key resistance levels, it could potentially reach $2.70, which would represent a 100% increase from recent lows. However, this outlook is contingent on XRP breaching several resistance barriers. The first significant resistance is noted at $1.50, with a subsequent level at $1.60. A decisive daily close above both these levels would be necessary for XRP to target a psychological price of $2.00.

    Should XRP fail to break through these resistance levels, it may fall back to the $1.25-$1.30 support range, which has been tested successfully in the recent past. The analyst’s prediction of a $2.70 target is presented as a possibility rather than a certainty, with EGRAG CRYPTO acknowledging that demand remains present despite previous rejections at the $1.70 level.

    Further supporting the notion of growing demand are recent trends in ETF inflows. Financial products related to XRP experienced their best week of 2026 at the end of August, attracting over $110 million. This contributed to cumulative net inflows reaching a new all-time high of $1.66 billion. While the pace of inflows may have cooled in the past week, these funds have consistently closed in the green for the preceding two months. Additionally, reports indicate that large holders, often referred to as Ripple whales, have been actively accumulating XRP.

    Despite these positive indicators, significant uncertainties remain. The ability of buyers to reclaim and hold above the resistance areas that have previously capped XRP’s upward movements is a key factor. The realization of EGRAG CRYPTO’s $2.70 price target is dependent on overcoming these technical hurdles. While the current defense of the $1.40 support level and increased market activity are encouraging signs, the path forward for XRP is not guaranteed and remains subject to market dynamics and the successful breach of critical resistance points.

    Why This Matters

    The current price action shows XRP defending a support level at $1.40. The potential for a significant rally exists, but it is contingent on overcoming key resistance levels, as highlighted by analyst EGRAG CRYPTO’s prediction. The outcome remains uncertain and dependent on market dynamics.

    Broader Context

    Source materials place the factual news in this context: The price rally initiated by the cross-border token in mid-August was halted at $1.70, and the subsequent correction drove it south hard to under $1.35. XRP has since managed to rebound and is now sitting above a key support level at $1.40.