Tag: Market Trends

  • Multicoin Dumps 10% of HYPE Holdings

    Multicoin Dumps 10% of HYPE Holdings

    Multicoin Capital has divested another 10% of its holdings in the HYPE token, according to data from blockchain analytics firm Arkham Intelligence. Despite this sale, HYPE remains the investment firm’s largest position, currently valued at approximately $90.5 million.

    Multicoin Capital had amassed these tokens between February and March of this year and had maintained the position for over six months. At its peak, the firm held 4 million HYPE tokens, but now possesses just over a quarter of that amount, Arkham reported. Earlier this week, Multicoin transferred a significant portion of its HYPE holdings to Coinbase Prime. On-chain data revealed three separate transactions totaling 261,555 HYPE, with an estimated value of $21.7 million. These transfers, comprising batches of 63,235, 101,144, and 97,176 units, attracted attention as they occurred while the cryptocurrency was trading near its recent peak prices.

    In June, Multicoin had projected that HYPE could reach $319. This target was derived from valuing an anticipated $8 billion in 2028 earnings at 20 times, leading to a $160 billion valuation based on an adjusted supply of approximately 502 million HYPE tokens. The firm’s base case scenario assumes annual growth of 35% in crypto derivatives volume, with decentralized exchanges (DEXs) capturing 32% of that market, Hyperliquid securing a 30% share, and USDC balances increasing in line with volume.

    Conversely, Multicoin’s bear case scenario places HYPE at $109, while its bull case forecasts a price of $689, based on projected cash flow of $17.3 billion. In the same report, Multicoin also drew parallels between Hyperliquid’s growth trajectory and the rapid ascent of Binance in 2017.

    HYPE has emerged as one of the year’s top-performing assets, experiencing a remarkable surge. The token has gained 50% in the past month alone and recently achieved an all-time high of $86.71. While it has since experienced a minor correction, it continues to trade above the $82 mark.

    Regulatory Developments

    Hyperliquid also featured in discussions during a meeting between former President Donald Trump and major cryptocurrency executives at the White House last month. Trump indicated that CFTC Chair Michael Selig is working to bring the perpetuals-focused trading platform into the United States, with the objective of ensuring Hyperliquid operates in a “fully compliant and legal fashion.” The meeting also addressed topics such as Bitcoin, the Digital Asset Market Clarity Act, and broader efforts to expand crypto activity within the U.S.

    Market Sentiment and Trading Strategies

    While the overall market outlook for HYPE remains bullish, one trader has positioned for a potential decline. The pseudonymous market observer known as “swarmik” expressed a bearish sentiment, suggesting the token could drop 17.2% based on analysis of a four-hour chart, citing signs of weakness in the market structure. The trader believes significant selling liquidity could drive the price lower.

    However, a potential correction could also present an opportunity for a short position, with three downside targets identified at $76.77, $72.68, and $68.49. This trade would carry a risk-reward ratio of 1.5R, according to the analysis.

  • Wealth Managers Eye XRP Amid Growing Interest

    Wealth Managers Eye XRP Amid Growing Interest

    XRP Price Sees Modest Gain Amidst Growing Wealth Manager Interest

    XRP experienced a 4% price increase today, trading at $1.38 after dipping to a low of $1.3409. While the price movement itself is notable, the underlying sentiment driving it appears even more significant. Ryan Rasmussen, a research analyst at Bitwise, revealed this week that XRP generated more inquiries than any other cryptocurrency during a presentation that also featured Bitcoin, Solana, Hyperliquid, stablecoins, and tokenization.

    Rasmussen described the level of interest as “a lot” in a post-event social media thread, stating that XRP was the most discussed digital asset throughout the presentation.

    Investor Sentiment and Allocation Plans

    A concurrent poll of the audience, comprising approximately 400 wealth managers, indicated that 67% currently hold no cryptocurrency allocation. However, a substantial 60% anticipate higher prices by the end of 2026 and plan to make allocations within the next year, highlighting a considerable gap between sentiment and concrete action.

    This poll lends anecdotal support to the growing case that XRP is transitioning from a retail speculative asset to a component of regulated portfolio exposure, a trend already suggested by ETF inflow data.

    Technical Outlook for XRP

    XRP’s chart has been consolidating within a descending triangle pattern since a surge to approximately $1.70 in August. The $1.35–$1.38 zone is currently acting as a key demand area, with historically elevated trading volume in this band, which technical analysts interpret as a significant market decision point. The 200-day exponential moving average (EMA) is situated nearby, reinforcing $1.33–$1.35 as a critical structural support level.

    A successful reclaim of the $1.55–$1.60 range could pave the way for a move towards the $1.68–$1.72 swing-high liquidity zone. Further upside targets include $1.86 and the psychological level of $2.00, contingent on wealth manager allocations translating into actual inflows, as suggested by recent institutional accumulation data.

    The cryptocurrency is expected to continue consolidating between $1.35 and $1.55 as the market awaits confirmation that the stated 60% allocation intentions materialize into actual purchases. A breach below $1.33 would invalidate the current triangle pattern, potentially leading to a retest of the $1.23–$1.25 support, with a deeper floor at $1.15–$1.20.

    Institutional Adoption and Investment Horizons

    XRP’s current setup aligns with the institutional adoption thesis. However, with a market capitalization exceeding $80 billion, the asset is not positioned for explosive, life-changing returns. A move from $1.38 to $2.00, for instance, represents a respectable but not transformative 45% gain. Investors seeking greater upside potential are increasingly exploring earlier-stage opportunities, such as infrastructure projects currently in their presale phases.

    Bitcoin Hyper: A New Layer 2 Solution

    Bitcoin Hyper is positioning itself as the first Bitcoin Layer 2 solution with native Solana Virtual Machine (SVM) integration. This combination aims to achieve faster smart contract execution than Solana itself while leveraging Bitcoin’s inherent security. The project has raised $33 million to date, with tokens priced at $0.0136856. A staking program offers presale buyers an Annual Percentage Yield (APY) of 35%. Bitcoin Hyper’s approach to Layer 2 technology is considered innovative, particularly its Decentralized Canonical Bridge, which addresses the low-latency Bitcoin transfer challenge that has historically limited its programmability. Investors are encouraged to research Bitcoin Hyper directly before the presale concludes.

  • Cryptocurrency Prices Surge, Triggering Over $400 Million in Liquidations

    Cryptocurrency Prices Surge, Triggering Over $400 Million in Liquidations

    Major cryptocurrencies, including Bitcoin, Ethereum, and XRP, experienced a significant price surge in recent hours, leading to substantial liquidations of short positions across the market. Data indicates that over $400 million in total liquidations occurred within the past 24 hours, with a notable portion of this stemming from short positions.

    Market Surge and Liquidation Overview

    Bitcoin, after a period of suppressed price action, broke past the $80,000 mark, a level not seen in the past week. This upward movement followed a dip to a 10-day low of $76,200 just 24 hours prior, a time when the cryptocurrency struggled to maintain the $77,000 support amid escalating geopolitical tensions. Last Friday, Bitcoin had reportedly been rejected and driven south to $77,000 after a speech by Kevin Warsh at Jackson Hole.

    The recent surge saw Bitcoin reclaim and surpass previous resistance levels, reaching $77,000, $78,000, and ultimately $80,000 in the past few hours. This rally has been accompanied by significant gains in other major altcoins.

    Asset-Specific Performance

    Ethereum (ETH) saw a notable increase, rising to nearly $2,500. In the past 60 minutes alone, ETH experienced a 2.6% surge, contributing to a 4.4% gain over the past 24 hours. BNB also saw a substantial rise, moving past $720. XRP recorded a 9% increase on a daily scale, with a 4.3% gain in the past hour.

    Trader Impact and Data Attribution

    The rapid price movements resulted in significant financial consequences for traders with leveraged positions. Within the past few hours, over $140 million in short positions were liquidated. Data from CoinGlass shows that hourly wrecked positions reached $157 million, with shorts accounting for $142 million of that amount. Over the past 24 hours, total liquidations exceeded $400 million, with shorts making up $315 million of the total. Nearly 110,000 traders were affected by these liquidations in the past day.

    The single-largest liquidation recorded occurred on Binance, amounting to over $5.2 million. This event highlights the volatility inherent in the cryptocurrency market and the risks associated with overleveraged trading.

    Context and Uncertainty

    While the price surge and subsequent liquidations are significant market events, the exact causes beyond general market movement and previous geopolitical tensions remain subjects of observation. The specific impact of Kevin Warsh’s speech on Bitcoin’s price last Friday also remains a point of context rather than a direct causal factor for the current surge.

    The market’s recent performance, characterized by suppressed prices followed by a sharp uptick, suggests a period of renewed momentum. However, this event, as reported, does not definitively indicate a sustained market trend or predict future price movements. The focus remains on the factual reporting of price action and liquidation data.

    Why This Matters

    The materials describe a narrow update: Following a period of suppressed price action, Bitcoin surged past $80,000, with many altcoins like Ethereum and XRP also experiencing significant gains. The exact cause of the sudden price surge beyond general market movement and previous geopolitical tensions.

    Broader Context

    Source materials place the factual news in this context: After a few days of suppressed price action, the crypto market is on the move again, with bitcoin leading the pack with a surge past $80,000 for the first time in a week.

  • Cardano, Sui Flash Buy Signals: Next Targets Revealed

    Cardano, Sui Flash Buy Signals: Next Targets Revealed

    Crypto Market Shows Signs of Life, ADA and SUI Lead Gains

    The cryptocurrency market has experienced a modest rebound over the past 24 hours, with Cardano’s ADA and the newly launched SUI token emerging as top performers. Several indicators suggest this upward trend may be in its nascent stages, coinciding with a recent surge in bullish sentiment among market analysts.

    Cardano’s native token, ADA, has seen a significant daily increase of 6%, successfully reclaiming the crucial $0.20 psychological level. Adding to the positive outlook, prominent analyst Ali Martinez highlighted that ADA’s Tom DeMark Sequential (TDS) indicator has generated a buy signal. Martinez noted that historically, such signals have preceded price bottoms and have been followed by substantial double-digit gains. “Now the indicator is signaling another rebound for ADA could be underway,” Martinez stated.

    Further bolstering the bullish narrative is the recent trend in exchange net flows. Data indicates that for several consecutive days, outflows from exchanges have surpassed inflows. This suggests a shift in investor behavior, with a move towards self-custody away from centralized platforms, potentially reducing immediate selling pressure.

    On social media platform X, user Sjuul | AltCryptoGems expressed surprise at ADA’s performance this cycle, observing “very strong higher highs, one after the other in a perfectly bullish fashion.” The user added, “Probably not a coin I would fade in the coming months.”

    Another X user, The Moon Show, commented that ADA “survived the deep retrace.” This user believes that a decisive move above the $0.205 level would signal a “much more serious” recovery.

    SUI Joins ADA in Bullish Momentum

    Meanwhile, SUI is trading at approximately $0.76, marking a 7% increase for the day. Similar to ADA, the SUI token appears poised for further gains, according to insights from Ali Martinez. He reported that SUI’s TDS indicator has also flashed a buy signal on its daily chart, suggesting that the recent price correction may be nearing its conclusion. “This indicator points to a potential 1–4 daily candlestick rebound or the beginning of a new bullish countdown. I’m watching for the rally to begin,” Martinez commented.

    Other notable analysts have also weighed in on SUI’s potential. Michael van de Poppe observed that SUI has outperformed Bitcoin, opining that “the uptrend has started.” Separately, Celal Kucuker suggested that SUI “is making a move,” forecasting a potential price surge to as high as $10 in a bull market scenario. Kucuker also hinted that September could be a favorable month for SUI, based on observed “OTC flows.”

  • XRP Consolidating Near $1.40, Approaching Technical Decision Point Amid Uncertainty

    XRP Consolidating Near $1.40, Approaching Technical Decision Point Amid Uncertainty

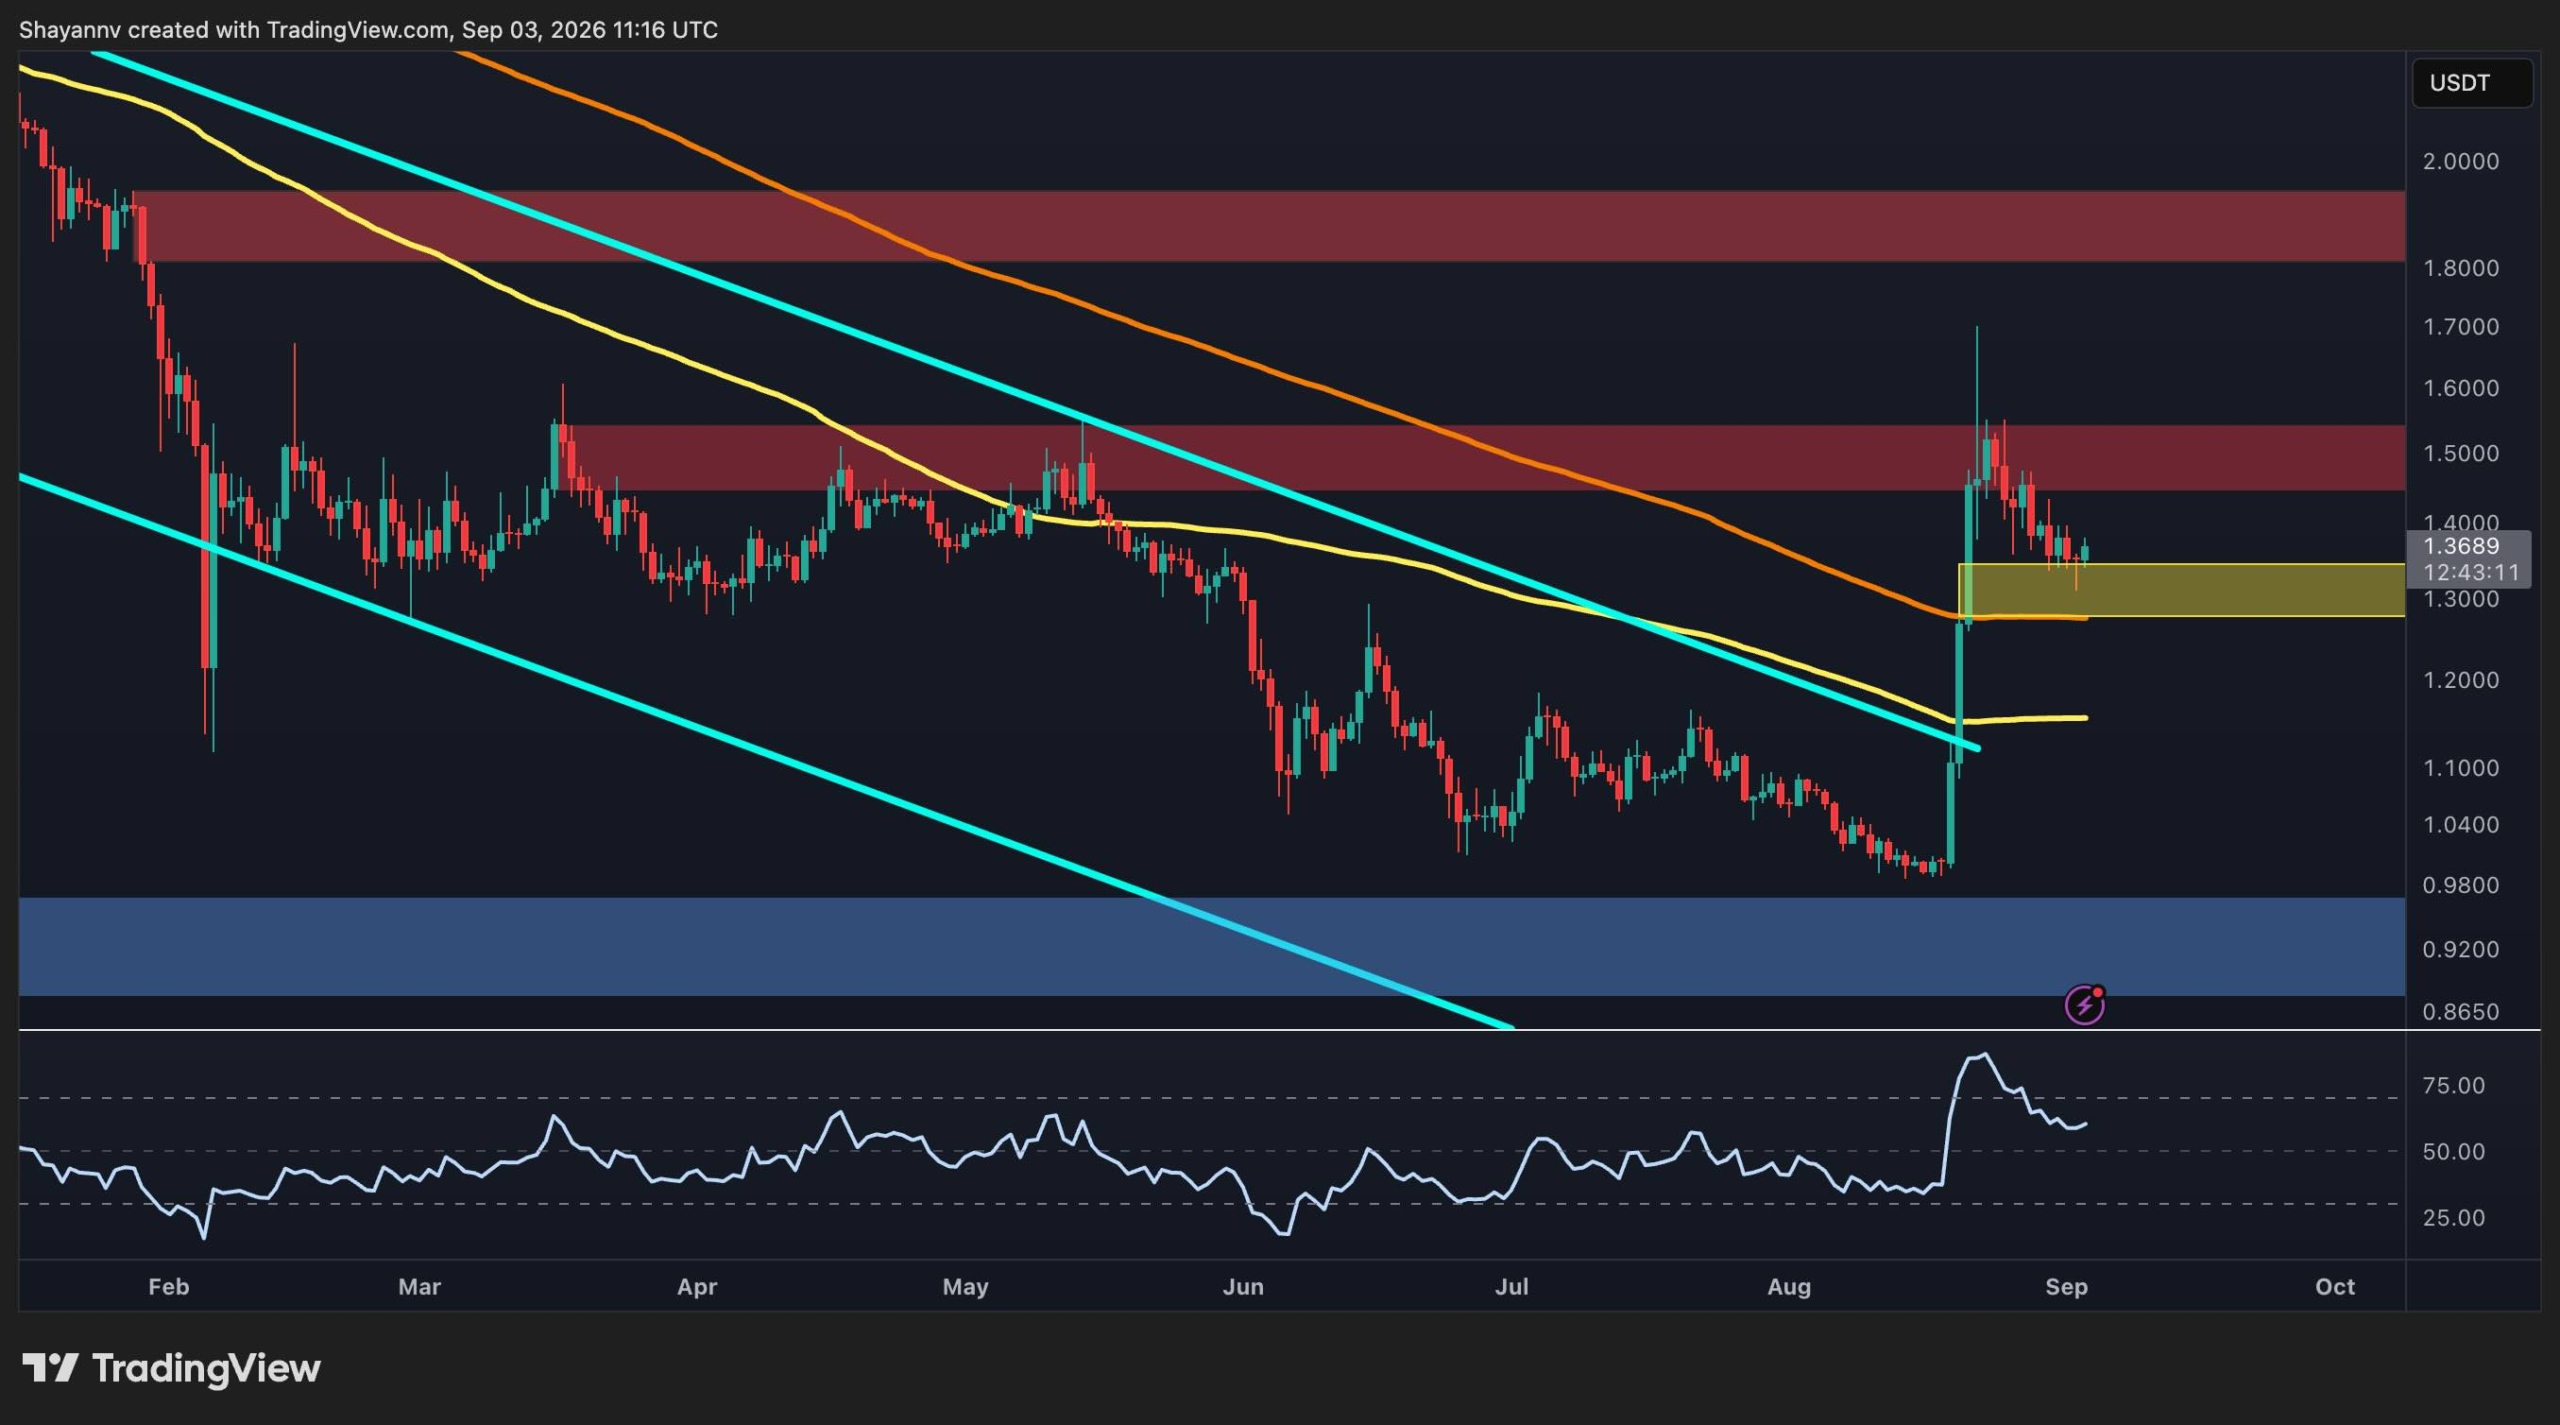
    XRP is currently consolidating near the $1.40 mark, a technical decision point following a notable move in late August. The cryptocurrency is testing key support and resistance levels, with its price action forming a descending structure that signals potential future direction, though the outcome remains uncertain.

    Following a sharp surge from approximately $1.00 to a spike near $1.70 in late August, XRP has entered a consolidation phase. According to the analysis, the broader market structure has improved considerably, yet the token remains beneath a major resistance zone. The current price action is being observed within a descending structure, defined by two downward-sloping trendlines on the 4-hour chart. This pattern indicates that a decisive move is on the horizon, which could determine whether the recent rally resumes or transitions into a deeper retracement.

    Key Technical Levels and Support

    The charts suggest that XRP has pulled back toward the $1.30 area, identified as an important demand zone and a clear bullish imbalance area. Importantly, XRP remains above both the 100-day and 200-day moving averages. The analysis indicates that this sustained position above key moving averages suggests the broader recovery structure is still intact, despite the recent correction.

    Resistance and Potential Upside

    The $1.5 region represents the primary resistance zone above the current price. This area has previously acted as a significant supply zone and has rejected XRP’s price multiple times. The analysis indicates that a daily close above this $1.50 level would strengthen the bullish case and could potentially lead toward the $2 region, an important psychological barrier for Ripple.

    Support and Potential Downside

    On the downside, the immediate support region is identified as the $1.25 bullish order block. As long as XRP continues to hold this zone, the descending structure could eventually resolve to the upside. However, a notable move below the $1.25 area would increase the probability of a deeper retracement toward a lower order block around $1.10. The analysis indicates that losing the $1.25 area would invalidate the immediate bullish setup and could send the price back toward the base of the recent rally.

    Momentum and Outlook

    The momentum picture has also cooled substantially from the extreme levels reached during the initial notable move. The daily Relative Strength Index (RSI) has fallen below 75, relieving overbought conditions while remaining above the neutral 50 area. This cooling of momentum is generally viewed as constructive, as XRP has been able to consolidate without a complete loss of its recent price movement.

    Overall, XRP is approaching a decision point. The analysis indicates that holding the $1.25 support and breaking above the descending trendline would favor a continuation of the rally above $1.50. Conversely, a failure to hold the $1.25 area would invalidate the immediate bullish setup. The outcome of this consolidation phase will be crucial in determining XRP’s short-to-medium term price action.

    Why This Matters

    The analysis focuses on XRP’s current price action and its critical technical juncture. The materials describe a narrow update: XRP experienced a significant notable move in late August, moving from around $1.00 to a spike near $1.70, and is now consolidating near $1.40. Whether the recent rally will resume or develop into a deeper retracement remains uncertain.

    Broader Context

    Source materials place the market analysis in this context: XRP is consolidating after its sharp late-August notable move, with the price now hovering close to $1.40. The analysis highlights key support around $1.25 and resistance near $1.50, with the price currently within a descending structure. The outcome hinges on whether it can overcome resistance or break down below support.

  • Cardano’s ADA Token Sees Modest Price Surge After Listing on Japan’s S.BLOX Exchange

    Cardano’s ADA Token Sees Modest Price Surge After Listing on Japan’s S.BLOX Exchange

    Cardano’s native token, ADA, experienced a price increase of approximately 5% over a 24-hour period following its listing on S.BLOX, a Japanese cryptocurrency exchange. The exchange, which is registered with local financial bureaus and linked to the Sony Group through a subsidiary, also listed Midnight’s NIGHT token. This development provides a regulated yen on-ramp for Japanese retail investors.

    S.BLOX added both ADA and the NIGHT token to its platform on August 24. Operating under the registration of Japan’s Kanto and Kinki Local Finance Bureaus, the exchange adheres to the country’s stringent regulatory framework for digital assets. The connection to Sony Group is through a subsidiary, and does not represent a direct partnership or integration with the broader Sony conglomerate.

    Promotional incentives for eligible users related to these listings ran through August 30, offering up to 10,000 yen (approximately $63 USD) for ADA and up to 14,000 yen (approximately $88 USD) for NIGHT token. The listing of the NIGHT token was reported as the first instance of a Japan-registered exchange supporting Midnight’s native token.

    Market Reaction and Historical Context

    In the immediate aftermath of the listing, ADA saw a price surge of about 5% within 24 hours, while the broader cryptocurrency market remained largely flat or experienced declines. This price action occurred despite ADA experiencing an 8.9% decline in the week following the August 24 news. At the time of reporting, ADA was trading around $0.205.

    Cardano founder Charles Hoskinson acknowledged the significance of the listing. However, the practical implications of such listings are often viewed as distribution wins rather than direct demand events, though demand has been observed. The listing suggests that ADA and NIGHT token have passed the compliance filters of a rigorous exchange licensing regime, signaling regulatory standing.

    This event is contextualized within Japan’s maturing stablecoin and digital-asset infrastructure, fitting into a broader regulatory expansion rather than a Cardano-specific breakout. Historically, Cardano has seen numerous announcements, including enterprise-adjacent headlines and integration pilots, that generated attention but did not lead to sustained price increases. ADA traded above $2.50 in late 2021, representing a decline of over 90% from its peak, despite a stream of milestone announcements since then. The token currently sits near $0.20.

    Uncertainties Remain

    There remains uncertainty regarding whether the regulated exchange listing was followed by the price surge or if other factors were involved. The long-term impact of the listing on ADA’s demand and price action is yet to be determined. It is also unclear to what extent this listing signifies a broader trend for Japanese crypto infrastructure or a Cardano-specific development. It is important to note that this listing does not indicate a partnership, product integration, or infrastructure deal with Sony Group.

    Broader Context

    Source materials place the factual news in this context: Japan’s stablecoin and digital-asset infrastructure has been maturing on its own track, and this listing fits that broader regulatory expansion rather than a Cardano-specific breakout.

  • Bitcoin Recovers from $76K, Faces $80K Resistance

    Bitcoin Recovers from $76K, Faces $80K Resistance

    Bitcoin Holds Above $78,000 Amidst Cautious Recovery, Key Resistance Looms

    Bitcoin is currently trading above the $78,000 mark, having staged a significant recovery from the $60,000 level. However, recent price action suggests that buyers have yet to achieve a decisive breakout above key resistance levels. Simultaneously, a notable increase in the exchange whale ratio is signaling potential bearish pressure from the supply side, contrasting with an otherwise constructive technical outlook.

    Daily Chart Analysis

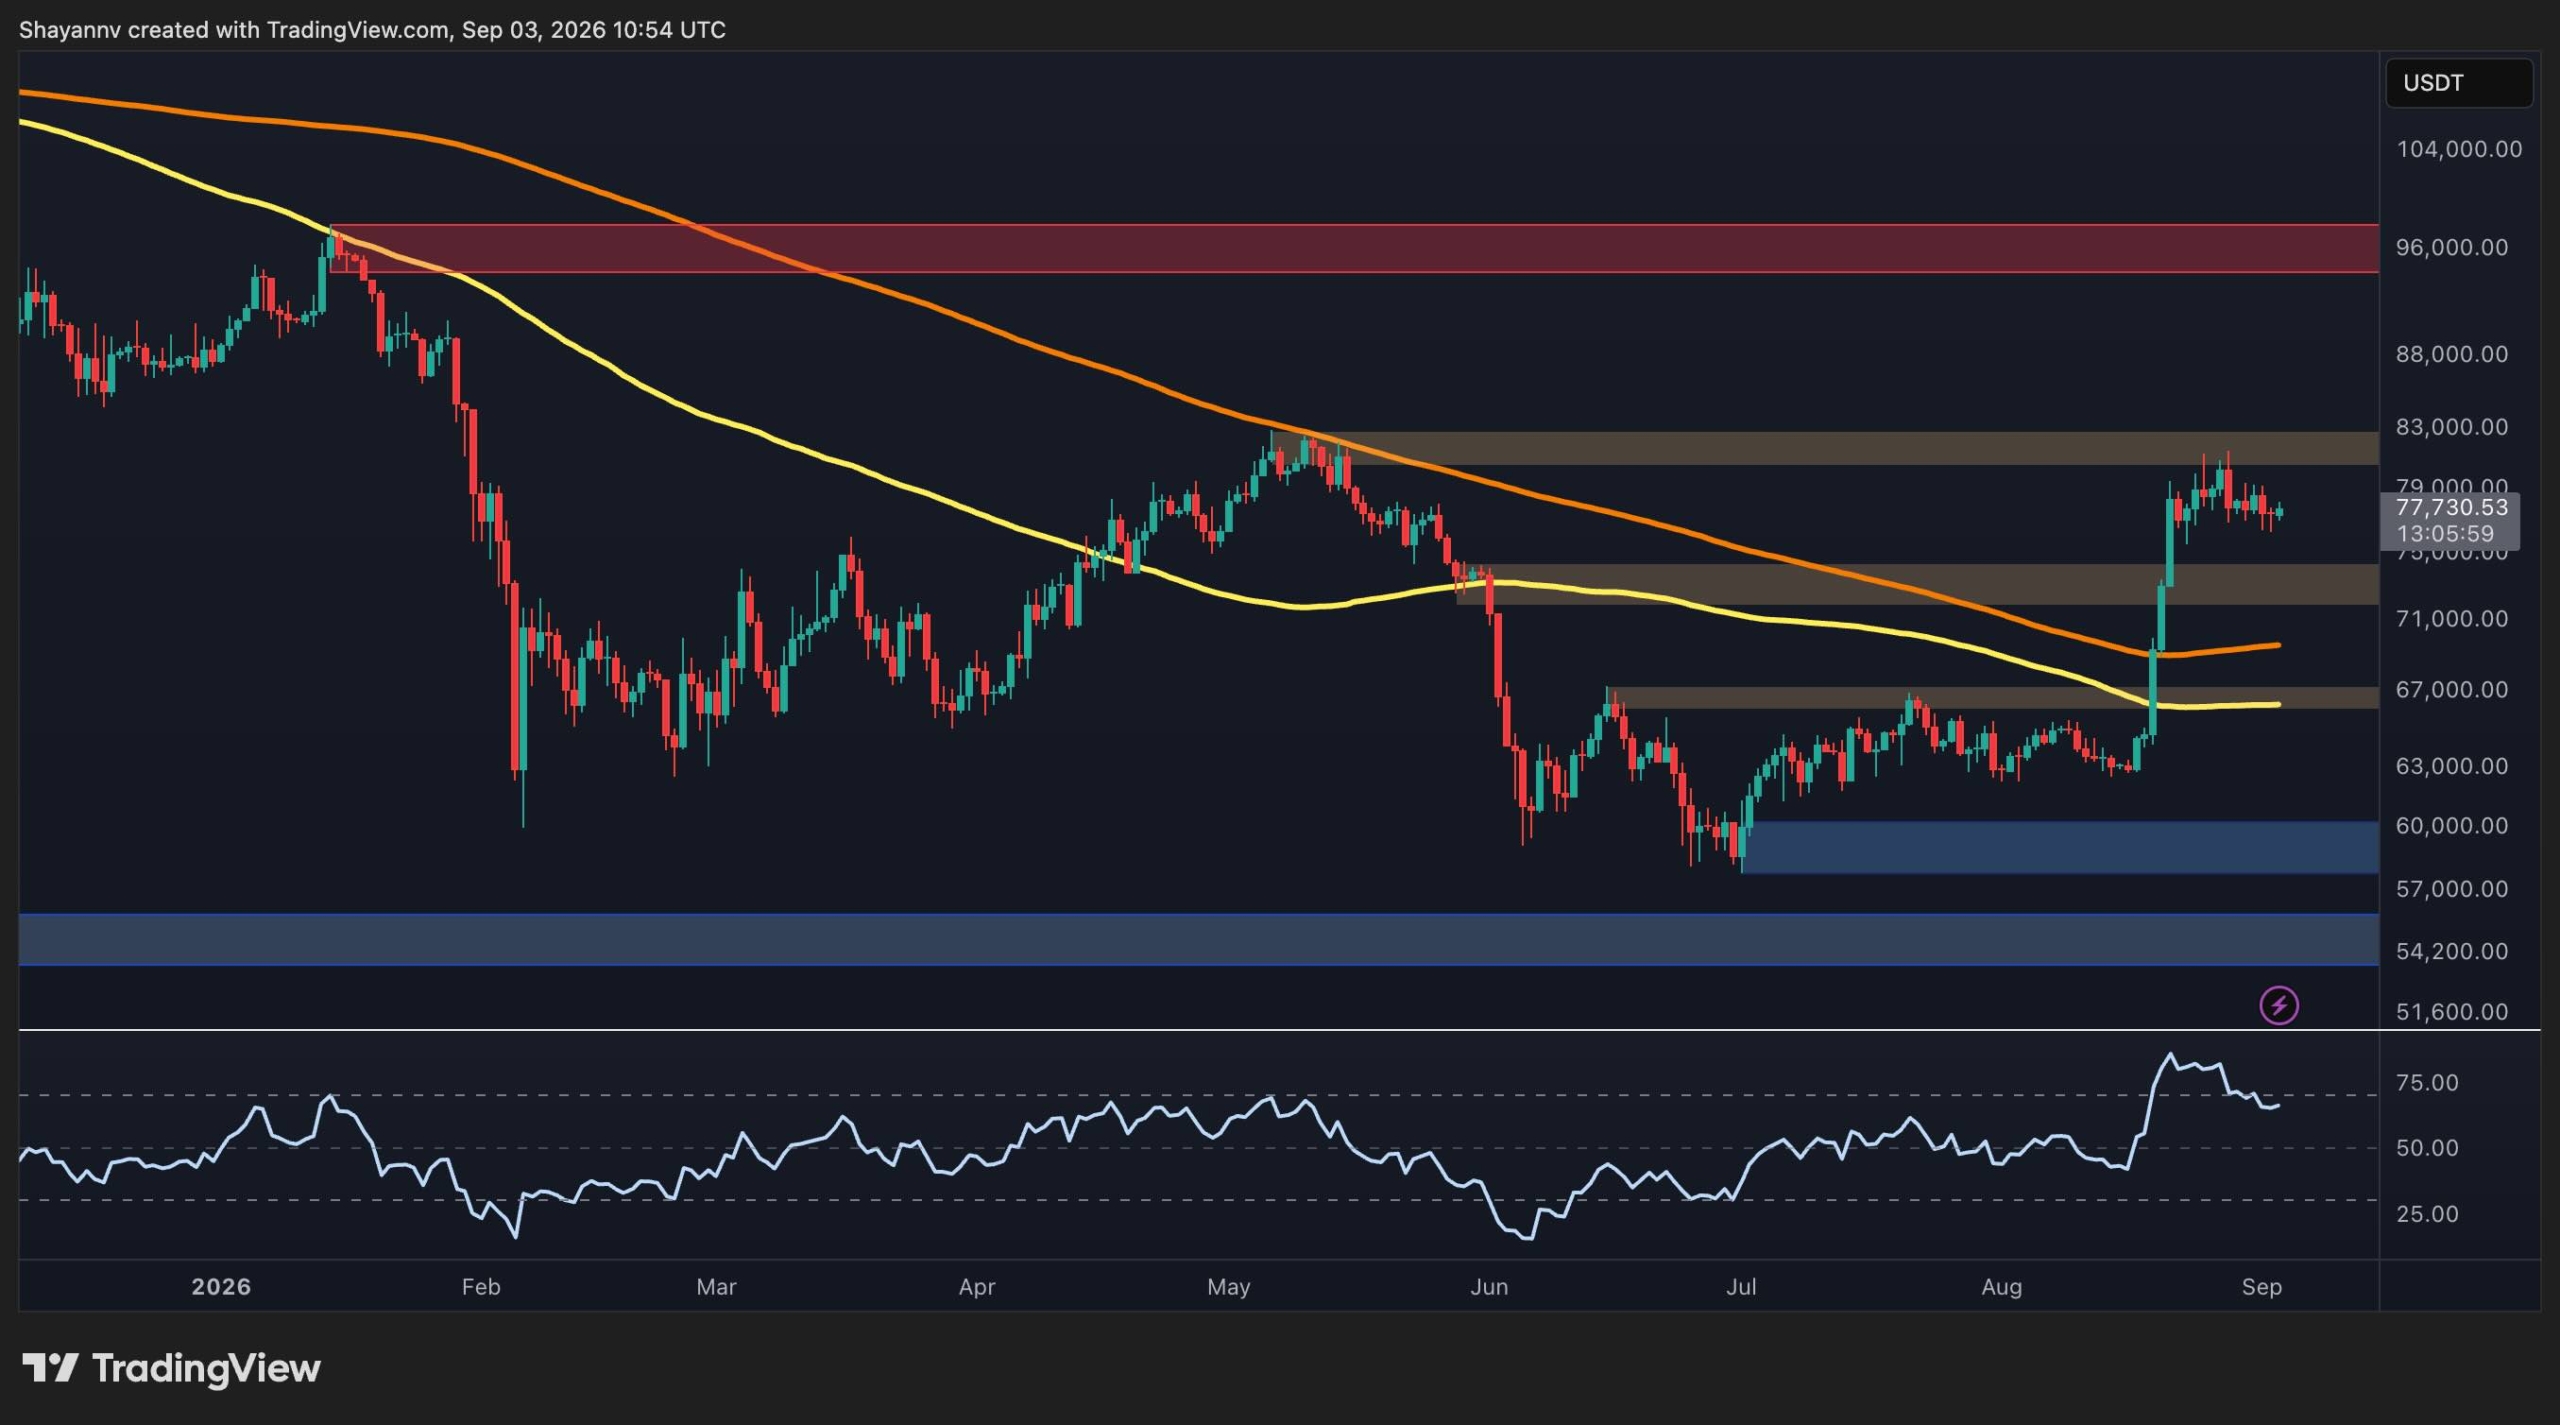
    The daily chart reveals a substantial structural improvement following the rebound from the $60,000 support zone. Bitcoin (BTC) has successfully broken above the $67,000 area and subsequently reclaimed the $72,000 zone, which had previously acted as a resistance barrier. The cryptocurrency is now trading around $78,500, comfortably positioned above both major moving averages depicted on the chart.

    The immediate challenge for buyers lies at the $82,000 resistance zone. This area aligns with recent swing highs, presenting a significant hurdle. A daily close above this level would bolster the recovery structure by establishing a higher high after months of a downtrend, potentially paving the way for a move towards the $95,600 resistance region.

    Momentum indicators have also shown considerable improvement. The daily Relative Strength Index (RSI) has climbed from oversold territory during the June lows and is now approaching overbought conditions. However, the RSI has begun to trend lower after reaching elevated levels, suggesting a cooling of momentum rather than an acceleration.

    On the downside, the $72,000 zone represents the first major support level to monitor. Holding above this level would preserve the broader recovery trend, while a more significant correction could bring the $67,000 region back into focus.

    Therefore, the daily structure remains cautiously constructive. However, Bitcoin needs to overcome the $82,000 resistance to confirm that the recent recovery is evolving into a sustained bullish continuation, rather than another rejection from a key resistance point.

    Four-Hour Chart Perspective

    The four-hour chart presents a more cautious outlook. Since reaching the $82,000 area in late August, BTC has been consolidating within a structure resembling a falling wedge. The upper trendline of this formation has repeatedly capped upward advances, while the lower boundary is currently situated around $76,000.

    Bitcoin is presently testing the upper boundary of this structure once again. A successful breakout above this resistance line, which is currently near the $78,000 mark and trending downwards, would be the initial indication of buyers attempting to regain short-term control.

    A potential breakout could lead to another push towards the $82,000 area, which, as previously noted, stands as the most critical resistance level on the daily timeframe.

    Conversely, a failure to break out of the wedge and a subsequent move below $76,000 could trigger a deeper correction towards the $72,000-$74,000 area, which has transitioned into support after being previously breached to the upside. Maintaining this zone would be crucial for sustaining the recovery, as a breakdown could negate the positive price action observed by Bitcoin over the past few weeks.

    Exchange Whale Ratio Signals Caution

    The exchange whale ratio measures the proportion of exchange inflows associated with the largest transactions, offering insight into whether large holders are becoming more active in sending Bitcoin to exchanges. A rising ratio can indicate increased potential selling pressure, though it does not necessarily imply immediate selling by whales.

    The chart illustrates a sharp increase in the 30-day moving average of Bitcoin’s exchange whale ratio during the latest price recovery. This ratio has moved back towards the 0.32 area, nearing its highest visible levels on the chart, while BTC trades around $78,500.

    This development warrants close observation. While Bitcoin has recovered substantially from its June lows, the escalating whale ratio suggests that large transactions directed towards exchanges have also become more prominent. This could potentially shift the supply and demand balance in favor of sellers. If this elevated reading persists while Bitcoin struggles to break above the $80,000-$82,000 area, it could reinforce the likelihood of a rejection or consolidation.

    On the other hand, a decisive breakout above $82,000, coupled with a subsequent decline in the whale ratio, would offer more constructive confirmation. This would suggest that increased whale activity is not translating into significant distribution and that sufficient fresh demand exists to absorb any potential selling by large holders.

  • Binance-Backed Altcoin Joins Crypto Top 100

    Binance-Backed Altcoin Joins Crypto Top 100

    Viral Altcoin Joins Crypto’s Top 100 After Binance Listing

    PONS, a relatively new altcoin that launched this summer, has reached a new all-time high and secured a spot among the 100 largest cryptocurrencies by market capitalization. The token’s recent surge has been fueled by a significant listing and optimistic future predictions.

    The cryptocurrency market frequently witnesses tokens that capture attention with rapid price appreciation. PONS, which is linked to Robinhood Chain and began trading in mid-July, is the latest example. In the past two weeks alone, its valuation has surged by nearly 1,300%, reaching a record high of approximately $0.55, according to CoinMarketCap. With a market capitalization of around $395 million, PONS now ranks as the 98th-largest cryptocurrency.

    The most recent upward momentum appears to have been driven by Binance, which included the token in its Binance Alpha section. This platform is designed to highlight emerging cryptocurrencies in their early stages, prior to potential official endorsement.

    The token’s remarkable performance has garnered significant attention within the industry. Crypto Tony, a prominent figure on X (formerly Twitter), expressed confidence that PONS “will no doubt” reach a $1 billion market capitalization “soon.”

    However, not all investors have profited from PONS. As previously reported, an anonymous individual acquired nearly 8 million PONS tokens approximately a month ago for about $443,000. Shortly after, the token experienced a price dip, prompting the investor to sell their entire holdings to limit losses, resulting in a $308,000 deficit. This decision proved to be ill-timed, as the same stash of tokens is now valued at over $4 million.

    As of September 3, PONS is not only a top performer but also the number-one trending cryptocurrency according to CoinGecko. It has outperformed well-known altcoins such as Arbitrum (ARB), Uniswap (UNI), and Hyperliquid (HYPE), while major cryptocurrencies like Bitcoin (BTC) and Ethereum (ETH) have not appeared in the top 10 trending list.

  • XRP Surges Past $2 on $474 Million ETF Inflows

    XRP Surges Past $2 on $474 Million ETF Inflows

    XRP Eyes $2 Mark Amidst ETF Inflows and Shifting Market Dynamics

    The prospect of XRP reaching the $2 mark is once again circulating within the crypto community. While some may dismiss this as mere speculation, a closer examination of the current market setup reveals the underlying drivers and the conditions necessary for such a surge. The focus, however, is not solely on short-term price models.

    An AI-driven simulation, analyzing 2,000 potential paths, projects a bullish 90-day scenario for XRP at $2.14, representing a 59% increase from its reference close of $1.35. The median outcome, however, suggests a more conservative price of $1.47. This optimistic outlook is largely predicated on sustained spot ETF inflows for six consecutive months.

    Data from SoSoValue indicates that U.S. XRP ETFs have attracted $474 million in inflows over the past quarter. Ripple itself has reported cumulative ETF inflows exceeding $1.5 billion, with over 769 million XRP tokens currently held in custody across five such funds.

    While these figures alone may not propel XRP to $2 or even $10, they signal a significant shift in the asset’s liquidity profile over the long term, driven by sustained institutional demand. This evolving landscape is crucial in distinguishing between short-term technical trading ranges and the potential for a long-term bullish trend.

    XRP is currently consolidating within the $1.36–$1.37 range, following a substantial rally in August that saw its price climb from approximately $0.99 to $1.70. This upward movement generated significant trading volume, with 3.2 billion tokens traded within the $1.35–$1.38 band, which has now emerged as the token’s most robust support level.

    A daily close below $1.35 could trigger a decline towards $1.20. Conversely, a sustained close above $1.55–$1.68 might pave the way for a move towards $1.86–$1.90, ultimately challenging the psychologically significant $2.00 level.

    Investors who acquired XRP around the $1.00 mark in early August are currently in a favorable position. However, with the asset’s market capitalization already reflecting expectations of significant institutional adoption, achieving substantial multi-fold returns becomes increasingly challenging. A move to $10, for instance, would require approximately a seven-fold increase from current levels, a feat unlikely to occur without substantial market catalysts.

    The divergence between an asset’s inherent value and its immediate return potential is precisely where discussions around new presale opportunities often arise. The dynamics of momentum plays in the micro-cap space present a different risk-reward profile.

    Maxi Doge Emerges as a New Contender

    Maxi Doge is positioning itself as a novel option for investors seeking significant upside potential. The project features a canine mascot and aims to leverage the energy of high-leverage trading, incorporating holder-only trading competitions with leaderboard rewards and a Maxi Fund to support liquidity and partnerships.

    The $MAXI token is currently priced at $0.0002837, with $4.8 million raised to date. Early holders can benefit from a dynamic staking Annual Percentage Yield (APY). However, the project’s reliance on meme-driven marketing and a high-leverage trading culture may not guarantee sustained traction post-launch. Investors are advised to conduct thorough research on Maxi Doge before its presale concludes.

  • XRP Navigates Technical Uncertainty as Analysts Watch Key Support Levels

    XRP Navigates Technical Uncertainty as Analysts Watch Key Support Levels

    XRP’s price is currently navigating downward pressure, with analysts closely observing critical support levels amidst a technically uncertain environment. The cryptocurrency has recently fallen below a key support level, prompting a reassessment of potential future price movements and the conditions required for a sustained upward trend.

    Analyst’s Perspective on Downside Targets
    According to analyst ChartNerd, XRP’s second consecutive failed weekly close above its 50-week Exponential Moving Average (EMA) suggests room for a deeper slide. This technical indicator, as reported by CryptoPotato, leaves the door open for further declines before a potential rally can resume. The price has recently rejected from $1.43, printing another lower high beneath a bearish trend signal at $1.39.

    ChartNerd has been monitoring XRP’s four-hour structure for weeks, observing a range that formed between resistance at $1.47 and support at $1.36. This support level has now been tested multiple times. The analyst flagged retracement risk the day after the August 22 peak, warning that a weekly close below the 50 EMA would serve as an early indicator for a larger retracement. This scenario has materialized, with two consecutive weekly closes beneath the average and a retreat pegged at approximately 22% from the recent high.

    Key Levels to Watch: Support and Resistance
    The immediate downside target identified by ChartNerd is the weekly 20 EMA, currently situated at $1.27. On the downside, the levels being watched by analysts include $1.30, $1.27, $1.21, and a more significant zone at $0.85. This $0.85 level has been flagged by the analyst as an accumulation zone since June.

    Above the current price, ChartNerd’s resistance ladder begins at $1.40, moving to $1.43, then $1.47, followed by $1.65, $1.82, and potentially $2.40. For a sustained upward trend to resume, XRP would need to overcome these resistance levels and reclaim key moving averages.

    Context and Future Catalysts
    The broader context for XRP’s price action traces back to August 22, when it reached a multi-month high of $1.70. This surge followed a broader market movement triggered by Bitcoin’s ascent from under $65,000 to $80,000. In the three days leading up to the August 22 peak, XRP saw a 70% increase, recovering from an early August dip below $1.00. By the end of August, XRP closed just under $1.40, marking a 30% gain for the month despite the subsequent pullback.

    Despite the current technical challenges, Spot XRP ETFs saw inflows exceeding $110 million last week, indicating continued investor interest. September also presents potential catalysts, including a CLARITY Act vote in the Senate around September 15 and a shareholder vote on Evernorth’s planned Nasdaq listing.

    Navigating Uncertainty
    However, ChartNerd emphasizes that the technical picture remains constrained. Until XRP reclaims and holds key levels, particularly the 50-week EMA, the possibility of further downside remains on the table. The analyst compares the current consolidation to the period that preceded August’s notable move, suggesting that a period of compression may be necessary before a significant upward move can occur. The immediate outlook for XRP remains dependent on its ability to navigate current resistance and hold critical support levels.

    Why This Matters

    XRP has fallen below a key support level after failing to maintain a weekly close above its 50-week Exponential Moving Average (EMA), indicating technical uncertainty and a need to monitor key support levels.