Bitcoin Holds Above $78,000 Amidst Cautious Recovery, Key Resistance Looms
Bitcoin is currently trading above the $78,000 mark, having staged a significant recovery from the $60,000 level. However, recent price action suggests that buyers have yet to achieve a decisive breakout above key resistance levels. Simultaneously, a notable increase in the exchange whale ratio is signaling potential bearish pressure from the supply side, contrasting with an otherwise constructive technical outlook.
Daily Chart Analysis
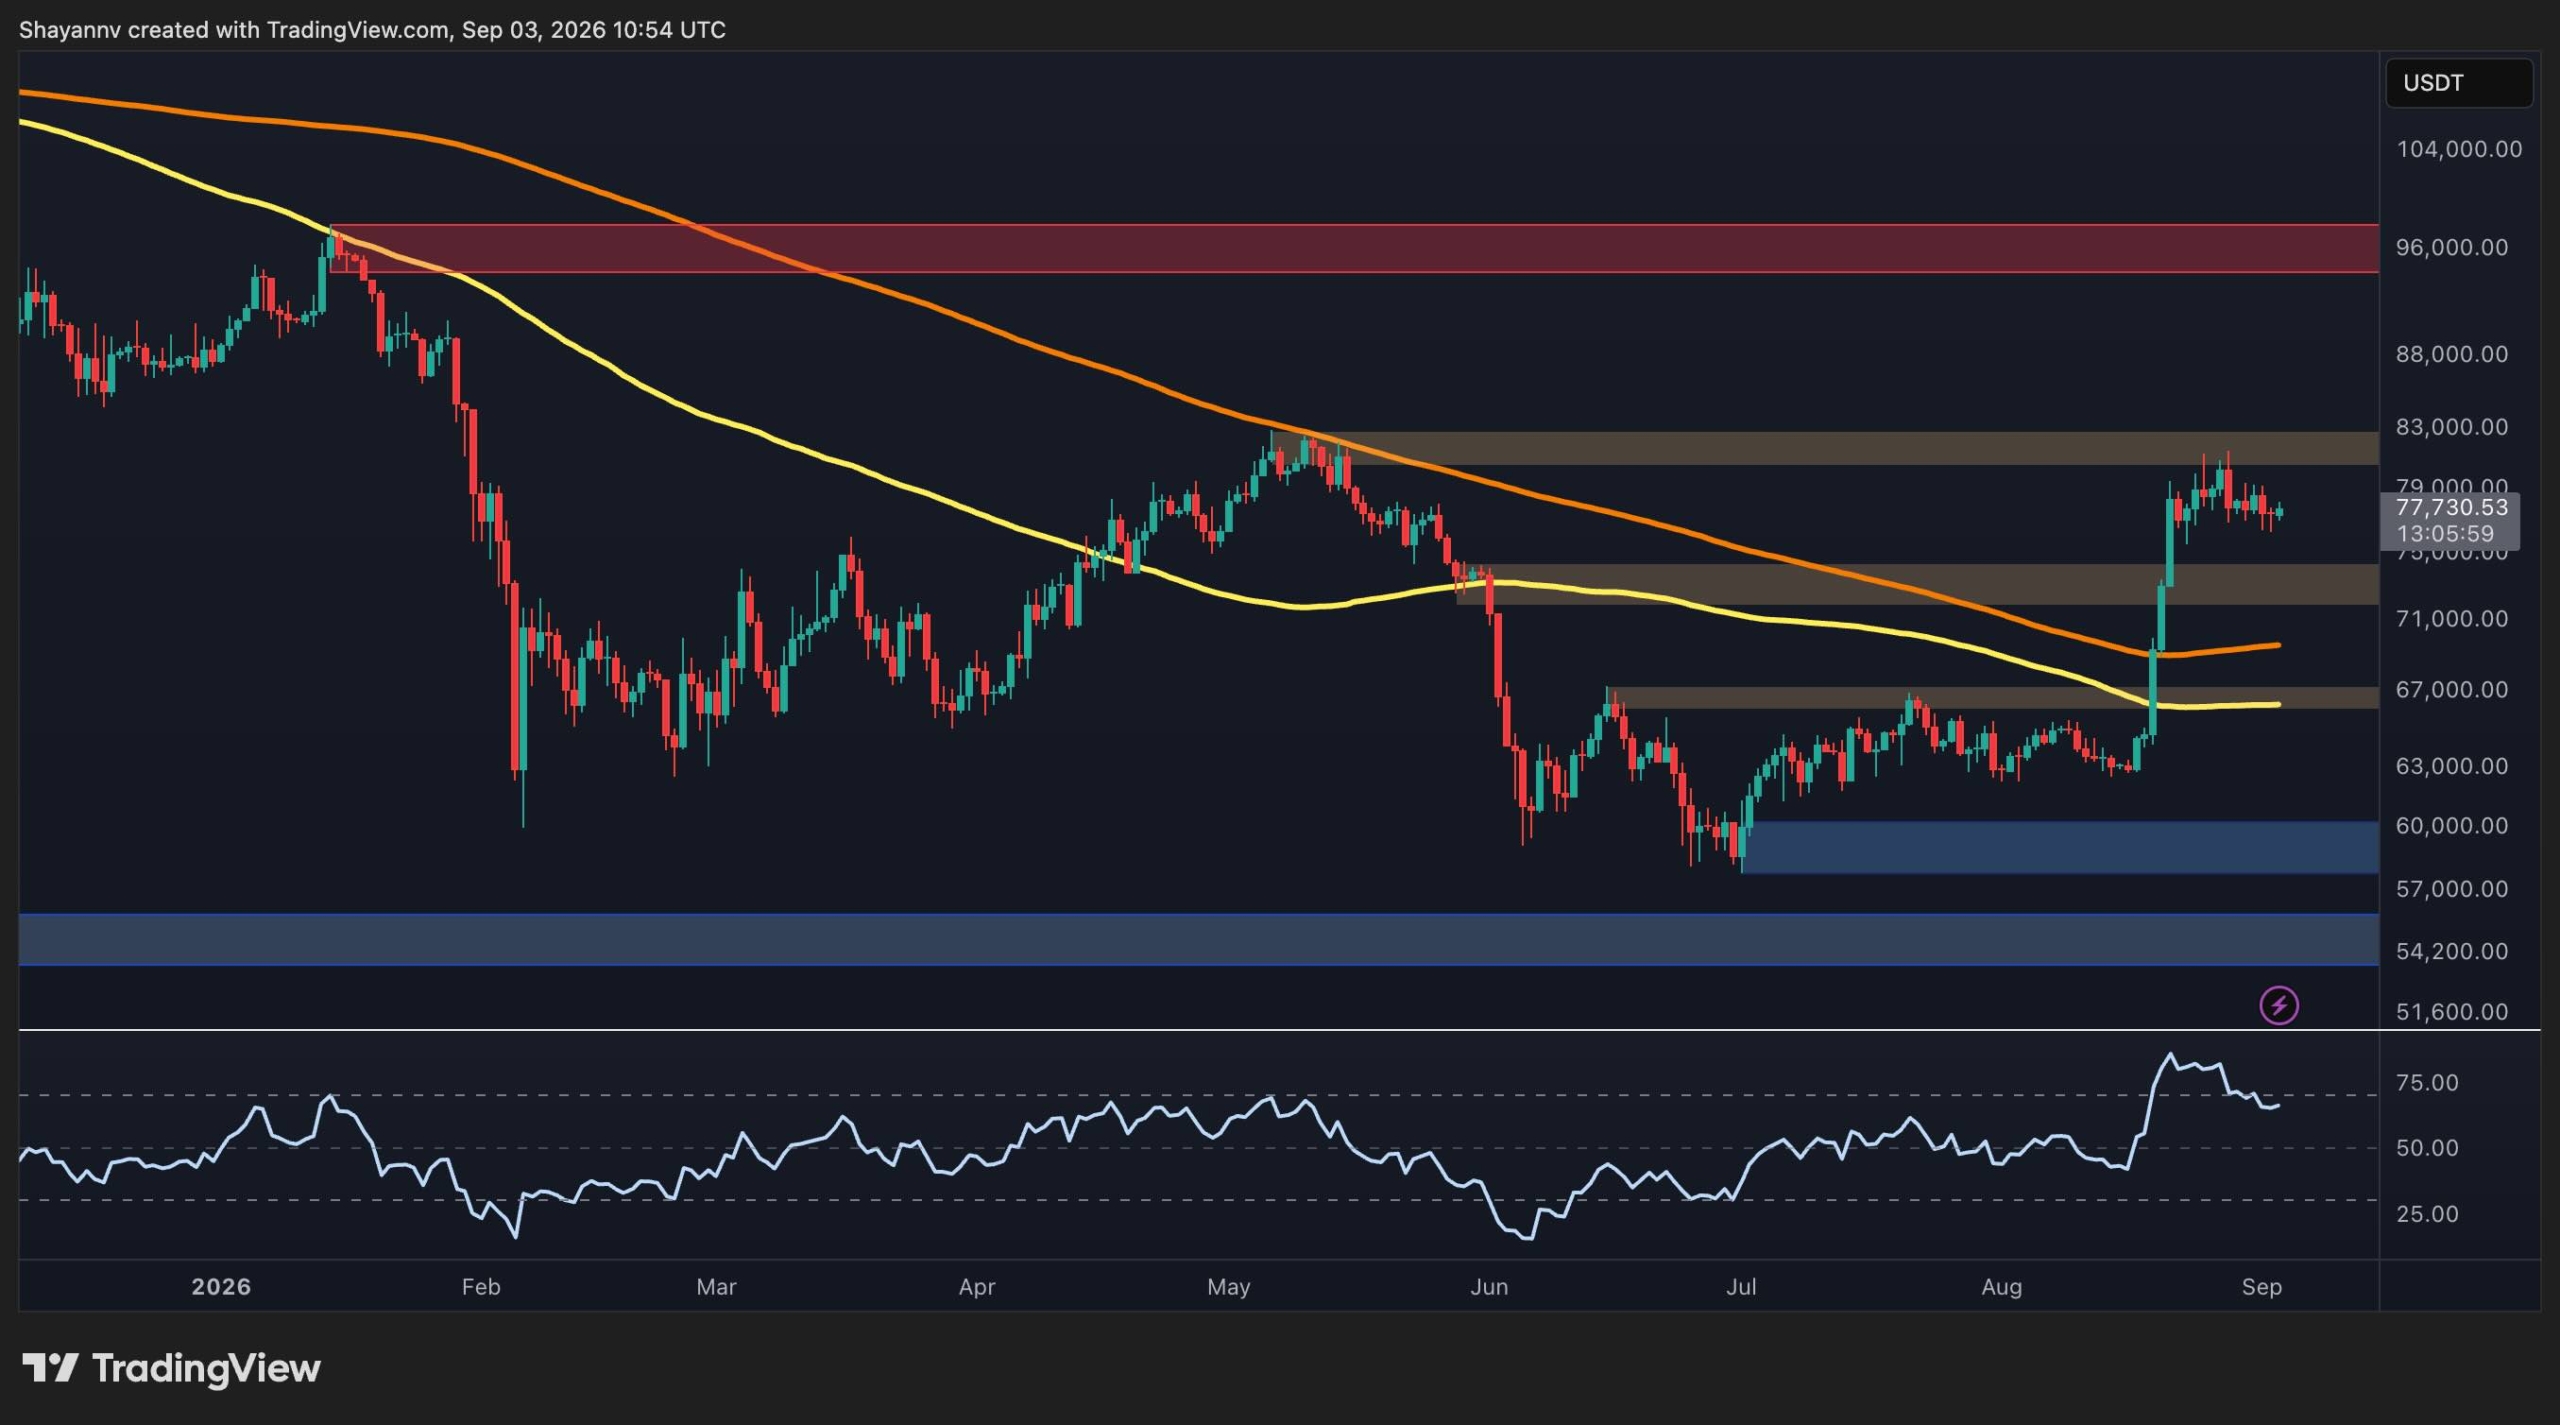
The daily chart reveals a substantial structural improvement following the rebound from the $60,000 support zone. Bitcoin (BTC) has successfully broken above the $67,000 area and subsequently reclaimed the $72,000 zone, which had previously acted as a resistance barrier. The cryptocurrency is now trading around $78,500, comfortably positioned above both major moving averages depicted on the chart.
The immediate challenge for buyers lies at the $82,000 resistance zone. This area aligns with recent swing highs, presenting a significant hurdle. A daily close above this level would bolster the recovery structure by establishing a higher high after months of a downtrend, potentially paving the way for a move towards the $95,600 resistance region.
Momentum indicators have also shown considerable improvement. The daily Relative Strength Index (RSI) has climbed from oversold territory during the June lows and is now approaching overbought conditions. However, the RSI has begun to trend lower after reaching elevated levels, suggesting a cooling of momentum rather than an acceleration.
On the downside, the $72,000 zone represents the first major support level to monitor. Holding above this level would preserve the broader recovery trend, while a more significant correction could bring the $67,000 region back into focus.
Therefore, the daily structure remains cautiously constructive. However, Bitcoin needs to overcome the $82,000 resistance to confirm that the recent recovery is evolving into a sustained bullish continuation, rather than another rejection from a key resistance point.
Four-Hour Chart Perspective
The four-hour chart presents a more cautious outlook. Since reaching the $82,000 area in late August, BTC has been consolidating within a structure resembling a falling wedge. The upper trendline of this formation has repeatedly capped upward advances, while the lower boundary is currently situated around $76,000.
Bitcoin is presently testing the upper boundary of this structure once again. A successful breakout above this resistance line, which is currently near the $78,000 mark and trending downwards, would be the initial indication of buyers attempting to regain short-term control.
A potential breakout could lead to another push towards the $82,000 area, which, as previously noted, stands as the most critical resistance level on the daily timeframe.
Conversely, a failure to break out of the wedge and a subsequent move below $76,000 could trigger a deeper correction towards the $72,000-$74,000 area, which has transitioned into support after being previously breached to the upside. Maintaining this zone would be crucial for sustaining the recovery, as a breakdown could negate the positive price action observed by Bitcoin over the past few weeks.
Exchange Whale Ratio Signals Caution
The exchange whale ratio measures the proportion of exchange inflows associated with the largest transactions, offering insight into whether large holders are becoming more active in sending Bitcoin to exchanges. A rising ratio can indicate increased potential selling pressure, though it does not necessarily imply immediate selling by whales.
The chart illustrates a sharp increase in the 30-day moving average of Bitcoin’s exchange whale ratio during the latest price recovery. This ratio has moved back towards the 0.32 area, nearing its highest visible levels on the chart, while BTC trades around $78,500.
This development warrants close observation. While Bitcoin has recovered substantially from its June lows, the escalating whale ratio suggests that large transactions directed towards exchanges have also become more prominent. This could potentially shift the supply and demand balance in favor of sellers. If this elevated reading persists while Bitcoin struggles to break above the $80,000-$82,000 area, it could reinforce the likelihood of a rejection or consolidation.
On the other hand, a decisive breakout above $82,000, coupled with a subsequent decline in the whale ratio, would offer more constructive confirmation. This would suggest that increased whale activity is not translating into significant distribution and that sufficient fresh demand exists to absorb any potential selling by large holders.
Leave a Reply