Tag: Market Trends

  • XRP Tests Critical Support Zone Amid Selling Pressure; Future Direction Uncertain

    XRP Tests Critical Support Zone Amid Selling Pressure; Future Direction Uncertain

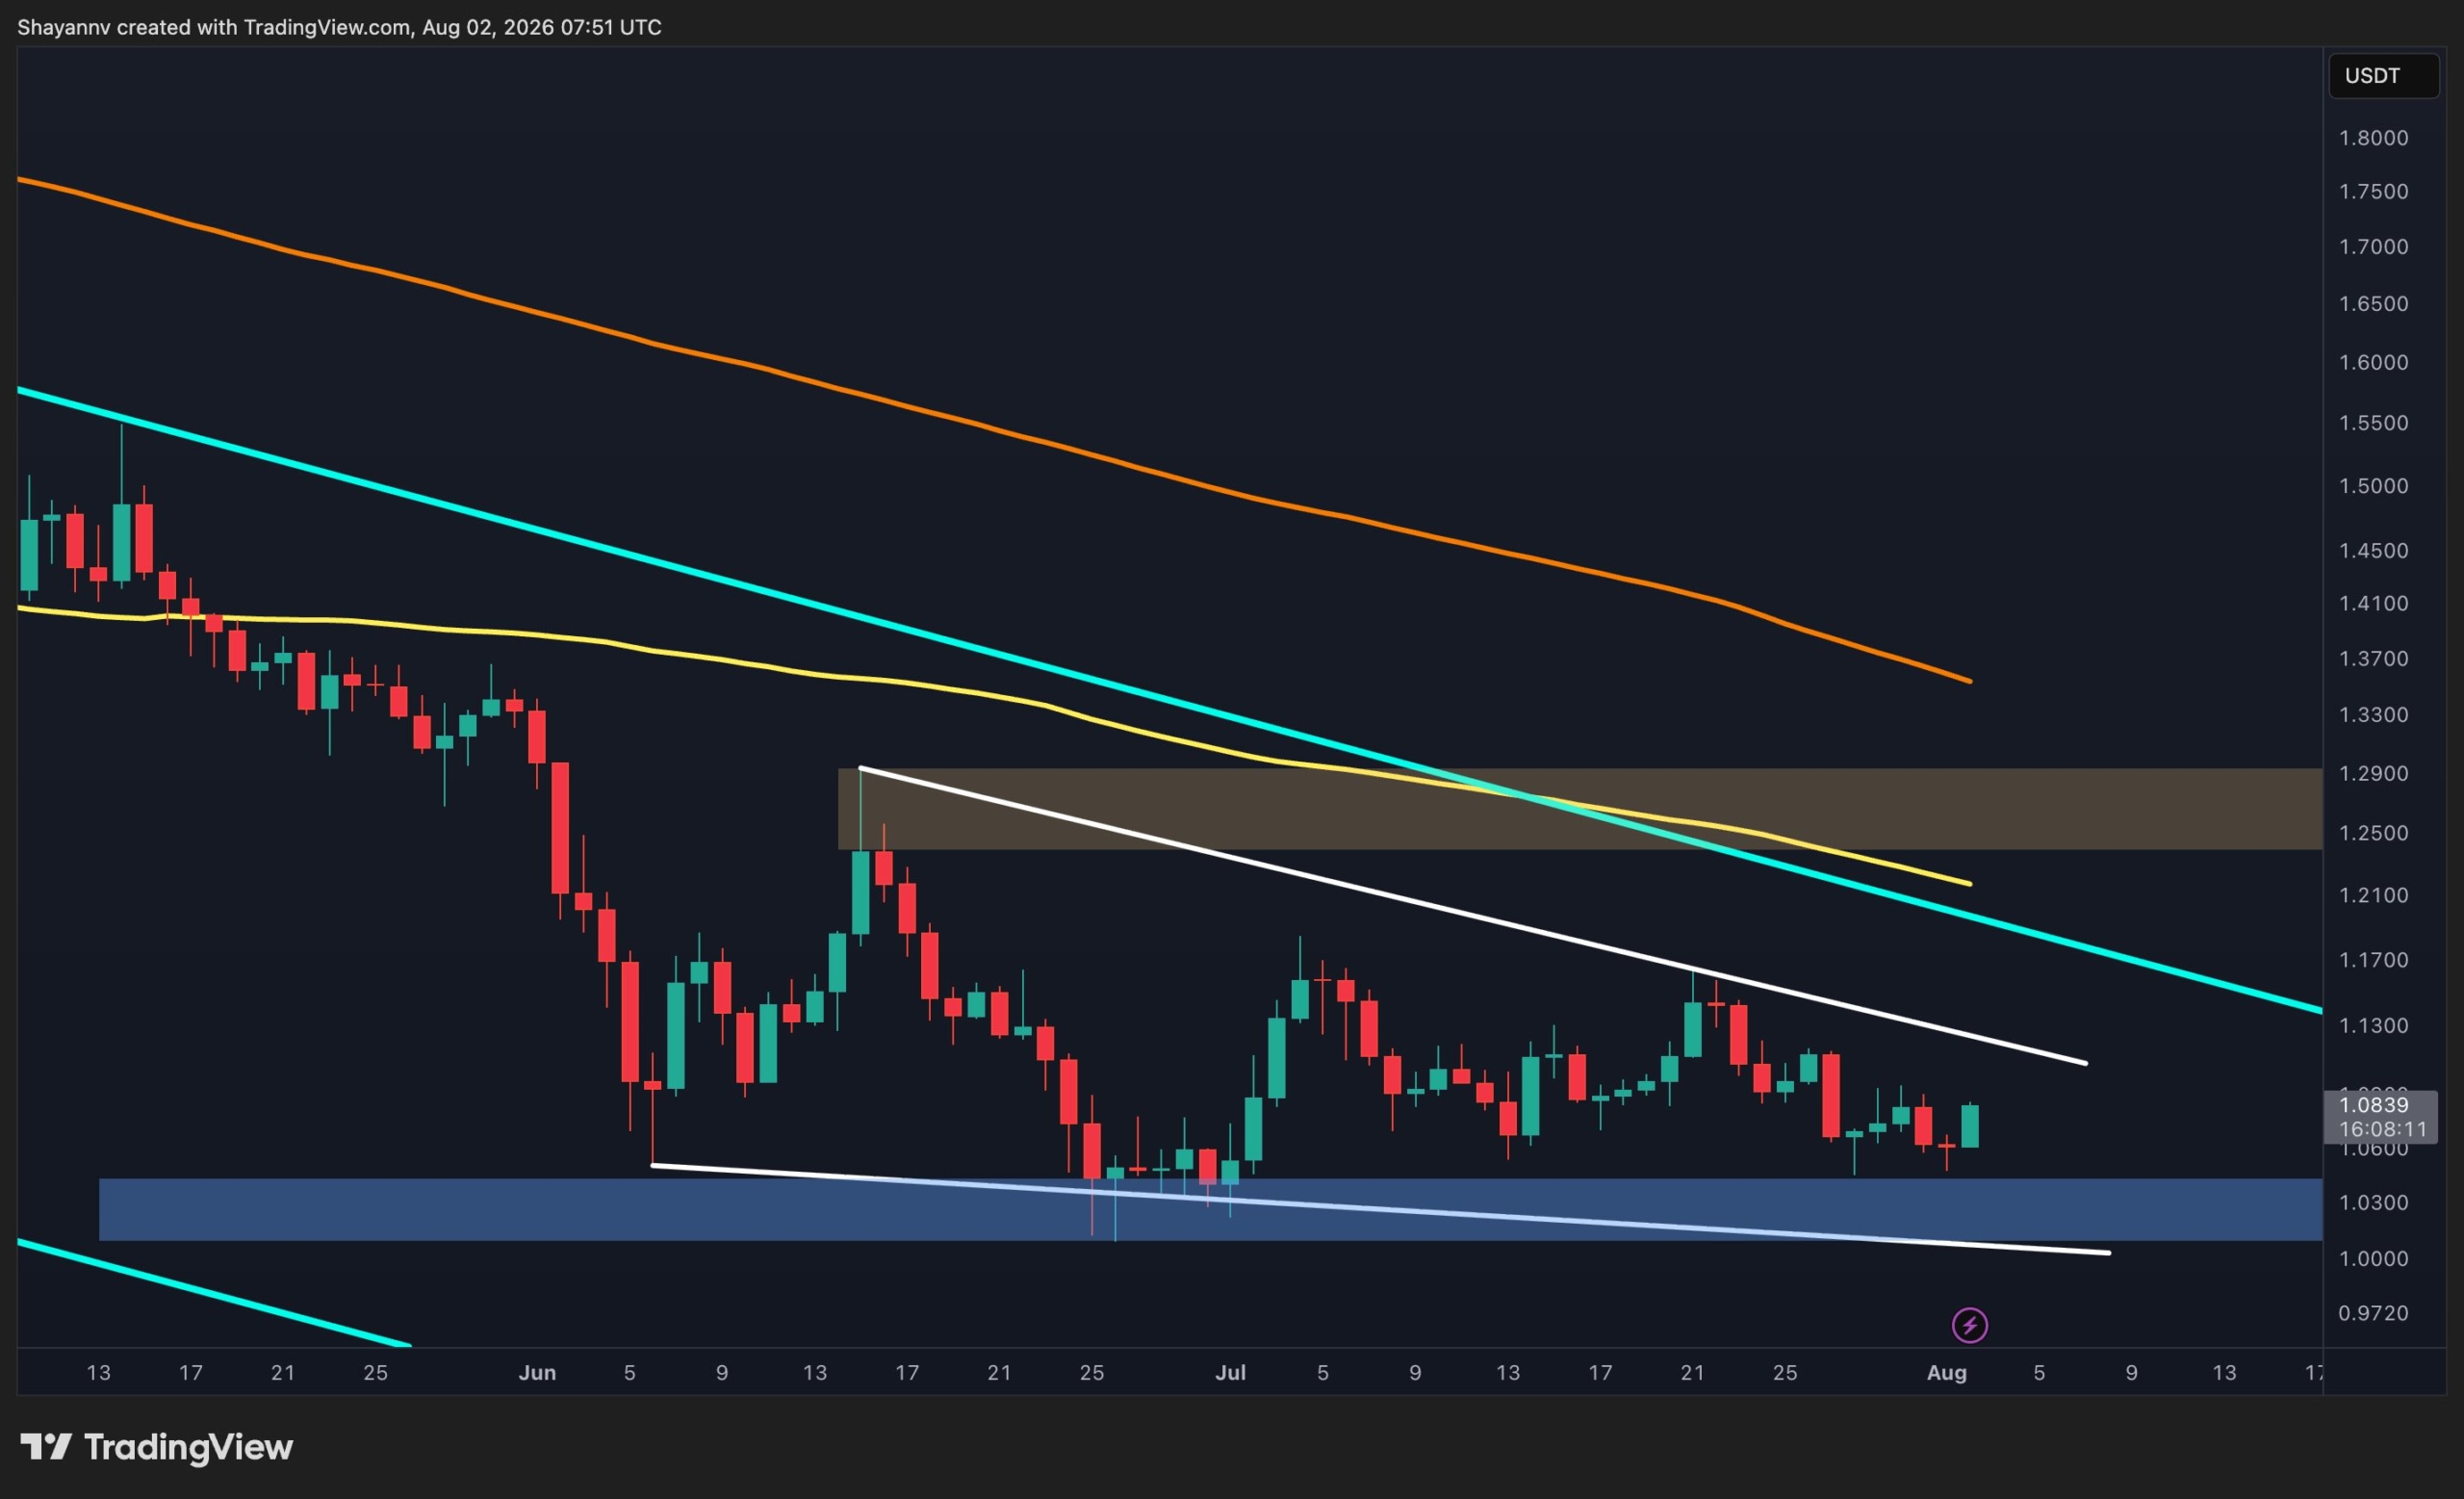
    XRP is currently navigating a critical support zone between $1.01 and $1.04, a level that has historically prevented deeper declines. The asset is experiencing significant selling pressure and remains below a descending resistance trendline and major moving averages, indicating a bearish market structure. The outcome of this test at the support zone remains uncertain, with the potential for further downside if this level fails.

    Technical Indicators Point to Bearish Structure

    According to the analysis, XRP continues to trade beneath a descending resistance trendline and remains well below major moving averages. This technical setup preserves the broader bearish market structure. Recent price action shows failed attempts at recovery, with sellers appearing to maintain control and pushing the price back toward the key demand zone.

    The Significance of the $1.01-$1.04 Support Zone

    The support area between $1.01 and $1.04 has proven to be a significant level, having prevented deeper declines in recent weeks. This makes it the most important short-term level to monitor for XRP holders and traders. However, the data suggests that if XRP breaks decisively below this zone, it could accelerate a decline toward the next major support level around $0.89.

    Short-Term Dynamics and Potential Scenarios

    On shorter timeframes, such as the 4-hour chart, XRP has continued to print lower highs and lower lows while remaining capped by the descending resistance trendline. A recent rejection near $1.09 was followed by another decline toward the $1.01 to $1.04 demand zone, underscoring the current lack of buying momentum. This area remains the last significant short-term defense for the bulls.

    The article suggests that if this support fails, the recent price movement is likely to intensify and extend the decline toward lower levels. Conversely, for any meaningful recovery to occur, buyers would first need to reclaim the descending trendline. Until this happens, rallies are likely to face selling pressure and remain corrective in nature.

    The central question remains whether XRP buyers can defend this crucial support zone, or if sellers will succeed in pushing the price below $1. The current market dynamics indicate that the outcome is uncertain. A notable move below the $1.01-$1.04 support zone could lead to a decline towards $0.89, a scenario that remains a possibility rather than a certainty. Buyers need to regain control and push XRP back above the descending trendline for a more optimistic outlook.

    Broader Context

    Within the scope of the sourced market analysis, XRP is described as follows: The latest price action suggests sellers are maintaining control.


  • Ethereum’s July Surge Meets Historically Volatile August Performance

    Ethereum’s July Surge Meets Historically Volatile August Performance

    Ethereum concluded July with its most significant monthly price increase in a year, surging approximately 20%. This performance notably outpaced Bitcoin’s 9% gain during the same period. However, Ethereum’s historical data for August presents a mixed and volatile record, introducing uncertainty into its short-term price outlook.

    Following a challenging period of six consecutive monthly losses after reaching an all-time high in August of the previous year, Ethereum staged a notable rebound in July. The cryptocurrency’s price fluctuated, dipping towards $1,500 before reaching $1,980 at one point, and ultimately closing the month around $1,900. This recovery followed substantial drops in November (-22.38%), January (-17.52%), and February (-19.81%). While March and April offered modest gains of around 7% each, May saw an 11% decline, and June experienced a significant 21.7% drop, reflecting broader market bearishness.

    August’s Mixed Track Record

    Historically, August has been a month of significant price action for Ethereum, characterized by considerable volatility. Some years have delivered substantial gains, such as the nearly 93% surge in August 2017, a 25.32% increase in August 2020, and a 35.62% pump in August 2021, during which Ethereum broke its previous all-time high record. Conversely, August has also presented challenges. Notably, Ethereum slumped by almost 35% in August 2018, experienced a further 21.31% decline in August 2019, and saw a 22.21% drop in August 2024. In fact, six out of the eight Augusts since 2016 have closed in the red.

    Navigating Short-Term Uncertainty

    This historical pattern of mixed results in August suggests that while Ethereum’s recent July performance was strong, it does not guarantee continued gains. The cryptocurrency’s short-term price future remains subject to the volatility historically associated with the month of August. Investors and market analysts will be closely observing Ethereum’s performance in the coming weeks, given the contrast between its recent positive momentum and the unpredictable nature of Augusts past.

    Why This Matters

    The materials describe a narrow update: Ethereum’s price surged by approximately 20% in July, outperforming Bitcoin’s 9% gain. Ethereum’s short-term price future.

    Broader Context

    Source materials place the market analysis in this context: The second-largest cryptocurrency by market cap had a violent end to 2025 and a similarly painful start to 2026.

  • Crypto Market Navigates Geopolitical Shifts and Economic Policy Uncertainty

    Crypto Market Navigates Geopolitical Shifts and Economic Policy Uncertainty

    The cryptocurrency market exhibited notable volatility over the weekend, with significant price movements observed in Bitcoin and Cardano. These fluctuations occurred against a backdrop of geopolitical developments and in anticipation of upcoming economic policy decisions, underscoring the complex and often ambiguous relationship between external events and digital asset prices.

    Over the weekend, Bitcoin experienced a dip to around $62,000 before recovering to $63,500. This movement coincided with news that US President Donald Trump had canceled planned attacks against Iran. Simultaneously, Cardano’s native token surged by 9%. While these events occurred alongside price shifts, establishing a direct causal link remains challenging. The observed correlation between geopolitical de-escalation and initial price upticks is noted, but it is important to recognize that other factors likely influenced market behavior.

    Further contributing to market dynamics was the anticipation surrounding the upcoming FOMC meeting. Uncertainty ahead of this key financial meeting appears to have prompted some investors to de-risk, leading to the offloading of Bitcoin. This sentiment contributed to price drops, with Bitcoin falling to $62,800 at one point. The price of Bitcoin fluctuated significantly throughout the period, touching lows of $62,400 for the first time in over two weeks on Friday morning, and later dipping to $62,100 on Saturday, before managing a rebound to $63,000. By Sunday morning, it had climbed back to $63,500.

    As the business week commenced, Bitcoin was trading above $64,000 and reached $65,600 on Monday. However, the upward momentum stalled, and the asset later experienced a drop. Bitcoin’s market capitalization reclaimed $1.270 trillion, and its dominance over altcoins remained below 57% on CoinGecko. Other cryptocurrencies also saw varied performance. XRP defended its $1.05 support level, a level analysts suggest could be key for a potential rally. SOL and HYPE each saw a 1% increase, while XLM, DOT, AVAX, NEAR, PEPE, and WLD recorded gains of up to 4%. Cardano’s token reached $0.185 following its 9% surge. The total crypto market capitalization increased by $40 billion from its recent low, reaching $2.250 trillion on CoinGecko.

    The interplay of these factors highlights the inherent uncertainty in interpreting cryptocurrency market movements. While geopolitical events and economic policy discussions can correlate with price action, they do not offer a definitive roadmap for market direction. The observed volatility suggests that investor sentiment and anticipation play a crucial role, but the precise impact and timing of these influences are difficult to quantify. Therefore, it remains challenging to establish direct, one-to-one causal relationships between specific external events and the complex dynamics of the crypto market. The situation underscores the need for cautious interpretation and an awareness of the limitations in attributing price movements solely to identifiable triggers.

    Why This Matters

    The materials describe a narrow update: Bitcoin experienced volatility, dipping to lows around $62,000 before recovering to $63,500 following news of canceled US attacks on Iran. The exact timing and duration of the price volatility before and after the geopolitical event.

    Broader Context

    Source materials place the factual news in this context: Weekend Watch.

  • Strategy Reports $8.23B Q2 Loss Amidst Bitcoin Volatility; Coinbase Revenue Declines

    Strategy Reports $8.23B Q2 Loss Amidst Bitcoin Volatility; Coinbase Revenue Declines

    Strategy reported a net loss of $8.23 billion for the second quarter of 2026, primarily due to unrealized losses in its Bitcoin holdings. Concurrently, Coinbase experienced a 19% annual revenue decline over the 12 months ending June 30, with a notable drop in trading volumes.

    Strategy’s Financial Performance

    In Q2 2026, Strategy recorded an unrealized loss of $8.32 billion, linked to Bitcoin’s price performance. Despite this, the company increased its Bitcoin holdings by 846 units during the three-month period ending June 30. Strategy also saw an increase in its U.S. dollar holdings and Bitcoin per share by 12% and 5%, respectively. In contrast to the current quarter’s loss, Strategy had an income of $10 billion in Q2 2025. Over the last 12 months, total revenue grew by 6.9%, from $114.5 million in Q2 2025 to over $122 million in Q2 2026. Gross profits for Q2 2026 reached $81.6 million, representing a 69% gross margin, up from $78.7 million in the prior year’s second quarter. The CEO, Phong Le, stated that convertible debt was reduced to just under $7 billion.

    Executive Commentary and Strategy

    Michael Saylor, executive chairman and founder, commented that Strategy is evolving its business model amidst muted Bitcoin sentiment, establishing Digital Credit as a new asset class. He expressed the goal of returning STRC to health with stable demand, high liquidity, and low volatility trading near par, viewing this as the optimal path for long-term shareholder value. The CEO also indicated that Strategy intends to repurchase STRC shares if they trade below $100, according to the company’s report.

    Coinbase’s Financial Performance

    Coinbase’s financial report for the 12 months ending June 30 revealed a 19% decrease in revenue. Quarterly trading volumes fell by 24% to just over $145 billion. Transaction revenue saw a 21% drop, with consumer transactional revenue declining 20% compared to Q1 2026. Coinbase attributed this decrease to a 24% decline in crypto spot trading volume. Fee collection from subscriptions and services dipped by 5% in the quarter but still constituted nearly half of Coinbase’s net revenue. The company’s earnings before interest, taxes, depreciation, and amortization (EBITDA) stood at $208 million, though adjusted losses exceeded $300 million. Notably, the average amount of USDC held across Coinbase products reached a record high of $20 billion by the end of the quarter, representing over 30% of all USDC in circulation.

    These reports from Strategy and Coinbase highlight the volatility and inherent risks within the cryptocurrency market. Strategy’s significant net loss, driven by unrealized asset depreciation, occurred alongside operational revenue growth. Coinbase, conversely, is navigating challenges in transactional revenue due to reduced trading activity, while its subscription services and stablecoin holdings demonstrate resilience.

    Why This Matters

    The financial reports from Strategy and Coinbase reveal significant challenges, including substantial losses and revenue declines, underscoring the inherent volatility and risks within the cryptocurrency market, even as some companies demonstrate resilience in specific revenue streams or asset holdings.

    Broader Context

    Source materials place the factual news in this context: Strategy Posts $8.2B Q2 Loss as Coinbase Revenue Falls 19%.

  • XRP Enters ‘Battlefield’ Zone, Analysts Eye Reversal

    XRP Enters ‘Battlefield’ Zone, Analysts Eye Reversal

    Crypto Market Slides Amid Middle East Tensions, XRP Tests Key Support

    The cryptocurrency market has experienced fresh losses in recent hours, with Bitcoin (BTC) falling to $62,000 after failing to regain the $63,000 support level. The downturn appears to be linked to a re-escalation of tensions in the Middle East.

    XRP has also been affected, slipping below $1.05. The digital asset had previously been rejected at $1.20 during a mid-July rally, which followed favorable US inflation data for June. It subsequently lost the crucial $1.10 support. XRP is now contending with its last line of defense before potentially entering the $1.00 zone, which bulls may need to protect.

    Analysts Eye $1.05 as Critical Level

    Popular analyst EGRAG CRYPTO has highlighted the significance of the $1.05 level, describing it as a “battlefield” region. While the analyst noted earlier that XRP had managed to hold this level, they acknowledged a predominantly bearish structure characterized by lower highs on the 4-hour chart.

    For a short-term recovery, EGRAG CRYPTO suggests that XRP must successfully defend $1.05. This would pave the way for a bounce above $1.083 and a potential reclaim of the $1.10 level, which is now acting as resistance.

    Potential for Significant Upside

    Looking further ahead, EGRAG CRYPTO has outlined a more optimistic scenario for XRP if it can sustain its recovery. The analyst has set a “major price target” of $1.30.

    However, a decisive break below $1.05 would likely see XRP head towards a significant liquidity zone around $1.00, the analyst cautioned.

    Historical Parallels Suggest Reversal Potential

    Analyst Mikybull Crypto also believes XRP possesses the strength for a notable comeback. Despite the current negative sentiment, the analyst claims that the asset’s bullish reversal is “loading.”

    Mikybull Crypto’s long-term chart draws a comparison between XRP’s current market structure and that of two years ago, when the token was trading in a compressed range around $0.60. Following that period of consolidation, XRP experienced a significant surge to an all-time high in less than a year.

    “Before the last run, I screamed for you to buy at a crazy discount. The opportunity is presenting again,” Mikybull Crypto stated.

    August Historically Challenging for XRP

    Despite the optimistic outlook from some analysts, XRP’s historical performance in August has been challenging. Previous reports indicate that the cross-border token has ended the month in negative territory in all four previous Augusts.

  • AI XRP Price Predictions Face Significant Hurdles: Analysis of Current Market Realities

    AI XRP Price Predictions Face Significant Hurdles: Analysis of Current Market Realities

    AI-generated price predictions for XRP, notably from ChatGPT, suggest a potential for significant price appreciation by the end of 2026 and into 2027. However, these optimistic forecasts are currently detached from XRP’s immediate technical resistance levels and broader market momentum, highlighting the inherent uncertainties in cryptocurrency forecasting.

    According to ChatGPT AI, a multi-year move for XRP could see prices reach between $8 and $15 in a bull case scenario, with an extreme upside above $20 in a euphoric market. Conversely, the AI also presented a bear case where XRP struggles to break above $2 to $4 by 2027. These predictions are contingent on a complex web of factors, including full regulatory clarity, increased institutional adoption of Ripple Payments, the growing use of the XRP Ledger for real-world asset tokenization, and the adoption of RLUSD. Additional catalysts cited include the potential for a spot XRP ETF, increased cross-border settlement volume, improving crypto regulation, declining interest rates, and renewed retail participation.

    Despite these forward-looking predictions, current market data for XRP presents a more grounded picture. XRP’s price is currently around $1.07013, having traded within a narrow range of $1.06976 to $1.08900 in the recent session. Technical analysis indicates significant resistance levels that XRP must overcome for any substantial upward movement. Key resistance points are identified at $1.20, $1.40, and a more substantial ceiling near $1.60. This $1.60 level has capped recovery attempts earlier in the year and represents a critical hurdle that XRP has not closed above since before a June price move. For the AI’s bull case to gain traction, XRP would first need to reclaim this $1.60 level.

    The AI’s predictions also acknowledge potential headwinds. The bear case suggests that real-world XRP utility might grow slower than anticipated, or that banks could favor alternatives like RLUSD or other settlement rails, failing to generate meaningful demand for XRP itself. Other risks include disappointing ETF inflows, intensified competition from networks like Ethereum and Solana, and restrictive macro conditions. In such a scenario, ChatGPT sees XRP struggling to surpass $2 to $4 by 2027.

    Broader Market Context and Speculative Alternatives

    The article also touches upon the broader cryptocurrency market, noting that established large-cap assets like Bitcoin, Ethereum, and XRP are currently facing limitations, pressing against ceilings with little immediate room for significant price movement. This observation contrasts with the potential perceived in early-stage infrastructure plays, which, due to their smaller market capitalization, can experience dramatic price movements with modest capital rotation. However, the article stresses that the returns in such projects lie in the gap between their current valuation and their eventual worth, a gap that closes once the project becomes widely discovered.

    In this context, a project named LiquidChain is introduced as a potential solution to DeFi fragmentation. The AI predicts that LiquidChain could enable all networks within a single execution layer, offering zero cross-chain tax on interactions. However, the article emphasizes that LiquidChain is in its early stages, with unproven execution and unknown adoption. Its presale price is $0.01454, and it has raised just over $890,000. The article frames LiquidChain as an entry point that disappears once the market recognizes its potential, underscoring its speculative nature.

    Conclusion: Evidence Over Speculation

    Ultimately, the AI’s price predictions for XRP, while offering potential scenarios, are not guarantees. The current technical landscape for XRP indicates significant resistance, and the realization of these optimistic forecasts is contingent on numerous uncertain factors. Investors are reminded that decisions should be grounded in verifiable data and analysis, rather than solely on speculative AI forecasts, especially when considering early-stage, unproven projects.

    Why This Matters

    The materials describe a narrow update: ChatGPT AI has predicted a potential multi-year move for XRP, with price targets ranging from $8 to $15 for a bull case, and an extreme upside above $20 in a euphoric market. The actual realization of ChatGPT’s XRP price predictions remains subject to significant market uncertainties and technical limitations.

  • Tether Posts $1.5B Q2 Profit Amid USDT Growth, Gold Buys

    Tether Posts $1.5B Q2 Profit Amid USDT Growth, Gold Buys

    Tether Reports Strong Second Quarter Profit Amid Market Headwinds

    Tether, the issuer of the USDT stablecoin, announced a net operating profit of $1.5 billion for the second quarter, marking a nearly 50% increase from the first quarter of 2026. The company achieved this growth by expanding USDT in circulation, increasing its reserve surplus to over $4 billion, and bolstering its gold holdings, even as the broader stablecoin market experienced a downturn.

    The financial results were detailed in Tether’s latest quarterly attestation, released Friday. As of June 30, the company reported holding approximately $187.75 billion in assets against roughly $183.64 billion in liabilities, resulting in a reserve surplus of approximately $4.11 billion.

    “Without a doubt, Tether continues to deliver financial inclusion in the developing world like no other company or organization ever has in the history of humanity; we’re all incredibly proud of this achievement,” CEO Paolo Ardoino stated on the social media platform X.

    The report indicated that USDT in circulation reached approximately $184.6 billion by the end of the quarter, an increase of about $446 million from the close of March. Despite a contraction in the overall stablecoin market during the quarter, Tether reported that USDT’s market share grew to exceed 60%.

    Tether stated that the majority of assets backing USDT are invested in short-term U.S. Treasuries, repurchase agreements, and other highly liquid government-backed instruments. These investments were the primary drivers of the quarter’s operating profit, according to the company.

    Furthermore, Tether announced a reduction in its secured lending exposure by approximately $2.38 billion, or 15%, during the quarter.

    The company also expanded its physical gold holdings, adding 14 metric tons to bring its total reserves to over 146 metric tons.

    Ardoino drew a contrast between Tether’s strategic focus and what he characterized as the traditional financial industry’s preoccupation with soaring AI stock valuations. He emphasized Tether’s commitment to investing in technologies that enhance access to financial services and artificial intelligence for underserved populations.

    “These results show that Tether has the liquidity, discipline and scale to remain resilient across market cycles while continuing to serve hundreds of millions of users around the world,” Ardoino added.

  • Bitcoin Price Faces Uncertainty Amidst Conflicting Macroeconomic, Geopolitical, and Technical Signals

    Bitcoin Price Faces Uncertainty Amidst Conflicting Macroeconomic, Geopolitical, and Technical Signals

    Bitcoin’s recent price action is currently marked by significant uncertainty, as a confluence of macroeconomic pressures, geopolitical escalations, and technical indicators present a complex and often conflicting outlook for the coming week. The cryptocurrency has struggled to maintain a firm direction, leaving investors and analysts weighing various factors that could influence its short-term movements.

    Macroeconomic Crosscurrents
    The central bank’s decision to leave interest rates unchanged on Wednesday has been followed by historical Bitcoin price corrections. This trend has materialized recently, with Bitcoin experiencing a $3,000 price decline over the past few days, correcting to a two-week low of $62,400 on Friday. Some analysts suggest this correction may have already priced in the typical post-FOMC retracement.

    Escalating tensions in the Middle East add to the market’s complexity. Reports indicate that Iran may have struck tankers under US escort in the Strait of Hormuz. Further reports from the WSJ claimed that former President Trump ordered a fresh attack on Iran, while CBS News suggested US plans to attack Iranian energy assets, with substantial escalation potentially beginning over the weekend. Such geopolitical instability is generally viewed as a negative factor for risk-on assets like Bitcoin.

    Investor Sentiment and Technical Signals
    Investor sentiment, as reflected in Bitcoin Exchange-Traded Fund (ETF) flows, has also shown volatility. After a three-week period of net inflows totaling over $200 million, the tides turned last week with $61.53 million in net outflows. Friday saw a significant pullout of over $265 million, reversing the $233 million in net inflows recorded on Thursday.

    On the technical front, analyst Ali Martinez has warned that the TD Sequential indicator has flashed a major sell signal on the 3-day chart. This signal emerges as August begins, a month that has historically been associated with Bitcoin pullbacks. Martinez noted that while history does not always repeat, this setup warrants attention.

    Countervailing Forces and Expert Views
    Conversely, other perspectives suggest a potential for a rebound. Analyst Michaël van de Poppe noted Bitcoin’s historical connection with the Nasdaq and South Korea’s KOSPI indices. Both major indices experienced significant gains at the end of the business week, with KOSPI notching an 18% surge. Van de Poppe suggested that a similar correlation in the past coincided with Bitcoin rallying to $83,000, indicating a potential for a strong start to August for Bitcoin.

    This divergence in signals—between potential downward pressure from macroeconomic and geopolitical factors, technical sell signals, and ETF outflows, versus the possibility of a rebound driven by correlated market performance—creates a significant degree of uncertainty. Investors are left to navigate these conflicting influences, acknowledging that definitive predictions remain challenging in the current environment. The coming week will be crucial in determining whether Bitcoin succumbs to the bearish pressures or finds support from broader market strength.

    Why This Matters

    The materials describe a narrow update: Bitcoin failed to break the $65,000 mark, and several indicators suggest a potential price decline. Whether the current market setup will lead to a repeat of historical BTC pullbacks in August.

    Broader Context

    Source materials place the market analysis in this context: Bitcoin tried but failed at $65,000 on several occasions in the past week, and there are now multiple and different signals suggesting that another leg down is on the cards.

  • XRP’s Historical Performance: Analyzing July Gains Against August Declines

    XRP’s Historical Performance: Analyzing July Gains Against August Declines

    Historical data indicates that XRP has demonstrated a pattern of strong performance in July, contrasted with a tendency for declines in August. This analysis examines these historical trends, while acknowledging the inherent uncertainties and limitations of using past data to predict future market movements.

    Why This Matters

    The materials describe a narrow update: The article examines XRP’s historical performance in August, noting a streak of four consecutive down months, and contrasts this with its strong performance in July, which has seen gains in eight out of thirteen months since 2014. Whether XRP will buck its bearish August streak.

    XRP’s July Performance: A Historical Overview

    XRP has achieved notable gains in July, with eight out of thirteen recorded Julys since 2014 ending in positive territory. The asset has also established a streak of seven consecutive Julys with gains, extending back to 2020. In July 2020, XRP experienced a significant increase of 48%. Other notable July gains include a 47.6% rise in 2023, a 31.2% increase in 2024, and a 35% gain in 2025. The median gain for July across the analyzed period stands at 6.91%.

    XRP’s August Performance: A Historical Pattern

    In contrast, August has historically presented a different picture for XRP. The past four Augusts have all concluded with declines. Data from CryptoRank shows that only four out of thirteen Augusts on record have ended higher for XRP. Significant declines have been observed, such as a 13.6% fall in August 2022 and a more substantial 26.6% decrease in August 2023. More recent Augusts also saw declines, with a 9.17% drop in 2024 and an 8.15% decrease in 2025. The median performance for August across the recorded period indicates a decline of 6.57%.

    Limitations of Historical Data and Current Market Context

    While historical data highlights these contrasting monthly patterns, it is crucial to recognize the limitations of such analysis. Two of XRP’s largest August gains, a 52% surge in 2017 and a 60% rise in 2021, occurred during a bull market, a condition not currently prevalent. The current market environment is influenced by factors such as ongoing global uncertainty, inflation concerns, and geopolitical events, which can impact asset performance independently of historical monthly trends.

    Furthermore, past performance does not guarantee future results. The observed historical patterns for July and August provide context but do not offer predictive certainty. Uncertainty remains regarding whether XRP will deviate from its historical August performance or if further declines are imminent. The analysis of historical data, such as the median gains and declines, serves as an observational tool rather than a definitive forecast. Factors such as broader market conditions and specific developments within the cryptocurrency space can significantly influence XRP’s price action.

  • Cardano (ADA) Shows Accumulation Signals Amidst Historical Underperformance and Uncertainty

    Cardano (ADA) Shows Accumulation Signals Amidst Historical Underperformance and Uncertainty

    Cardano’s price has recently seen an uptick, with on-chain data suggesting a notable activity towards an accumulation phase. However, this emerging narrative is tempered by the asset’s significant historical underperformance and ongoing market uncertainties.

    Price Action and Accumulation Indicators

    Over the past 24 hours, Cardano (ADA) experienced a price increase of 4%, rising from approximately $0.164 to above $0.17. This movement contributes to a monthly gain of around 12%. Amidst this improving price structure, new data indicates that ADA may be entering a different phase, moving away from panic-driven selling towards a more constructive accumulation. According to analyst ‘The Boss’, buyers have continued to defend a major demand zone between $0.1064 and $0.1503, while a short-term ascending trendline is supporting the recovery structure. The asset is also compressing below overhead resistance, suggesting the market is seeking its next directional move rather than extending previous declines.

    Further bolstering the case for accumulation, whale activity has increased. CryptoPotato reported that large ADA holders have increased their combined holdings to 25.6 billion tokens, representing nearly 70% of the circulating supply. This level of accumulation by large holders is the highest observed since February 2023. Analyst Ali Martinez found that whales had accumulated 30 million ADA, valued at over $5 million, in the previous month. This renewed buying activity suggests that larger investors may be positioning for potential future price increases. Meanwhile, institutional interest remains steady, with Cardano ETFs posting 16 consecutive months of net inflows, as revealed by Blockworks.

    Historical Context and Founder’s Outlook

    Despite these positive on-chain signals and recent price action, Cardano’s historical performance remains a significant concern for some market observers. One market watcher highlighted that a $10,000 investment made at its all-time high five years ago would now be worth approximately $500. From its August 2021 all-time high, the token is still down about 95%. Additionally, a past mention by Trump in March 2025, related to a proposed US Strategic Crypto Reserve, is associated with an approximate 84% price fall since that time.

    Cardano founder Charles Hoskinson, however, maintains a positive outlook on the ecosystem’s future. He recently drew parallels between Cardano’s development approach and Anthropic’s rise in the AI field, suggesting that a focus on the ‘right mindset’ is crucial for long-term success. Hoskinson noted that developers and investors are increasingly prioritizing security and governance within the Cardano ecosystem, especially in light of recent DeFi incidents that have highlighted vulnerabilities. He stated that lasting stability requires clear governance, robust development processes, and a sustainable roadmap. While acknowledging past challenges, Hoskinson expressed optimism about the ecosystem’s current standing and anticipates strong growth over the next 12 to 24 months.

    Navigating Uncertainty

    Ultimately, while recent data points to increased accumulation and positive price action for Cardano, the asset’s long-term performance and the inherent volatility of the cryptocurrency market mean that this trend is not yet a certainty. Key uncertainties remain regarding whether the developing base can translate into a broader recovery and the future directional movement of the crypto asset. Investors are advised to observe these developments cautiously.

    Why This Matters

    The materials describe a narrow update: Cardano’s price increased by 4% in 24 hours, reaching above $0. Whether the developing base can turn into a broader recovery.

    Broader Context

    Source materials place the factual news in this context: Cardano was up by 4% over the past 24 hours after a few choppy sessions earlier in the week.