Tag: Market Trends

  • Anthropic’s Claude AI Forecasts XRP Price by End of 2026

    Anthropic’s Claude AI Forecasts XRP Price by End of 2026

    XRP Poised for Fed-Driven Breakout, Analysts Eye $2.80 Target

    XRP is currently consolidating, holding a key support level that has been defended for weeks, as it awaits a crucial decision from the Federal Reserve. The cryptocurrency saw a modest climb from approximately $1.05 to $1.14 earlier this month before retreating to $1.06 as institutional buying moderated ahead of the Federal Open Market Committee (FOMC) meeting.

    Despite the pause in price action, seven US spot XRP exchange-traded funds (ETFs), launched since late 2025, continue to absorb supply. This steady institutional accumulation during a quiet period is often seen as a stronger indicator of genuine demand than a sudden surge, suggesting a conviction beyond speculative momentum.

    Institutional Outlook and Potential Catalysts

    Geoff Kendrick of Standard Chartered has presented a credible institutional price target of $2.80 for XRP by year-end. This figure, revised down from an earlier $8 call following a February sell-off, is considered a more conservative and tested valuation.

    The near-term catalyst for XRP to break through the $1.20 resistance zone is anticipated to be a dovish signal from the Fed. Polymarket traders are currently assigning a 70% probability to this outcome by the end of the month.

    Bullish and Bearish Scenarios

    Should XRP successfully clear the $1.20 hurdle, a move towards the prior cycle high near $2.20 becomes a realistic prospect. A stretch target of $2.80 could be achievable if broader altcoin rotation follows a Bitcoin recovery above $80,000.

    Conversely, the bearish outlook is rooted in the same underlying data. The Relative Strength Index (RSI) currently sits at a neutral 53, while the 50-day and 200-day moving averages are largely flat around $1.10, indicating a stall in momentum without a fresh catalyst.

    If the Fed’s decision disappoints risk assets, XRP’s technical support at $1.00 to $1.05 could falter, potentially leading to a slide towards $0.80, the location of the last significant accumulation zone from early 2026.

    Technical Landscape and Broader Trends

    XRP closed at $1.0665, down 0.12%, with an intraday range between $1.0608 and $1.0925. This flat close aligns with the neutral RSI and flat moving averages, reinforcing the prediction of stalled momentum.

    The broader trend since July 2025 has been a prolonged, uneven decline. XRP peaked near $3.65 that month and subsequently experienced a significant drop in October, gapping down from above $2.60 to below $1.80 within weeks. Following this crash, price action compressed between roughly $1.30 and $1.60 before breaking lower in June, heading towards $1.05. The recent bounce to $1.14 has already receded, mirroring the stalled momentum indicated by the technical indicators.

    Key support is identified at $1.00, a level crucial for the bearish scenario. Resistance is stacked at $1.14, followed by the $1.20 zone targeted by Polymarket traders, and then the more significant ceiling near $2.20 from the previous cycle high.

    The Waiting Game for Risk Assets

    Momentum for XRP is currently neutral, lacking the inherent strength for an independent breakout. For the bullish case to materialize, an external dovish signal from the Fed is required to push XRP past $1.20, as the current chart structure does not suggest it can achieve this on its own.

    The current market environment for large-cap cryptocurrencies like Bitcoin, Ethereum, and XRP is characterized by consolidation, with these assets repeatedly testing resistance levels without significant breakthroughs. Macro catalysts and institutional inflows are consistently deferred to future timelines, leaving investors in a state of anticipation rather than active positioning.

    The Opportunity in Undiscovered Infrastructure

    Capital that has navigated multiple market cycles often operates on the principle of preemptive movement, acting before a trend is widely recognized. In contrast, small market cap infrastructure projects operate under different dynamics. A rotation that would be negligible for major cryptocurrencies can significantly reprice an undiscovered project. The potential for substantial returns lies in the gap between a project’s intrinsic value and its current market valuation, a gap that exists only while the project remains under the radar.

    LiquidChain: Addressing Multi-Chain Fragmentation

    The fragmentation across multiple blockchain ecosystems, including Bitcoin, Ethereum, and Solana, leads to value drain in decentralized finance (DeFi) through increased fees, slippage, and failed transactions for users bridging these networks.

    Claude AI predicts that LiquidChain offers a solution by unifying these networks within a single execution layer. This approach aims to enable a single deployment to reach every ecosystem, eliminating cross-chain taxes on interactions.

    LiquidChain’s presale is currently underway, having raised over $920,000 at $0.01454 per token. This project remains undiscovered by the broader market, presenting a significant opportunity.

  • PEPUSDT Perpetual Contract Lists with 25x Leverage

    PEPUSDT Perpetual Contract Lists with 25x Leverage

    Bybit Launches PEPUSDT Perpetual Contract

    Cryptocurrency exchange Bybit has announced the listing of its PEPUSDT Perpetual Contract, allowing traders to speculate on the price movements of PepsiCo Inc. (PEP) against Tether (USDT). Trading for the new contract is now live, offering leverage of up to 25x.

    The PEPUSDT Perpetual Contract is also accessible through Bybit’s suite of Futures bots, including Futures Grid, Futures Martingale, and Futures Combo.

    Contract Specifications:

    • Contract Type: USDT Perpetual Contract
    • Underlying Asset: PepsiCo Inc. (PEP)
    • Settlement Asset: USDT
    • Tick Size: 0.01
    • Maximum Leverage: 25x
    • Capped Funding Rate: 2%
    • Funding Fee Settlement Interval: Every 8 hours
    • Trading Hours: 24/7

    PepsiCo Inc.’s official website is https://www.pepsico.com/.

  • XRP Price Steady After Korean Police Nab Three in Scam Bust

    XRP Price Steady After Korean Police Nab Three in Scam Bust

    XRP Price Holds Steady Amidst South Korean Fraud Arrests

    XRP is currently trading around the $1.08 mark, having experienced a slight decline over the past 24 hours. Despite a significant fraud case unfolding in South Korea, the broader market has remained relatively stable. Authorities have apprehended three individuals connected to a fraudulent XRP staking scheme that defrauded 71 investors of 3.4 million XRP, valued at approximately 12.3 billion won. An Interpol Red Notice is still active for a fourth suspect believed to be overseas.

    The Seoul Metropolitan Police Agency reported that the group operated a deceptive website, Fxrpntwork.com. Through blog posts, online articles, and YouTube videos, they enticed investors with promises of monthly returns ranging from 1.5% to 1.8%. Investigators successfully traced the stolen XRP on-chain and managed to freeze the suspects’ digital wallets within three days of receiving the initial report. The alleged mastermind was arrested upon returning to South Korea, while two accomplices were apprehended as they attempted to flee within the country.

    South Korea’s Firm Stance on Crypto Fraud

    This incident underscores South Korea’s increasingly stringent approach to cryptocurrency-related fraud. Law enforcement agencies are actively pursuing scams that target retail investors through fictitious investment platforms. Authorities have also emphasized the inherent transparency of blockchain technology, noting how transaction records facilitated the swift tracing of the misappropriated funds.

    Despite the negative press surrounding the arrests, XRP has largely avoided a sharp sell-off, continuing to trade near its recent levels. This suggests that traders perceive the incident as an isolated criminal act rather than a systemic issue affecting the XRP network. However, market sentiment could shift if similar enforcement actions become more prevalent across the region.

    XRP Price Action and Technical Outlook

    XRP’s price has dipped below its recent trading range, now hovering around $1.08. The token reached an intraday high near $1.09 and found support around $1.05. This narrow trading band indicates a period of consolidation rather than a clear directional trend, with sellers currently maintaining an advantage.

    Support is established in the $1.05 to $1.06 zone, where buying interest has consistently emerged. Initial resistance has moved to $1.08, with $1.10 serving as the first significant hurdle. A sustained breach above this level could potentially pave the way for a move towards $1.20, though this would likely require increased buying volume.

    From a bullish perspective, XRP could reclaim the $1.10 level on convincing volume before targeting $1.20. The most probable scenario, however, involves continued sideways trading between $1.05 and $1.10 as investors await a new catalyst. A break below $1.05 could expose the psychologically important $1.00 level.

    The arrests in South Korea have removed a source of negative news without impacting the XRP Ledger itself. Traders have largely viewed the event as a criminal matter rather than a protocol-level concern. Currently, XRP’s price appears more influenced by macroeconomic expectations and overall market risk appetite than by isolated enforcement actions.

    Exploring Alternative Investment Opportunities

    At $1.08, XRP presents a reasonable entry point for long positions, though the potential upside from current levels is incremental, with a move to $1.20 representing an 11% gain. For investors seeking different risk-return profiles, early-stage infrastructure projects are now entering the discussion, not as replacements for XRP exposure, but as complementary diversification options.

    LiquidChain ($LIQUID), a Layer 3 infrastructure project, is positioning itself as a cross-chain liquidity layer, aiming to consolidate liquidity from Bitcoin, Ethereum, and Solana into a unified execution environment. Its core architecture features a Unified Liquidity Layer with single-step execution and a deploy-once design, allowing developers to build once and access multiple ecosystems without the fragmentation and risks associated with bridges.

    The LiquidChain presale is currently priced at $0.01485, having raised $920,000. Investors are advised to conduct thorough research before committing capital.

  • Grayscale CEO Sells $53K in GXRP Shares

    Grayscale CEO Sells $53K in GXRP Shares

    Grayscale CEO Files to Sell $53K of GXRP Shares

    Grayscale CEO Michael Mintzberg has filed a notice indicating his intention to sell shares valued at approximately $53,394.95, or $20.45 per share. Cantor Fitzgerald is managing the sale on the NYSE Arca.

    Mintzberg acquired these shares on October 3, 2024, through a private transaction directly with the issuer, paying in cash. He reported no prior sales of this security in the preceding three months. A Form 144 filing signifies an intention to sell and does not confirm a completed transaction.

    Mintzberg assumed the role of Grayscale’s CEO on August 15, 2024, joining from Goldman Sachs. This purchase occurred seven weeks into his tenure. At the time of its first anniversary in September 2025, the fund, which was a private placement for accredited investors, held close to $17 million across 301,500 shares.

    Other Insiders Also Filed Notices

    Two other Grayscale insiders filed similar notices for the same security in January. Barry Silbert, founder of Digital Currency Group and a 10% stockholder, reported 9,158 shares worth $336,373.34, held through a Roth IRA and managed by Capital Institutional Services.

    Additionally, Chief Legal Officer Craig Salm reported 7,123 shares valued at $266,970.04, held via Canaccord Genuity. Silbert’s notice specified OTCQX as the trading venue, while Salm’s and Mintzberg’s both named NYSE Arca.

    All three insiders purchased their shares within the same seven-week period in 2024. Silbert acquired 4,407 shares on September 14 and an additional 4,751 on October 4. Salm purchased 2,319 shares on October 8 and 4,804 on October 31.

    Share Price Decline Noted

    The January notices were both submitted to the SEC on January 26, with Salm signing his three days prior. These filings suggest share prices of $36.73 and $37.48, a notable contrast to the $20.45 price in Mintzberg’s notice, indicating a decline of approximately 44% over the six months between the filings.

    The January filings each listed 5,790,100 shares outstanding. Mintzberg’s recent notice lists 2,840,100 shares, representing a reduction of 2,950,000 shares, or 51%. At $20.45 per share, the remaining shares value the trust at nearly $58 million. This valuation places it behind category leaders such as Bitwise’s fund, valued at close to $500 million, and Canary’s XRPC fund, below $470 million.

    Fund’s Listing and Market Context

    Grayscale uplisted the fund eleven days after the first U.S. spot XRP ETF commenced trading on Nasdaq on November 13, 2025. GXRP shares began trading on NYSE Arca on November 24.

    Within the XRP fund category, seven of the ten business days leading up to July 19 recorded zero net flows for U.S. spot XRP funds, despite cumulative inflows of close to $1.5 billion since their launch.

    XRP was trading at $1.07 on July 30, a significant 70.5% decrease from its high of $3.65 reached on July 17, 2025.

  • Bitcoin’s Price Action Tested by Softening Demand and Economic Uncertainty

    Bitcoin’s Price Action Tested by Softening Demand and Economic Uncertainty

    Bitcoin’s recent price consolidation is being tested as demand shows signs of softening and broader economic uncertainties loom. The cryptocurrency, which had achieved a four-week winning streak, is now experiencing a loss of momentum, trading within a defined range.

    Last week, Bitcoin secured a 1% weekly gain, marking its fourth consecutive weekly advance for the first time since April. However, this upward momentum faltered midweek with a 5% decline from its weekly high of $67,000 reached on Tuesday. This pullback has reinforced overhead resistance, indicating that buyers are currently struggling to push Bitcoin beyond its recent trading boundaries.

    According to the latest Bitfinex Alpha report, the short-term holder cost basis has stabilized near $68,500. Analysts suggest this level has become a key resistance area that may likely require stronger demand for Bitcoin to break above. So far, this demand has remained limited, a trend reflected in various market indicators.

    Institutional Participation Weakens

    Evidence suggests institutional participation is waning. CME Bitcoin futures have fallen below $6 billion, and options volumes reached a September 2023 low. ETF flows also point to softer demand beneath the surface. While US spot Bitcoin ETFs recorded net inflows totaling $33.9 million over the past three weeks, they experienced significant outflows of $465.2 million on Thursday and Friday of last week. Notably, BlackRock’s IBIT saw net negative flows during this period.

    Further indication of subdued institutional interest comes from the Coinbase Premium Index, which has remained below zero for more than 60 consecutive trading days. Bitfinex described current market conditions as a typical summer slowdown, with 30-day spot trading volumes at approximately 62.4% of their yearly average.

    Economic Headwinds Mount

    Beyond weaker market activity, broader economic conditions are adding to the uncertainty surrounding Bitcoin’s outlook. Rising US diesel prices are contributing to increased transport and production costs, raising concerns that inflation could remain elevated. This potential for persistent inflation could complicate the Federal Reserve’s policy decisions. Futures markets currently assign about a one-in-three chance of a rate hike at this week’s FOMC meeting.

    Additionally, the US 10-year real yield has climbed to 2.43%, a level that could pressure risk assets. Amid these combined factors, Bitcoin remains range-bound between $63,000 and $68,500, awaiting stronger demand or fresh catalysts to break its current consolidation pattern.

    Key Uncertainties

    Several uncertainties remain regarding Bitcoin’s trajectory. It is unclear whether demand for Bitcoin may strengthen sufficiently to break above its recent trading range. Furthermore, the future path of Federal Reserve policy and the impact of rising inflation and interest rates on risk assets add to the overall uncertainty for Bitcoin’s outlook.

    Why This Matters

    The materials describe a narrow update: Bitcoin experienced a four-week winning streak, but recent price action indicates a loss of momentum. The extent to which demand for Bitcoin may strengthen remains uncertain.

    Broader Context

    Source materials place the factual news in this context: Bitcoin extended its positive run last week with a minor 1% weekly gain, marking its fourth straight weekly advance for the first time since April.

  • Robinhood Reports Record Revenue Driven by Prediction Markets and Robinhood Chain Amidst Crypto Decline

    Robinhood Reports Record Revenue Driven by Prediction Markets and Robinhood Chain Amidst Crypto Decline

    Robinhood announced its second-quarter 2026 financial results, reporting a record quarterly revenue of $1.31 billion, a 32% increase year-over-year. This growth was significantly fueled by new ventures, including prediction markets and the Robinhood Chain, even as the company experienced a decline in its cryptocurrency trading revenue and volumes.

    Key Growth Drivers Emerge

    According to Robinhood, transaction-based revenues rose 44% to $776 million. A key driver within this category was event contracts, which generated $156 million, marking a more than tenfold increase year-over-year. These contracts are part of Robinhood’s prediction markets, where users trade on real-world outcomes. CEO Vlad Tenev noted on X that the company hit all-time highs in trading volumes across equities, options, and prediction markets.

    In addition to prediction markets, Robinhood highlighted the performance of its Robinhood Chain. The public mainnet for the chain, described as an Ethereum layer-2 network for tokenized real-world assets, went live on July 1. Since its launch, it has seen over $12 billion in index volume and was clearing more than $600 million in daily decentralized exchange volume in its first 30 days, logging 138 million transactions. Tokenized stocks on the chain also saw rapid growth, increasing from $5 million to $60 million in daily volume in under two weeks.

    Crypto Performance Faces Headwinds

    Despite the growth in these new areas, Robinhood’s crypto revenue slid to $100 million in the second quarter of 2026, a 38% decrease from $160 million in the same period last year. Total crypto notional trading volume was $40 billion for the quarter, with $18 billion on Robinhood’s app (down 35% year-over-year) and $22 billion through Bitstamp. This represents a dip from $66 billion in crypto trading volume in the first quarter of 2026.

    Broader Financial Improvements

    Overall financial metrics showed improvement. Robinhood’s net income for the quarter was $573 million, or $0.62 per share, compared to $386 million, or $0.42 per share, a year prior. Platform assets grew to $369 billion from $307 billion. Quarterly net deposits increased to $21.7 billion from $17.7 billion, and Robinhood Gold subscribers rose to 4.8 million from 4.3 million.

    Diversification and New Products

    Other product developments contributing to the company’s performance include Rothera, a CFTC-licensed prediction markets exchange launched as a joint venture, which has processed over 3.5 billion contracts since late May. Agentic trading, a feature allowing automated trade execution, launched on May 27 and has attracted nearly 100,000 accounts. The Gold Card also surpassed 1 million cardholders, with $17 billion in annualized purchase volume.

    Robinhood reported that thirteen of its business lines now each generate over $100 million annually, underscoring a diversified revenue strategy. The company’s strategic shift towards prediction markets and blockchain initiatives appears to be a key factor in achieving record revenue, even as its cryptocurrency business faces challenges.

    Why This Matters

    The materials describe a narrow update: Robinhood announced its second-quarter 2026 financial results, showing record quarterly revenue of $1. The exact date of the Q2 2026 earnings report announcement.

    Broader Context

    Source materials place the factual news in this context: Robinhood reported second-quarter earnings Wednesday and posted record quarterly revenue of $1.31 billion in Q2, up 32% year-over-year, beating Wall Street’s estimate of $1.26 billion.

  • XRP Price Outlook: AI Scenarios Conditional on Regulatory Clarity, Market Faces Resistance

    XRP Price Outlook: AI Scenarios Conditional on Regulatory Clarity, Market Faces Resistance

    Microsoft Copilot AI has outlined potential scenarios for XRP’s price, including a projection of $5 to $8 by the end of 2026. However, this outlook is explicitly contingent on significant regulatory clarity and widespread institutional adoption, factors that current market data and historical price action suggest are not yet firmly in place.

    According to the analysis, a path to higher price levels for XRP would involve regulatory bodies like the SEC and CFTC recognizing XRP as a digital commodity, thereby resolving years of legal ambiguity. The AI’s analysis also cites potential billions in ETF inflows, led by firms such as BlackRock, and Ripple’s own business expansion, including its RLUSD stablecoin, tokenization partnerships with Archax, and XRP Ledger upgrades aimed at powering DeFi and real-world asset settlement, as key pillars supporting an optimistic view. Broader market conditions, such as potential easing by the Fed and a rally in Bitcoin, are also identified as macro tailwinds that could influence XRP.

    Conversely, the analysis outlines a scenario where XRP remains range-bound between $0.85 and $1.50 if regulatory clarity, such as the CLARITY Act, stalls. A significant sell wall at $1.44 is identified as a ceiling that has consistently rejected advances. Macro tightening, which could drain liquidity from the system, is also noted as a potential risk. The core question for the AI’s optimistic scenario to materialize is whether institutional adoption and tokenization flows translate into sustained demand rather than remaining announcements.

    Current Market Dynamics

    Currently, XRP’s price action appears to be navigating resistance levels. The asset closed at $1.05989, down 0.50%, in a session that saw prices range between $1.04395 and $1.06630. This level is near the $1.00 support. Resistance is observed stacking at $1.20, then $1.30, with a more significant ceiling near $1.44. XRP has not closed above $1.44 since May, indicating a persistent challenge in breaking through this level.

    Historically, XRP saw a peak near $2.40 in January, followed by a notable move in February from above $2.10 to under $1.70. For months afterward, the price compressed between approximately $1.30 and $1.60 before sliding toward $1.00 in June. A recovery attempt in July stalled near $1.20 before prices rolled back to current levels.

    For any part of the optimistic scenario to gain traction, XRP would first need to reclaim the $1.44 level. Until then, the current chart behavior is described as testing support rather than building toward a higher ceiling.

    LiquidChain: Addressing DeFi Fragmentation

    In a separate development, LiquidChain is mentioned as a project addressing cross-chain fragmentation in DeFi. The analysis notes that existing solutions often create a business model around the problem, whereas LiquidChain aims to unify three networks within a single execution layer, allowing simultaneous reach without cross-chain taxes. LiquidChain’s presale is currently priced at $0.01454, with over $860,000 raised. However, the article acknowledges that LiquidChain’s execution is unproven and its adoption remains an open question, contrasting with the established assets that may offer a smoother path toward visible market ceilings.

    The current situation underscores the uncertainty surrounding AI-driven market insights. While tools like Microsoft Copilot AI can identify potential scenarios and contributing factors, their outputs require careful interpretation within the context of current market data, historical performance, and prevailing risks. The distance between an asset’s perceived worth and its market assignment can shift, but the timing and catalysts for such shifts remain subjects of ongoing analysis and uncertainty.

    Why This Matters

    The materials describe a narrow update: Microsoft Copilot AI has issued a bullish prediction for XRP, forecasting a price of $5 to $8 by the end of 2026, contingent on regulatory clarity and institutional adoption. Whether institutional adoption and tokenization flows will materialize into sustained demand rather than remaining announcements.

    Broader Context

    Source materials place the market analysis in this context: Microsoft Copilot AI.

  • XRP Faces Downturn Risk Below $1 Without Key Breakout

    XRP Faces Downturn Risk Below $1 Without Key Breakout

    XRP Faces Renewed Selling Pressure as Key Support Tested

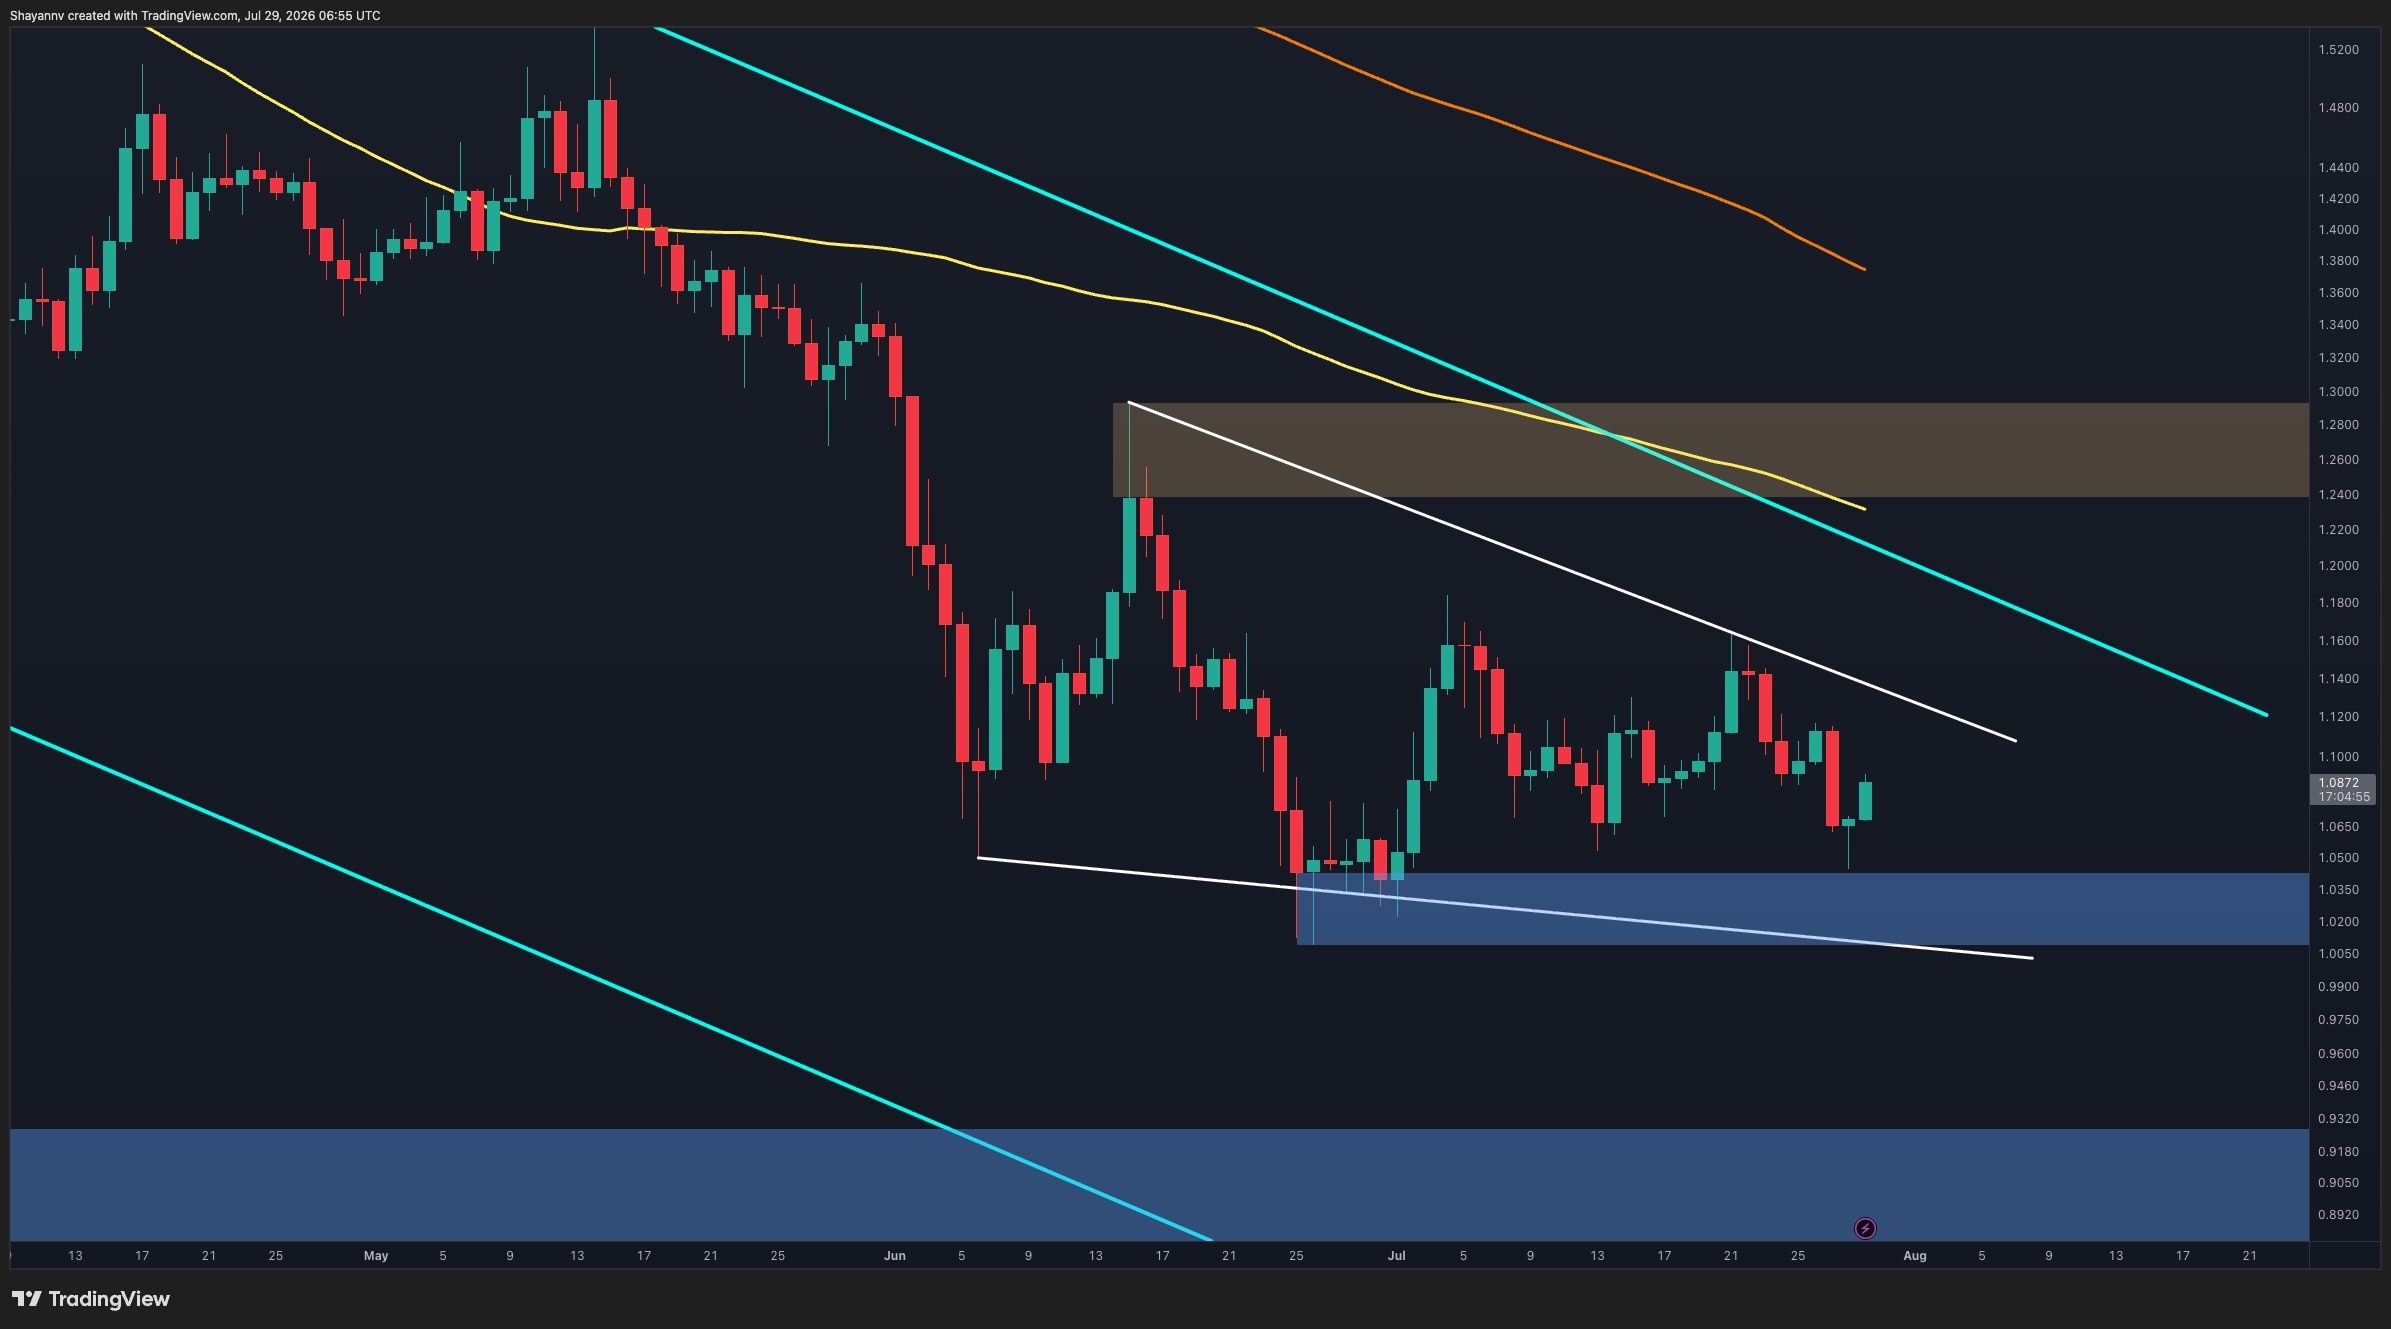
    XRP has encountered renewed selling pressure after failing to maintain its recent rebound, pushing the cryptocurrency back towards a critical support region. While buyers have intervened to halt the latest decline, the overall technical outlook suggests a cautious approach, with the asset trading below significant resistance levels.

    The daily chart continues to depict a bearish market structure. XRP is trading within a long-term descending channel and remains below both its 100-day and 200-day moving averages. The recent rejection from the upper bounds of this channel underscores the continued dominance of sellers in the broader trend.

    The demand zone between $1.02 and $1.04 has once again drawn in buyers, initiating the latest rebound. However, this recovery remains precarious as long as XRP stays below the descending trendline and the major resistance area around $1.24 to $1.28, where the moving averages also converge. A successful recapture of this zone would serve as the first significant indication of a potential shift in momentum favoring buyers.

    On the downside, a breach of the $1.02 to $1.04 support level would expose the broader demand zone near $0.89, potentially extending the current bearish trend.

    Short-Term Outlook

    The 4-hour timeframe highlights a recent breakdown below a yellow ascending trendline, confirming a loss of short-term control by buyers after they failed to sustain a series of higher lows. This breakdown precipitated a sharp decline into the $1.02 to $1.04 demand zone, where buying interest quickly resurfaced.

    The current rebound has propelled XRP back towards the $1.08 to $1.09 resistance area, a level that previously acted as support before the breakdown. This makes the current rally an important retest of former support now acting as resistance. As long as XRP remains below this zone, the recent bounce could be interpreted as a corrective recovery within the prevailing downtrend.

    A rejection from the current resistance would increase the likelihood of another move towards the $1.02 to $1.04 demand zone. Conversely, a decisive reclaim of the $1.08 to $1.09 region would improve the short-term outlook and potentially pave the way for a recovery towards the larger supply zone situated between $1.16 and $1.18.

  • Grok AI Forecasts Shocking SpaceX Stock Surge by 2027

    Grok AI Forecasts Shocking SpaceX Stock Surge by 2027

    Elon Musk’s Grok AI has forecast a significant re-rating for SpaceX, with its price prediction hinging entirely on the company’s execution catching up to its considerable hype. Flight 14, slated for August 2026, is anticipated to achieve the first stable orbital insertion alongside a ship tower catch – the critical milestone that would validate the vehicle’s performance as assumed in its current valuation.

    Key Milestones and Growth Drivers

    Successful demonstrations of propellant transfer and early orbital refueling are identified as the next crucial steps. Achieving these would unlock full reusability, enable payloads exceeding 100 tonnes, and facilitate the mass deployment of Starlink V3 satellites, with over 50 satellites per flight.

    This accelerated launch cadence is expected to supercharge more than just launch volume. Starlink’s Direct to Cell and satellite internet services, already generating an estimated $11 billion to $15 billion annually and reportedly profitable, are projected to surpass $20 billion in revenue.

    A second, distinct growth engine lies within SpaceX’s AI and compute infrastructure. Through its Colossus platform, xAI integration, and GPU leases with tech giants like Google and Anthropic, this segment’s revenue is modeled by Goldman Sachs and Morgan Stanley to climb from the low single-digit billions to between $15 billion and $35 billion by 2027.

    Financial Outlook and Market Sentiment

    The company’s first public earnings report in August 2026, coupled with increased clarity following lockup period expirations, are seen as pivotal events that will confirm this broader growth narrative. Total revenue is projected to surge from $39 billion in 2026 to approximately $65 billion to $75 billion in 2027. This growth is expected to be accompanied by a positive EBITDA trajectory, readiness of Florida launch pads, wins in defense contracts like the Golden Dome and Starshield, and continued progress on the Artemis Human Landing System (HLS).

    Current consensus price targets for SpaceX’s stock range between $225 and $300, with Morgan Stanley setting its target at $300 and some models projecting figures above $400. Grok AI interprets this gap as an opportunity for a potential doubling of the company’s current $1.5 trillion valuation, especially following the post-IPO market correction.

    Bear Case and Technical Analysis

    The bear case presents a more constrained outlook. Potential delays in Starship development, a significant supply of shares hitting the market after earnings due to lockup expirations, or valuation compression stemming from a high price-to-sales ratio and substantial capital expenditures could limit the stock’s movement, keeping it range-bound between $100 and $140.

    SpaceX shares closed at $116.44, a modest gain of 0.57%, after trading between $114.95 and $118.12. This small upward movement occurred near the bottom of a decline that has been largely uninterrupted since mid-June.

    The stock had reached a peak near $217 in mid-June before experiencing a sharp downturn. It fell steadily, with minimal relief rallies, until a brief attempt to rebound in late June and early July stalled just above $170. Selling pressure then resumed, driving the price down to its current levels.

    This persistent, low-volatility downward trend is distinct from a sharp crash, suggesting steady distribution rather than panic selling. This aligns with the bear case concern regarding the impact of lockup supply entering the market.

    Immediate support for the stock is found around $110, the recent low that shares have just tested. Below this level, there is limited recent chart history, with prices moving into territory not seen in the current trading window.

    Resistance levels are observed at $130, then $150, and a more significant ceiling near $170, where the early July bounce failed. While momentum appears to be tentatively stabilizing after weeks of decline, the chart does not yet indicate that selling pressure has fully abated.

    For Grok’s bullish outlook to gain traction, SpaceX shares must first reclaim the $170 level, a point the stock has not closed above in a month. Until this occurs, the current price remains considerably closer to the bear case range than to a trajectory that would support a move toward $225.

  • Durov Faces Russian Charges, GRAM Plunges

    Durov Faces Russian Charges, GRAM Plunges

    Russia Places Telegram Founder Pavel Durov on International Wanted List, Citing Terrorism Facilitation

    Russia’s Federal Security Service (FSB) has formally charged Telegram CEO Pavel Durov with facilitating terrorist activities and placed him on an international wanted list. The development sent the cryptocurrency GRAM, formerly known as Toncoin, lower in early trading and exacerbated its recent weekly losses. This move represents a significant escalation from France’s ongoing investigation into the platform, shifting the focus from content moderation to serious terrorism-related allegations.

    According to Reuters, the FSB alleges that Telegram failed to remove material used by Ukrainian intelligence and extremist groups to coordinate attacks within Russia. The charges reportedly stem from the platform’s alleged inaction regarding content used for sabotage, mass killings, and cyber fraud operations. Telegram’s official X account responded to the news by posting an image of Durov making an obscene gesture, but issued no written statement.

    Durov’s current whereabouts remain unclear. A May 16 post on Telegram indicated he was in Dubai, while a July 23 update suggested he was in Georgia and expected to return soon. He holds both Emirati and French passports and has not resided in Russia for over a decade.

    The initial decline in GRAM’s value appeared relatively contained compared to the market’s reaction to Durov’s arrest in August 2024. At that time, when French authorities detained him at Paris Le Bourget Airport, Toncoin plunged sharply before its subsequent rebrand to GRAM, erasing billions of dollars from its market capitalization. The more muted reaction this time suggests investors may have already factored in some level of founder-related risk.

    However, the terrorism allegations introduce a significantly different dynamic. Even without publicly disclosed evidence beyond Russia’s borders, the charges raise new concerns for financial institutions, fiat on-ramps, and exchanges that support GRAM. The token’s 2026 rebrand revived its original identity and more closely aligned it with Durov’s long-term vision, creating less separation between the founder’s legal challenges and the token’s narrative.

    In contrast to the French investigation, which centers on Telegram’s alleged cooperation with law enforcement, Russia’s case is framed around state security and wartime terrorism. While Russia has placed Durov on an international wanted list, it remains uncertain whether other countries will act on this designation. This development follows months of increasing pressure, including reports of an existing terrorism-related investigation and an April summons delivered to a former Russian address.

    The political context further complicates the situation. Russia has repeatedly attempted to restrict Telegram since 2018, even as it continues to utilize the platform for official communications. In April, Durov stated that authorities appeared to accuse him of defending constitutional protections for free speech and private correspondence, adding that he was proud to be guilty of such actions. He has not publicly commented on the latest charges.

    The immediate concern for GRAM is whether the terrorism allegations will prompt compliance-driven restrictions from exchanges or payment providers operating under Anti-Money Laundering (AML) and Counter-Terrorist Financing (CFT) regulations. Despite Telegram’s reported user base exceeding one billion, which could still support adoption, the founder’s legal situation is likely to remain a persistent source of headline risk. For now, markets appear more focused on the ongoing uncertainty than on a swift resolution.