Tag: Market Trends

  • Perpetual Trading: A Double-Edged Sword

    Perpetual Trading: A Double-Edged Sword

    Perpetual Futures Gain U.

    S. Foothold, Amplifying Risk and Reward

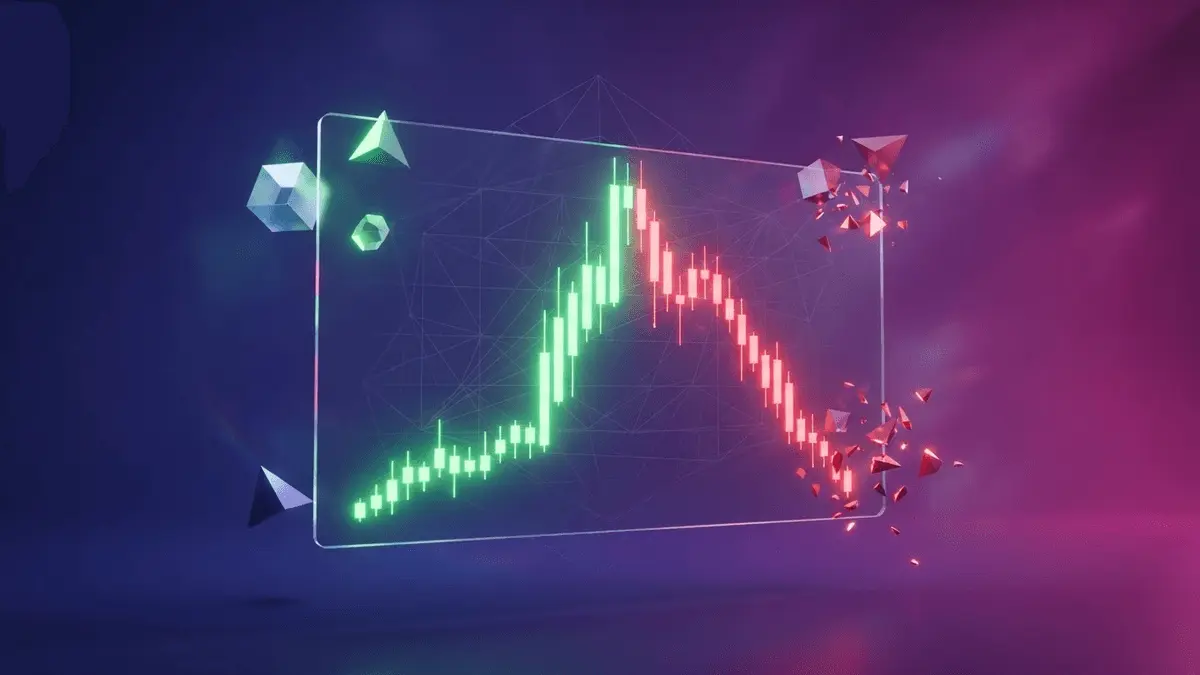
    The Trump administration’s decision to permit highly leveraged perpetual futures trading in American markets represents a significant structural shift, potentially drawing more capital and retail participation into an instrument notorious for its rapid wealth creation and destruction. Crypto derivatives desks are already adapting to this new landscape, but the crucial question remains: do traders truly grasp the instruments they are engaging with?

    This regulatory approval is a watershed moment. Previously, many U.S. traders sought access through offshore platforms like Binance, Bybit, and OKX, accepting heightened counterparty and jurisdictional risks. Bringing perpetual futures onshore introduces clearer compliance frameworks and is expected to attract greater institutional involvement. While the risks associated with high leverage remain unchanged, the increased accessibility may make these instruments feel more commonplace. A 10% market move, which spot traders might absorb over time, can obliterate a 50x leveraged position before the day is out.

    Leverage’s Double-Edged Sword

    Perpetual futures trading prioritizes margin management over conviction. Leverage magnifies both profits and losses, leaving scant room for error or hesitation. When employed judiciously, it can significantly amplify returns. However, imprudent use can swiftly transform fortunes, turning successful traders into cautionary tales.

    Bitcoin has served as a stark illustration of this dynamic. Rallies fueled by perpetual futures often outpace spot-driven movements due to the compounding effect of leverage. Each liquidation of a short position adds fuel to the upward momentum, until the tide turns and overleveraged long positions are forcibly unwound. This pattern is also evident in mid-cap and meme coins, where thinner liquidity amplifies the impact of each price squeeze.

    The increased accessibility for U.S. retail and institutional investors could inject fresh capital, boost open interest, and enhance price discovery. Assets with active communities and compelling narratives may stand to benefit the most. Nevertheless, leverage has a tendency to fuel exuberance before presenting a substantial bill.

    Volatility is likely to remain tethered to major macroeconomic data and Federal Reserve policy decisions, rather than adhering to predictable trends. The most severe scenario involves a macroeconomic shock triggering a synchronized long squeeze, where leverage accelerates losses and cascading liquidations overwhelm trading books.

    Navigating the Risk Landscape

    Three key metrics define the current risk environment: funding rates, open interest relative to spot volume, and liquidation clusters around critical price levels. These indicators should be closely monitored before chasing chart patterns. Traders who disregard funding rates while fixated solely on price charts are akin to drivers checking their rearview mirror on a sharp turn.

    This environment is particularly attractive to early-stage, high-narrative assets. When leverage is readily available and inexpensive, speculative capital often gravitates towards assets offering the potential for significant multipliers, rather than established blue-chip investments. Presale-stage projects with robust community engagement have historically captured this speculative energy before its potential is fully priced in.

    Maxi Doge ($MAXI), a meme token on Ethereum, is built on this premise, embracing the 1000x leverage trading mentality. The project has raised $4.8 million, with its presale price currently at $0.000283. It features a staking model offering dynamic APY for holders.

    The core mechanics include trading competitions exclusively for token holders with leaderboard rewards, a Maxi Fund treasury designated for liquidity provision and partnerships, and marketing strategies rooted in meme culture and a “gym-bro” aesthetic. The community aspect is presented as the primary product, with the token serving as the access mechanism.

    For traders already accustomed to thinking in terms of leverage and asymmetric payoff structures, the logic of entering an early-stage presale is familiar. Investors are encouraged to research Maxi Doge before the presale window concludes.
  • GhostSwap Offers No-KYC Zcash to Monero Swaps Amid Privacy Coin Scrutiny

    GhostSwap Offers No-KYC Zcash to Monero Swaps Amid Privacy Coin Scrutiny

    GhostSwap provides a direct, non-custodial platform for users to swap Zcash (ZEC) to Monero (XMR) without requiring Know Your Customer (KYC) verification for standard transactions. This service acts as a bridge between the two privacy-focused cryptocurrencies, appealing to users who prioritize anonymity and the flexibility to rotate assets.

    Why This Matters

    The materials describe a narrow update: GhostSwap offers a non-custodial platform for users to swap Zcash to Monero without requiring Know Your Customer (KYC) verification. The exact timing for ZEC to XMR swap completion depends on Zcash network confirmations, Monero confirmations, and network congestion.

    Broader Context

    Source materials place the factual news in this context: Zcash’s Orchard implementation has increased interest in how users move between different privacy-focused assets, including swaps between Zcash and Monero.

    How GhostSwap Facilitates Swaps

    Users send ZEC to a temporary address provided by GhostSwap. The platform then converts these funds to XMR and sends them to the user’s designated destination address. GhostSwap charges a 2% fee, which is integrated into the exchange rate displayed to the user. Beyond this fee, users are also responsible for standard blockchain network fees associated with both Zcash and Monero transactions.

    GhostSwap states that most privacy coin swaps are completed within approximately 5 to 30 minutes. This timeframe is influenced by factors such as the required confirmations on the Zcash and Monero networks, as well as overall network congestion. Emphasizing its operational model, GhostSwap highlights that it is a non-custodial platform. This means it does not retain long-term custody of user funds; instead, each swap uses a temporary deposit address, and funds are directly routed to the user’s wallet, thereby reducing risks common to centralized exchanges that hold pooled assets.

    Potential Compliance and Privacy Considerations

    While GhostSwap advertises a no-account, no-KYC process for standard swaps, the platform’s terms note that compliance screening may occur through its underlying partners. GhostSwap collaborates with licensed crypto processing partners to conduct Anti-Money Laundering (AML) and sanctions screening. Consequently, GhostSwap reserves the right to block, reject, or refund transactions if they are flagged for reasons such as high value or appearing on a blacklist. Users should be aware that these compliance checks are handled behind the scenes and may occasionally result in transactions being flagged.

    Zcash and Monero: Different Privacy Approaches

    Zcash and Monero represent distinct philosophies in privacy-preserving technology. Zcash employs zk-SNARKs, shielded addresses, and zero-knowledge proofs, offering optional privacy through its shielded transactions. Its Orchard implementation serves as the third-generation shielded pool, engineered for enhanced efficiency and modern cryptography. In contrast, Monero enforces mandatory privacy, utilizing ring signatures, stealth addresses, and RingCT by default to ensure all transactions are private.

    GhostSwap reports having processed over $750 million in swaps for approximately 1.5 million users. The platform is registered as a Delaware LLC. Its support for both ZEC and XMR, coupled with features like a public API and a Telegram bot, aims to provide a practical solution for users looking to exchange between privacy assets without the necessity of creating exchange accounts or undergoing KYC procedures.

    It is important for users to understand that while GhostSwap facilitates these swaps, the exact completion time can vary, and potential compliance checks by partners may impact transactions. Additionally, users incur standard blockchain network fees in addition to GhostSwap’s 2% fee.

  • Bitcoin and Ethereum ETFs See Recovery in Net Inflows, Ethereum Outperforms

    Bitcoin and Ethereum ETFs See Recovery in Net Inflows, Ethereum Outperforms

    Spot Bitcoin and Ethereum Exchange Traded Funds (ETFs) experienced net inflows last week, signaling a recovery after prolonged periods of outflows. Notably, Ethereum ETFs attracted more capital than their Bitcoin counterparts, indicating stronger recent performance.

    Last week, Spot Bitcoin ETFs recorded net inflows totaling $75.67 million. This marks a turnaround from an eight-week streak of substantial withdrawals, during which the funds lost over $8 billion in approximately two months. Prior to this recovery, cumulative net inflows for Spot Bitcoin ETFs had decreased from $59.34 billion to $51.08 billion before recovering to $51.35 billion as of July 17.

    While Monday saw a net outflow of $424.66 million for Spot Bitcoin ETFs, investor behavior shifted in the subsequent days. Data from SoSoValue shows that fresh capital flowed into the funds, with inflows of $181 million on Tuesday, $107.8 million on Wednesday, $79.15 million on Thursday, and $132.30 million on Friday. This cumulative activity resulted in positive net inflows for the week.

    Spot Ethereum ETFs also demonstrated a positive trend, attracting $105.44 million in net inflows last week, surpassing Bitcoin ETFs. This performance builds on the previous week’s inflows of $84.42 million. Similar to Bitcoin ETFs, Ethereum ETFs had experienced an eight-week period of outflows, losing over $1.1 billion in cumulative net inflows, which fell from $12.09 billion to $10.89 billion. Following two consecutive weeks of positive inflows in mid-July, the cumulative net inflows for Spot Ethereum ETFs rose to $11.08 billion.

    Last week, Spot Ethereum ETFs saw a modest net outflow of $15.41 million on Monday and $28.04 million on Thursday. However, these were offset by net inflows of $58.34 million on Tuesday, $53.83 million on Wednesday, and $36.73 million on Friday.

    The recent shift from sustained outflows to net inflows for both Bitcoin and Ethereum ETFs may suggest a change in investor sentiment. While both asset classes are showing signs of recovery, the stronger performance of Ethereum ETFs in the past week indicates a potential short-term preference. However, the long-term sustainability of this recovery remains uncertain, as do the precise impacts of external factors on daily fund flows.

    Why This Matters

    The materials describe a narrow update: Spot Bitcoin ETFs recorded net inflows of $75. The long-term sustainability of the recent recovery for Bitcoin ETFs.

    Broader Context

    Source materials place the factual news in this context: After a violent eight-week streak with nothing but substantial withdrawals, the spot Bitcoin ETFs changed their course in the middle of July and now extended their recovery period with another green performance.

  • XRP ETFs Show Increased Zero-Flow Days Amidst Fluctuating Net Inflows

    XRP ETFs Show Increased Zero-Flow Days Amidst Fluctuating Net Inflows

    Ripple (XRP) ETFs have recently experienced a notable increase in trading days with no reportable flows, a trend that has emerged despite intermittent net inflows. This development raises questions about sustained investor engagement and the consistency of data reporting for these financial products.

    In the second week of July, Spot XRP ETFs experienced a net outflow of just over $7 million. In the past week, however, XRP ETFs recorded net inflows totaling $6.78 million. This figure was entirely concentrated on a single day, July 16.

    More significantly, the past week saw four out of five trading days with no reportable action. This pattern extends over a longer period, with seven of the last ten business days registering zero net flows. According to SoSoValue, this frequency of zero-flow days is a point of observation, with four occurring within a single week for the first time.

    Prior to this recent activity, XRP ETFs had maintained a strong performance, enjoying a nine-week streak of net inflows that accumulated nearly $200 million. The cumulative total net inflow for XRP ETFs now stands at approximately $1.5 billion. Individual ETFs, such as Bitwise’s XRP ETF, hold significant assets under management (AUM), with Bitwise’s nearing $500 million and Canary Capital’s XRPC holding below $470 million.

    Analysts suggest that several factors may be contributing to the current trends. The overall market may be experiencing a “sluggish summer season,” traditionally characterized by lower trading volumes as investors adopt a more cautious stance. Additionally, XRP’s own price performance, which has seen it remain down by 3% monthly and struggle to break above the $1.10 resistance level, could also be influencing investor decisions.

    While the resumption of net inflows, albeit concentrated on one day, indicates some level of investor interest, the increasing number of zero-flow days is a point of observation. The lack of reportable data for multiple days suggests a potential decline in active investor interest and demand for these financial products. The exact reasons for this increase in zero-flow days remain uncertain, as does whether the current inflows represent a sustained trend or a temporary rebound. The precise impact of market seasonality and XRP’s price action on investor behavior also requires further observation.

    Why This Matters

    The materials describe a narrow update: Spot XRP ETFs experienced a net outflow of over $7 million in the second week of July, breaking a two-month streak of inflows. The exact reason for the increase in zero-flow days.

    Broader Context

    Source materials place the factual news in this context: For roughly two months, during which the spot Bitcoin and Ethereum ETFs bled heavily, with billions of dollars leaving both, the XRP counterparts enjoyed investors’ attention by gathering fresh capital.

  • Pi Network’s PI Surges 20%: Recovery or Dead Cat Bounce?

    Pi Network’s PI Surges 20%: Recovery or Dead Cat Bounce?

    Pi Network’s native token has unexpectedly surged in cryptocurrency markets, reaching a weekly high of approximately $0.10. This sharp increase comes as a surprise, given the token’s recent performance, which saw it repeatedly hit new all-time lows. The central question now is whether this marks a significant recovery or a temporary rebound.

    Over the past week, CryptoPotato has extensively covered the declining price trajectory of Pi Network’s PI token. The asset had fallen below the crucial $0.10 support level last weekend, allowing bears to dominate the market. In the subsequent days, the price was further pushed below $0.09 and $0.08.

    The PI token only began to rebound after hitting a low of $0.07, a level that proved to be strong support. This marked a new all-time low, signifying a plunge of over 97% from its peak price more than a year ago, but the recovery was immediate.

    As reported previously, the token demonstrated resilience, climbing back above $0.08. It maintained this level for approximately 24 hours before embarking on its current rally. The token has since jumped by nearly 20%, bringing it close to the $0.10 mark for the first time in a week. This level now represents a key resistance point that must be overcome for any substantial rebound to occur.

    While today’s unexpected but notable surge has injected some optimism among investors, PI’s history suggests caution. The token has experienced similar gains on multiple occasions, particularly after extended periods of decline. However, these rallies have often been short-lived, with the token crashing back to its initial levels or even lower within days. A recent example occurred in mid-March, when the token surged from $0.20 to $0.30 amid excitement surrounding its listing on Kraken.

    This rally was quickly met with rejection, and the token plummeted below $0.20 within 72 hours. It has struggled to regain its previous valuation since then, a fact underscored by its recent drop to $0.07. Pi Network investors and supporters will be closely watching to see if this current rally proves to be different.

  • Grok AI’s XRP Prediction: Navigating Uncertainty in Crypto Forecasting

    Grok AI’s XRP Prediction: Navigating Uncertainty in Crypto Forecasting

    Grok AI has issued a price prediction for XRP, forecasting potential movements within the next 30 days. However, the AI’s projections are heavily contingent on a confluence of unconfirmed future events and prevailing market dynamics, underscoring the inherent ambiguity in cryptocurrency forecasting.

    Current Market Snapshot

    XRP recently closed at $1.08468, marking a slight decrease of 0.14% in a session that saw prices range between $1.07840 and $1.09495. Verified data indicates support levels for XRP at $1.00 and $1.05, with resistance observed between $1.18 and $1.22. The Relative Strength Index (RSI) momentum stands at 44.55, with its signal line at 47.03. This RSI data presents a narrow negative gap that has been observed to be narrowing over the past week, suggesting a potential easing of selling pressure, though positive momentum has not yet been reported.

    Factors Influencing the Forecast

    The AI’s prediction hinges on several factors, including anticipated spot ETF inflows, Ripple obtaining a full MiCA license for European expansion, increased activity on the XRPL network, and accumulation by large holders (whales). Additionally, Grok AI notes historical July performance for XRP, which has often seen positive movement. Exchange balances are reportedly dropping as coins are moved into cold storage, a sign often interpreted as reduced selling pressure.

    Limitations and Potential Risks

    However, the AI’s forecast is not without significant caveats. For XRP to reach the predicted higher targets, such as $1.25, it must first overcome the established resistance at $1.20 and maintain that level. Grok AI’s base scenario, absent new catalysts, suggests a more subdued price range of $0.95 to $1.10. Potential downside risks include broader market weakness or delays in regulatory developments like the CLARITY Act, which could cap gains and force consolidation. The prediction’s validity is thus tied to the arrival of new, positive news or catalysts; without them, Grok AI’s own analysis points to consolidation within the current trading range.

    Historical Context

    Historically, XRP has experienced significant volatility. The cryptocurrency saw a sharp decline in February, falling from above $2.30 to around $1.20. Subsequent price action saw tops near $1.55 in both April and May, followed by a bounce in July that reached near $1.20 before facing resistance. Grok AI’s analysis suggests that the current market phase, while showing some signs of easing selling pressure, is characterized by range compression rather than a clear upward trend, with three failed attempts to reclaim higher ground since February.

    Uncertainty Remains Key

    The broader market context shows Bitcoin, Ethereum, and XRP facing similar resistance levels. While institutional money is anticipated in the next quarter, the immediate price action for XRP appears dependent on specific developments. It is important to note that AI predictions, including Grok’s, should be viewed as analytical tools rather than definitive forecasts. The cryptocurrency market remains highly speculative, and factors such as regulatory changes, macroeconomic shifts, and technological developments can significantly impact price movements. Grok AI’s own analysis highlights that the prediction relies on external events, not just existing momentum.

    Broader Market Observation

    Separately, Grok AI has identified LiquidChain as a project worth watching, noting its potential to unify multiple networks within a single execution layer and eliminate cross-chain transaction costs. However, the adoption and execution of such a project remain open questions, distinct from the immediate analysis of XRP’s price action.

    Why This Matters

    The materials describe a narrow update: Grok AI has made a prediction regarding XRP’s price movement over the next 30 days, suggesting a potential rise to between $1.25 and $1.35, with a high of $1.40 under favorable conditions. The AI also outlines potential downside risks and a base scenario. Whether XRP will clear $1.20 and hold above it within 30 days remains uncertain, as does the impact of broader market weakness or delays to the CLARITY Act on XRP gains. The prediction’s validity is tied to the arrival of new, positive news or catalysts, not solely on existing momentum.

  • XRP: Can it Defend $1 Next Week?

    XRP: Can it Defend $1 Next Week?

    XRP Price Prediction: Can XRP Hold $1 Next Week?

    XRP is currently trading in a tight range between $1.08 and $1.10, a price point that offers little cause for celebration among bullish investors. The cryptocurrency remains firmly below its 50-day, 100-day, and 200-day exponential moving averages (EMAs), which are situated at approximately $1.15-$1.16, $1.24-$1.25, and $1.45-$1.46, respectively. This technical setup leaves the $1.00 to $1.02 zone as the critical support level that traders are closely monitoring.

    Recent inflation data provided a brief uplift in risk appetite across financial markets, but XRP showed minimal reaction. While equities embraced the softer economic backdrop, XRP continued its sideways drift as traders opted to remain on the sidelines. In some instances, the market appears to shrug off positive news.

    Open interest in perpetual futures has been on a steady decline, indicating a weakening speculative demand. Similarly, exchange-traded fund (ETF) inflows have decelerated, with assets under management hovering below the $900 million to $1 billion mark. Retail participation has yet to rebound significantly, leaving the market’s momentum lacking substantial fuel.

    Despite these headwinds, XRP’s momentum remains neutral rather than overtly bearish. The daily Relative Strength Index (RSI) is positioned between 44 and 46, suggesting that neither buyers nor sellers currently hold a dominant position. This equilibrium shifts the focus away from potential breakout scenarios. Instead, traders are now questioning whether XRP can successfully defend the psychologically significant $1.00 to $1.02 area before sellers exert further downward pressure.

    Navigating the Current Market Dynamics

    XRP is currently trading between $1.08 and $1.10, with 24-hour trading volume ranging from $1.0 billion to $1.1 billion. While this activity is considered healthy, the volume still lacks the decisive punch typically required to confirm a sustained trend. The recent failure to defend the $1.10 to $1.11 zone stands out as a key technical development. This area briefly served as support, but its loss has put buyers back on the defensive.

    The current configuration of EMAs continues to impede a swift recovery. The 20-day, 50-day, and 200-day EMAs are acting as overhead resistance, capping any upward attempts. Consequently, every bounce in price is met with immediate selling pressure. While sellers are not overwhelming the market, they are effectively dictating the price action.

    The path for a bullish resurgence remains clear: buyers must defend the $1.08 to $1.10 range and then reclaim the $1.15 to $1.17 zone with conviction and significant volume. Positive regulatory developments could also provide a catalyst, though the price action would still need to validate such optimism. Hope is readily available, but sustained upward movements typically require substantial capital.

    The most probable scenario at present is a period of consolidation, with XRP trading sideways between $1.08 and $1.16. However, if the $1.10 to $1.11 level re-establishes itself as firm resistance, attention will likely shift towards the $1.02 to $1.04 area. A breach of this support could bring the $0.99 to $1.00 zone back into focus, a level where trading sentiment often becomes more emotional than technical.

    The RSI, currently hovering around 51 to 53, reflects neutral momentum, indicating no decisive advantage for either buyers or sellers. In such an environment, patience often proves more valuable than prediction. While longer-term models suggest a constructive outlook, short-term traders are likely focused on whether the $1.00 mark can hold before contemplating a significant rally.

    For large-cap assets like XRP, when they are trading below key moving averages and experiencing weakening institutional flows, the risk-adjusted case for holding them begins to face competition from the opportunity cost of investing in assets with higher growth potential. This dynamic is prompting some active traders to reallocate capital towards investments where asymmetry is more favorable.

  • Bitcoin Hovers Near $65,000 Amidst Weekly Volatility; Altcoins Show Mixed Performance

    Bitcoin Hovers Near $65,000 Amidst Weekly Volatility; Altcoins Show Mixed Performance

    Bitcoin is trading near the $65,000 mark this week, following a period of significant price fluctuations and mixed performance across the broader cryptocurrency market. While Bitcoin consolidates, various altcoins have demonstrated divergent trends, with some registering gains and others experiencing declines.

    Bitcoin’s Price Action

    Over the past week, Bitcoin’s price has been dynamic. It approached $65,000 after recovering from a dip to $63,700 yesterday. The previous weekend saw Bitcoin stabilize around $64,000 for two days. A notable downturn occurred on Monday morning, with the market falling to $61,800. This was followed by a recovery on Wednesday, reaching $65,600, its highest price in approximately three weeks. This recovery followed the announcement of softer-than-expected CPI numbers for June on Tuesday. However, Bitcoin’s price fell back towards $62,000 on Thursday and Friday. Yesterday, it regained some ground to $64,000, and earlier today, it climbed closer to $65,000.

    According to CoinGecko (CG), Bitcoin’s market capitalization has risen to nearly $1.3 trillion, and its dominance over altcoins has increased to over 57%.

    Altcoin Performance Overview

    Ethereum also saw price movements this week, reaching almost $1,950 earlier in the week. Despite a subsequent drop of nearly $100 from its recent peak, Ethereum remains up by 4.2% compared to last Sunday. ZEC has been a notable performer among larger-cap cryptocurrencies, gaining 9% to trade at $560. Other cryptocurrencies such as Litecoin (LTC), Ondo (ONDO), and Crypto.com Coin (CRO) have also shown increases, with CRO’s native token rising up to 8%. In contrast, HYPE has experienced a decline of over 9%, though it has maintained support around the $60 level. Bitcoin Cash (BCH), Compound (CC), TAO, and Aave (AAVE) have recorded losses since last Sunday.

    Market Context and Capitalization

    The total cryptocurrency market capitalization has seen an increase, rising by approximately $60 billion since this time last week. It currently stands above $2.270 trillion on CG.

    Uncertainties remain regarding Bitcoin’s ability to sustain its price above $65,000, a level considered key for its short-term performance. The future performance of various altcoins also presents an evolving picture within the broader market.

    Why This Matters

    The materials describe a narrow update: Bitcoin has experienced price fluctuations, currently aiming for $65,000 after recent dips and recoveries. Whether Bitcoin may maintain its climb above $65,000.

  • XRP’s 13-Year Top 10 Streak: A Constant in Evolving Crypto Market

    XRP’s 13-Year Top 10 Streak: A Constant in Evolving Crypto Market

    XRP has maintained a consistent position among the top 10 cryptocurrencies by market capitalization for 13 consecutive years, a feat unmatched by any other altcoin besides Bitcoin. This enduring presence underscores its resilience through significant market volatility and regulatory challenges.

    According to an analysis by CoinGecko, XRP, alongside Bitcoin, is the only digital asset to have remained within the top 10 by market cap from 2014 through the projected year of 2026. This remarkable streak has persisted through multiple market downturns, including the 2018 bear market, the COVID-19 crash, the Terra collapse, and the FTX bankruptcy. Notably, XRP has held its ranking despite the ongoing legal action initiated by the U.S. Securities and Exchange Commission (SEC) against Ripple.

    The cryptocurrency landscape has transformed considerably since 2014. Bitcoin’s market share, which stood at approximately 87% in 2014, has decreased to under 57% on CoinGecko, indicating a broader diversification and maturation of the market. Hundreds of projects have entered and exited the spotlight, with many early prominent cryptocurrencies falling out of the top rankings.

    In contrast to Bitcoin’s declining dominance, stablecoins have become a permanent fixture within the top 10 and 20 cryptocurrencies. Exchange tokens like BNB have also solidified their positions alongside traditional layer-1 networks. This year, Hyperliquid’s HYPE token entered the top 10, overtaking Dogecoin and marking a significant milestone for decentralized finance (DeFi) projects.

    Despite its consistent ranking, XRP has experienced considerable price fluctuations. The token reached an all-time high of $3.65 last July but has since seen a 70% decrease. Following the SEC’s action, XRP faced delisting from numerous exchanges, which coincided with a sharp price decline at the time.

    The sustained presence of XRP in the top 10, as reported by CoinGecko, may suggest a degree of market stability and investor confidence, even when navigating regulatory scrutiny. However, it remains uncertain whether XRP will continue this streak for a 14th year. The analysis period extends to 2026, and barring a major market collapse, the cryptocurrency is positioned to potentially extend its record.

    It is important to note that the CoinGecko report analyzed annual market-cap snapshots between 2014 and 2026. While XRP’s consistency is a notable observation, the future performance of any cryptocurrency, including XRP, remains subject to market dynamics and regulatory developments. The exact timing of the SEC’s offensive against Ripple and the specific release date of the CoinGecko report are not detailed in the provided information.

    Why This Matters

    The materials describe a narrow update: A report by CoinGecko analyzed annual market-cap snapshots from 2014 to 2026 and found that XRP, alongside Bitcoin, has been the only cryptocurrency to consistently stay within the top 10 by market capitalization for 13 consecutive years. Whether XRP will continue its streak in the top 10 for a 14th year.

    Broader Context

    Source materials place the factual news in this context: The report by CoinGecko is not new and was released over a month prior to the article’s publication.

  • Prediction Markets Shatter Records in June 2026 Driven by Sports, New Platforms Emerge

    Prediction Markets Shatter Records in June 2026 Driven by Sports, New Platforms Emerge

    Prediction markets saw an unprecedented surge in trading volume in the second quarter of 2026, with June alone recording a record $50.7 billion in notional volume. This figure represents a 92% increase compared to the average monthly volume of $27.5 billion over the preceding five months. The total notional volume for Q2 2026 reached $113.8 billion, marking a substantial 48.7% rise from the first quarter. CoinGecko attributed this dramatic spike directly to the influx of major sporting events that began in late May.

    The impact of these events was particularly evident on Polymarket, where sports-related contracts accounted for 81% of trading volume in June, a significant jump from 40% in January. Despite this surge in event-driven activity, Polymarket’s overall market share decreased from 35.8% in Q1 2026 to 30.2% in Q2.

    In contrast, Kalshi solidified its leading position, expanding its market share from 42.4% in the first quarter to nearly 58.9% in the second. The competitive landscape also welcomed Rothera, a joint venture between Robinhood and Susquehanna International Group. Launched in May, Rothera quickly achieved $2.1 billion in notional volume in June, establishing a notable presence.

    New platforms and offerings are also entering the market. Cboe Global Markets launched its prediction markets platform, Cboe Predicts, in June. This new platform features securities-based binary option contracts tied to the Mini-S&P 500 Index, enabling traders to take a “yes” or “no” position on whether the index will settle at or above a specified level at expiration. According to the report, Cboe’s contracts are currently accessible through Interactive Brokers, with Charles Schwab expected to provide access in the coming months.

    Meanwhile, major technology companies are exploring the prediction market space. The New York Times reported that Meta is developing a standalone prediction markets app called Arena. This app would allow users to predict real-world outcomes using points instead of real money. This experimental project is reportedly a high priority for CEO Mark Zuckerberg and may eventually expand to include real-money betting. This initiative follows Meta’s earlier points-based platform, the Forecast app, which was launched in 2020 and discontinued in 2022.

    The current surge in prediction market activity, fueled by major sporting events and the introduction of new platforms and technologies, highlights a dynamic and expanding market. The increasing competition and the exploration of new applications by tech giants signal a maturing landscape for prediction markets.

    Why This Matters

    The materials describe a narrow update: Prediction market notional volume increased significantly in Q2 2026, culminating in a record $50. The exact date of Meta’s Arena app launch.

    Broader Context

    Source materials place the factual news in this context: Sports Events Push Prediction Market Trading to Record Highs in June.