Tag: Market Trends

  • XRP Surges 5% as Analysts Declare Ripple’s Moment Arrived

    XRP Surges 5% as Analysts Declare Ripple’s Moment Arrived

    Bitcoin Surges Past $66,000, Altcoins Follow as XRP Shows Signs of Life

    The cryptocurrency market experienced a notable uptick on Tuesday morning, with Bitcoin reaching a multi-week high above $66,000. A wave of altcoins followed suit, including the widely watched cross-border payment token.

    Analysts, who have frequently commented on the token’s performance, were quick to point to a resurgence of optimism, with some offering exceptionally bullish price predictions.

    Crypto analytics platform CW was among the first to signal positive momentum for XRP, indicating it was “breaking through the sell walls.” According to their analysis, significant resistance levels were identified at $1.13-$1.14, which the token was testing, followed by another hurdle at approximately $1.16, and a final major barrier at $1.20.

    Ali Martinez also emphasized the importance of the $1.13 resistance, noting it had previously capped the token’s breakout attempts over the past month. The analyst predicted that a decisive move above this level “could confirm the bullish breakout and open the door for further upside.” Martinez’s chart suggested potential short-term targets reaching up to $1.30.

    EGRAG CRYPTO presented the most optimistic outlook, focusing on the asset’s long-term potential. Based on a “triple-bottom roadmap,” EGRAG projected ambitious targets of $9, $15, and $31. While these figures appear distant given the token’s recent movement from below $1.10 to $1.13, EGRAG highlighted a “three-bottom sequence of rising cyclical lows, supported by XRP’s long-term exponential moving averages.” He added that the current bottom is forming with “strong confluence around $0.90-$1.00.”

    In contrast, ChartNerd cautioned that XRP has yet to break free from a downtrend that commenced over a year ago, shortly after it achieved its all-time high of $3.65. “We remain inside the wedge structure and below the current descending resistance,” ChartNerd stated. According to ChartNerd’s analysis, XRP would need to surpass $1.20 to demonstrate significant strength and a potential to reverse the trend.

    However, analyst Bird expressed a more immediate positive sentiment, believing XRP has already taken a crucial step to exit its year-long period of consolidation. Bird suggested that “it’s time” for an “explosive candle” that could emerge imminently and propel the asset towards new local highs.


  • XRP Price Action Ambiguous: Analyst Warns of Potential Resistance

    XRP Price Action Ambiguous: Analyst Warns of Potential Resistance

    The recent price recovery of XRP presents an ambiguous market signal, with technical analysts offering contrasting interpretations and highlighting the limitations of current indicators in predicting a definitive market direction. While some traders anticipate a sustained uptrend, a prominent chart analyst, ChartNerd, has cautioned that the recent gains may represent a temporary price surge, suggesting a potential for XRP to face resistance and possibly fall below the $1 mark.

    Analyst Perspectives and Technical Limitations

    According to ChartNerd, the current market conditions do not definitively signal a sustained uptrend. He points to technical indicators such as a 20-week and 50-week exponential moving average (EMA) death cross that formed in January 2026 as evidence of a long-term bearish trend. ChartNerd also cited a price stall in May at the 20-week EMA, which he interprets as confirmation that this level continues to act as resistance. He further argues that XRP remains within a wedge pattern and below descending resistance, which could contradict claims of a significant notable move.

    ChartNerd’s analysis suggests that even if XRP experiences rallies toward $1.29 or as high as $1.60, these levels should be treated as significant resistance unless the price can decisively move above them. He indicated that if XRP fails to reach the 20-week EMA around $1.29 or is rejected there, a drop below $1 could occur sooner than anticipated. This perspective contrasts with other market participants, including those associated with EGRAG CRYPTO, who have suggested that historical patterns could eventually lead XRP to a $1 trillion market cap, though this would require substantially stronger market conditions.

    ChartNerd pushed back against claims of an impending notable move, noting that many analysts predicting such a move had made similar predictions when XRP was trading around $2.40 in January, before its subsequent decline to $1.00. He emphasized that until XRP convincingly breaks above resistance levels that have contained its price for months, any rally should be viewed with caution rather than as confirmation that the downtrend has ended.

    Verified Price Data and Context

    Data from CoinGecko indicates that XRP was trading at approximately $1.13 at the time of reporting. Over the last 24 hours, XRP saw a gain of nearly 4%, and over the past week, it increased by almost 6%. However, over the past month, XRP is down about 2%. Its recent trading range has been between $1.08 and $1.14.

    Navigating Uncertainty

    The current situation presents clear uncertainty for investors. Whether XRP can establish a stronger base or slip below $1 in the coming weeks remains to be seen. The ability of XRP to break through key resistance levels will be crucial in determining its short-term trajectory. Until such a decisive move occurs, market participants are advised to approach signals with caution, recognizing the inherent limitations of technical analysis in predicting future price movements.

    Why This Matters

    The materials describe a narrow update: A chart analyst, ChartNerd, is warning that XRP’s recent price recovery is not a sign of a sustained uptrend and could be a ‘bull trap’, predicting a potential fall below $1. Whether XRP can build a stronger base or slip below $1 in the next few weeks.

    Broader Context

    Source materials place the market analysis in this context: The article discusses the price movement of XRP, a cryptocurrency.

  • XRPL Community Debates Reserve Reductions: Balancing Adoption with Network Security

    XRPL Community Debates Reserve Reductions: Balancing Adoption with Network Security

    A significant debate is underway within the XRPL community concerning a proposal to reduce account reserves, sparking divergent views on its potential impact on user adoption versus network security. The discussion has been brought to the forefront by validator Hussein Zangana’s declaration that he will not vote for further reductions.

    At the heart of the dispute lies the question of whether lowering the cost to activate an XRPL account would encourage broader user adoption or potentially weaken the network’s defenses against malicious activities. This division underscores a fundamental tension between enhancing accessibility and preserving the network’s established security measures.

    Hussein Zangana, director of community at the XRP Ledger Foundation, stated on July 20 that he opposes further cuts to XRPL account reserves. According to Zangana, these reserves were originally implemented to safeguard network resources, such as storage and memory, by increasing the cost of creating numerous accounts that could be used for spam or Distributed Denial of Service (DDoS) attacks. He has indicated a willingness to support reserve reductions only if the proposed lower requirements can offer equivalent protection to the current system. Zangana also reported he would not endorse higher transaction fees, which he noted some in the community have suggested as a compensatory measure for reduced reserves.

    Offering a counterargument, Daniel Keller contends that lowering account reserves could be instrumental in attracting new users to the XRPL, particularly those new to the cryptocurrency landscape. Keller suggests that the focus should be on onboarding individuals outside the existing crypto audience, where entities might activate accounts on their behalf while minimizing associated costs. He has also raised questions about the severity of spam concerns, referencing the ledger’s historical capacity to manage periods of high activity without issues stemming from lower reserves.

    Chris Thompson has introduced another perspective, expressing concern that a reduction in reserves could facilitate the creation of more disposable wallets, potentially increasing the network’s vulnerability to exploitation.

    The history of XRPL reserves reveals a gradual evolution. Initially, in 2012, activating an account required a base reserve of 1,000 XRP. This was later reduced to 200 XRP by Jed McCaleb. Through subsequent validator votes, the requirement has been further lowered to the current levels: a 1 XRP base reserve for account activation, plus an additional owner reserve of 0.2 XRP for each token held (including stablecoins like RLUSD or USDC) or for each of up to 32 non-fungible tokens (NFTs).

    Recent network developments, such as the v3.2.0 upgrade, have seen varied adoption rates, with approximately 43% of nodes upgrading. This update included technical enhancements such as a 30-40% reduction in node memory usage and improvements to network operations.

    The ongoing debate highlights the critical balance the XRPL community must strike between fostering growth and ensuring the network’s long-term security and stability. The differing viewpoints from Zangana, Keller, and Thompson underscore the complexity inherent in these foundational decisions.

    Why This Matters

    The materials describe a narrow update: A debate has emerged within the XRPL community after a validator, Hussein Zangana, stated he would not vote to lower account reserves. Whether lower reserves would ultimately help adoption or weaken network protections.

    Broader Context

    Source materials place the factual news in this context: The XRPL Reserve Debate Splits Community Over Adoption vs Security.

  • PUMP Hits 2-Month Peak: Catalysts and Outlook

    PUMP Hits 2-Month Peak: Catalysts and Outlook

    PUMP Token Surges to Two-Month High Amidst Market Resurgence

    The cryptocurrency market experienced a modest rebound on July 20, but the top performer among the top 100 digital assets was not Bitcoin (BTC) or Ethereum (ETH). Instead, Pump.fun’s native token, PUMP, has captured attention with a significant price increase.

    Some market observers suggest this surge may signal the start of a more substantial rally, rather than a fleeting price spike.

    PUMP saw a 20% increase over the past 24 hours, reaching approximately $0.002, its highest valuation since mid-May. This propelled its market capitalization to nearly $800 million, positioning it as the 71st largest cryptocurrency by market value.

    Industry Insiders Fueling the Rally

    A potential driver for PUMP’s strong performance appears to be heightened interest from prominent figures within the cryptocurrency space. On-chain analytics firm Lookonchain reported that well-known crypto trader and influencer Ansem acquired PUMP tokens using 1,500 SOL, a transaction valued at roughly $115,000. Concurrently, an anonymous trader initiated a $1.5 million long position with 10x leverage.

    The social media platform X (formerly Twitter) is now abuzz with analysts predicting further gains for PUMP. Crypto Patel, for instance, asserted that the token has confirmed a breakout on a high timeframe, suggesting a potential 200% upside.

    X user 0xNeena opined that a decisive move above $0.002 could trigger a new upward trend, while another user, Greeny, went further, suggesting this could mark the beginning of a bull run that might extend into 2027. Captain Faibik also contributed to the optimistic outlook, forecasting that PUMP could soon surge to around $0.0047, a level not seen since November of the previous year.

    Cautionary Signals Amidst Optimism

    In a market environment largely characterized by selling pressure and a bear market that has dampened investor sentiment, it is important to acknowledge that PUMP’s resurgence could prove to be temporary. In recent months, numerous altcoins have experienced brief recoveries, only to decline by double-digit percentages within days, and sometimes even hours.

    Furthermore, PUMP’s Relative Strength Index (RSI) serves as a potential warning. The indicator has risen above 70, signaling that the token has entered overbought territory and may be due for a correction. The RSI, a technical analysis tool that ranges from 0 to 100, typically considers readings below 30 as potential buying opportunities.

  • Bitcoin ETFs See Renewed Inflows, But Historical Parallels Suggest Continued Volatility

    Bitcoin ETFs See Renewed Inflows, But Historical Parallels Suggest Continued Volatility

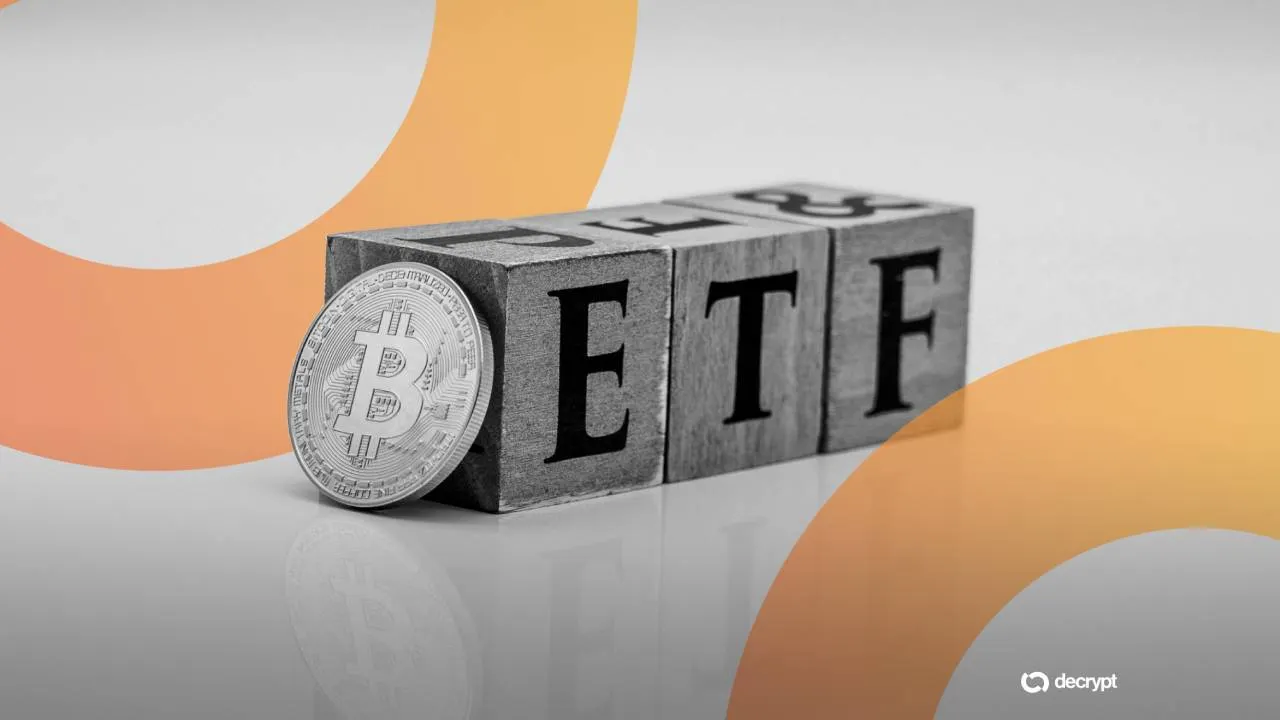
    Bitcoin ETFs have experienced two consecutive weeks of net inflows, marking a potential shift after a period of significant outflows. For the week ending July 17, 2026, the 13 U.S. spot Bitcoin funds recorded $75.7 million in net inflows, according to SoSoValue data. This follows $197.4 million in inflows the previous week, bringing the total net gains for the two-week period to $273.1 million.

    This recent positive trend contrasts sharply with the preceding eight consecutive weeks of net outflows, which saw more than $8.2 billion drained from these funds between mid-May and early July. June 2026 alone accounted for approximately $4.5 billion in outflows, marking it as the worst single month on record for Bitcoin ETFs since their launch. The $273.1 million recovered in the recent two-week period represents roughly 3.3 cents on every dollar lost during the outflow streak.

    Despite the recent inflows, market volatility remains a key consideration. On Monday of the week ending July 17, 2026, $424.7 million left the funds, the largest one-day withdrawal since June 26, 2026. Investors reversed course in the subsequent four days, leading to the week’s positive net inflow.

    Historical Parallels and Analyst Views

    Bloomberg Intelligence senior ETF analyst Eric Balchunas has drawn a parallel between the current trajectory of Bitcoin ETFs and the 22-year history of gold ETFs, particularly GLD, the first gold ETF listed on a U.S. exchange. Balchunas argues that both Bitcoin and gold are ‘non-yielding stores of value,’ meaning their prices are primarily driven by investor sentiment rather than income generation. This structural similarity, he suggests, may mean Bitcoin ETFs could follow a similar pattern of significant gains, followed by painful drawdowns and recoveries that test investors’ patience.

    GLD’s history illustrates this potential for extreme swings. The fund achieved immense popularity shortly after its debut, briefly surpassing SPY to become the largest ETF globally for a single day in 2011. However, it subsequently spent eight years in a period of stagnation. Balchunas sees a “spiritual parallel” with BlackRock’s Bitcoin ETF (IBIT), which briefly crossed $100 billion in assets in October of the prior year, coinciding with Bitcoin’s all-time high above $126,000. Bitcoin has since fallen significantly, trading near $64,000, having lost roughly half its value from its peak. BlackRock’s IBIT has sold close to 100,000 BTC in recent months to meet redemptions, currently holding just over 733,000 BTC under management.

    Balchunas expressed cautious optimism, noting that “every gold ETF cycle means the asset moons after a crash.” However, he also flagged that “the process can test patience for far longer than most investors expect,” suggesting a path of “two steps forward, one step back.”

    Contrasting Outlooks

    In contrast to this perspective, Citigroup took a more bearish stance on July 1, 2026. The bank cut its 12-month Bitcoin price target from $112,000 to $82,000. Furthermore, Citigroup reset its projected ETF inflows for the next year to zero, a significant reduction from its earlier estimate of $10 billion. The bank cited negative flows, stalled U.S. crypto legislation, and weakening institutional appetite as reasons for its revised outlook.

    Current State and Future Uncertainty

    The total net assets across all 13 spot Bitcoin ETFs currently stand at $77.7 billion, down from over $106 billion recorded just before the outflow streak began in mid-May. The recent inflows offer a glimmer of recovery, but the historical parallels and contrasting institutional outlooks highlight the ongoing uncertainties and potential for continued volatility in the Bitcoin ETF market.

    Why This Matters

    The materials describe a narrow update: Bitcoin ETFs recorded $75. The long-term impact of the current inflows on Bitcoin ETF performance.

    Broader Context

    Source materials place the factual news in this context: Bitcoin ETFs have posted back-to-back positive weeks for the first time since early May.

  • Bitcoin Market Signals: Analyzing Exchange Reserves, Investor Activity, and Technical Indicators

    Bitcoin Market Signals: Analyzing Exchange Reserves, Investor Activity, and Technical Indicators

    Bitcoin (BTC) is currently trading around $64,500, a notable decrease from its all-time high set last year. While the cryptocurrency has experienced a bear market trend over the past several months, several on-chain metrics and technical indicators are being closely watched for potential implications on future price movements. However, it is crucial to approach these signals with caution, as past market performance does not guarantee future results.

    Declining Exchange Reserves
    One significant observation is the reduction in Bitcoin held on centralized exchanges. Data indicates that approximately 2.7 million BTC are currently stored on exchanges, a level not seen since late June. This decrease in exchange reserves is often interpreted as investors moving their holdings to self-custody, which can potentially decrease immediate selling pressure.

    Investor Accumulation Trends
    Further analysis of investor activity reveals a pattern of accumulation among specific large holders. Over the last two months, investors holding between 1,000 and 10,000 BTC have purchased approximately 66,700 coins. This period marks their strongest accumulation since February. Such accumulation by significant investors can reduce the available supply on the market and may influence the behavior of smaller investors.

    Technical Indicators and Historical Context
    On the technical analysis front, a bullish divergence has been observed on Bitcoin’s weekly chart, according to analyst Ali Martinez. Historically, such divergences have preceded significant price increases; one instance cited coincided with a more than 700% price surge. However, the possibility of this pattern repeating and leading to a similar outcome is not guaranteed. Predictions based on this historical event, suggesting potential future prices of $500,000 or targets between $100,000-$105,000, are speculative.

    Acknowledging Uncertainty
    It is important to acknowledge the uncertainties surrounding these signals. Bitcoin has experienced several attempts at recovery in recent months, only to be met with selling pressure from bears. Therefore, while the decrease in exchange reserves and the accumulation by certain investor groups may may reflect changing conditions, they do not suggest an imminent rally. Analyst Crypto Catalysts, for instance, has predicted a move towards $70,000, followed by a correction to $80,000, and eventually a main target of $100,000, but these are forward-looking statements.

    Conclusion: A Balanced Perspective
    In conclusion, the current market environment for Bitcoin presents a complex interplay of data. Reduced exchange reserves and increased accumulation by specific investor segments are observable trends. Coupled with a technical signal like bullish divergence, these factors are being analyzed for their potential implications. However, the market remains subject to volatility, and historical patterns should be viewed as context rather than definitive predictions. Investors are advised to maintain realistic expectations and base decisions on a comprehensive understanding of the available data and its inherent uncertainties.

    Why This Matters

    The materials describe a narrow update: Bitcoin has been in a bear market, but several factors suggest a potential rally. Whether history will repeat itself regarding the price explosion after bullish divergence.

    Broader Context

    Source materials place the market analysis in this context: The leading digital asset has been stuck in a persistent bear market over the past several months, currently trading at around $64,500 (a nearly 50% decline from its ATH set last year).

  • Spot Ethereum ETFs See Consecutive Inflows, Reversal After Eight-Week Outflow Streak

    Spot Ethereum ETFs See Consecutive Inflows, Reversal After Eight-Week Outflow Streak

    Spot Ethereum Exchange-Traded Funds (ETFs) have recorded two consecutive weeks of net inflows, totaling $105 million for the week of July 13-17, 2026. This marks a reversal after an eight-week period of outflows, according to data from CoinGlass and Farside Investors.

    The prior week saw net inflows of $84 million, and the subsequent $105 million figure represents the strongest weekly inflow for Ethereum ETFs since April. While this sustained positive flow suggests a potential shift in institutional interest, it remains uncertain whether this indicates a durable re-engagement or a short-term market fluctuation.

    BlackRock’s ETHA Plays Key Role in Inflows

    BlackRock’s iShares Ethereum Trust (ETHA) has been a significant driver of these inflows. Data indicates that ETHA has consistently accounted for a notable portion of daily net positive flows within the Ethereum ETF landscape. Its structural advantages, including brand recognition, distribution reach, and institutional trust, contribute to its prominent role, with its performance influencing the overall category.

    ETF Flows and Price Support Dynamics

    Sustained net inflows into spot ETFs create a mechanical bid for the underlying asset, as fund providers must purchase actual Ethereum (ETH) to back new shares. During the week of July 13-17, 2026, with weekly inflows ranging between $80 million and $105 million, this consistent buying pressure provided a floor for ETH’s price. The ETH price traded around $1,845 during this period, with the $1,800–$1,900 range identified as a critical demand zone. This level is influenced by ETF flow dynamics, though the inflows do not suggest price direction.

    For context, U.S. spot Bitcoin ETFs recorded total net inflows of $108 million on July 15, 2026, with BlackRock’s IBIT leading single-day inflows at $80.82 million. On the same day, Spot Ethereum ETFs drew $53.83 million, with ETHA contributing $45.29 million. As of mid-July 2026, the cumulative net inflows across nine Ethereum ETF issuers since their launch in July 2024 approximated $11.07 billion, with ETHA’s own cumulative net inflow reaching $11.28 billion.

    Uncertainty Regarding Trend Sustainability

    While the recent inflows are a development, uncertainty remains regarding their sustainability. Analysts caution that calling this a full-scale institutional comeback requires more evidence, and two consecutive positive weeks after a prolonged outflow streak constitute a reversal, not yet a definitive trend. The health of the entire spot Ethereum ETF complex is closely tied to ETHA’s performance; any stall or reversal in its flows could quickly push the category back into net outflows.

    The coming weeks will be crucial in determining the trajectory of these flows. If ETHA sustains its pace and ETH holds the $1,800 support zone, it could validate the start of a genuine institutional re-accumulation phase. Conversely, a sharp deceleration in flows or a negative turn for ETHA would suggest a resumption of outflows and a potential weakening of the $1,800 price floor.

    It is also noted that the current momentum in Ethereum ETF flows appears to be asset-specific, as XRP ETF flows have shown a different pattern, indicating that this is not necessarily a broad trend across all crypto ETFs. The $105 million weekly inflow figure, while the strongest since April, remains modest compared to the peaks seen in earlier periods of 2024 and early 2025.

    Why This Matters

    The materials describe a narrow update: Spot Ethereum ETFs recorded $105 million in net inflows for the week of July 13-17, 2026, marking the second consecutive week of positive flows after an eight-week outflow streak. Whether the current inflow trend is a durable institutional re-engagement or a short-term technical bounce.

    Broader Context

    Source materials place the factual news in this context: The prior week’s $84M was itself notable as the streak-breaker; the follow-through to $105M adds weight to the argument that the reversal has legs rather than being a single-week anomaly.

  • Drake, Others Suffer Crypto Losses After Spain’s World Cup Win

    Drake, Others Suffer Crypto Losses After Spain’s World Cup Win

    Spain Claims World Cup Title, Leading to Millions in Crypto Losses for Drake and Other Bettors

    The FIFA World Cup final, a quadrennial sporting spectacle, concluded yesterday, July 19, with Spain emerging victorious over Argentina. The highly anticipated match drew significant attention from gamblers, including Canadian rapper Drake, who wagered substantial sums. However, the outcome proved unfavorable for the musician and other bettors, resulting in millions of dollars in cryptocurrency losses.

    As the final approached, anticipation mounted, and risk-takers like Drake placed considerable bets, hoping for both a favorable historical outcome and substantial financial gains. The rapper reportedly wagered $1.5 million in USDT on Argentina to win within the standard 90 minutes, including stoppage time. Argentina, considered the underdog, could have yielded Drake a payout exceeding $5 million in crypto had they secured the victory.

    Ultimately, Drake’s bet did not pay off. Spain demonstrated superior performance throughout the match, controlling the game from start to finish. Despite a narrow 1-0 victory, achieved after a heroic 106-minute effort from Argentina’s goalkeeper Emiliano Martinez, Spain’s dominance was evident.

    While it’s unlikely Spain’s performance was directly influenced by Drake’s wager, the incident highlights a recurring pattern often dubbed “the Drake Curse,” where teams and athletes he supports frequently face defeat. This phenomenon has led to widespread speculation among those who believe in superstitions.

    This is not an isolated incident for the rapper. Earlier this month, Drake placed a $1 million Bitcoin (BTC) bet on Conor McGregor’s return to the octagon at UFC 329 in Las Vegas after a five-year hiatus. McGregor faced Max Holloway but lost in the first round, marking a disappointing comeback.

    Drake was not the only significant loser due to Argentina’s inability to secure a consecutive World Cup title. Blockchain analytics firm Lookonchain reported on a gambler who staked $1.23 million on Lionel Messi and his teammates to win the trophy when the odds were approximately 10%. A successful bet would have resulted in a profit well over $10 million.

    Conversely, some astute bettors profited handsomely. One such individual, identified as a “whale” by Lookonchain, created a new wallet on Polymarket shortly before the final and wagered $1.95 million on Spain to win the championship at odds of 59.1%. According to Lookonchain, this bettor “won and made $1.35M in just a few hours.”

  • ARKKUSDT Perpetual Contract Lists with 20x Leverage

    ARKKUSDT Perpetual Contract Lists with 20x Leverage

    Bybit Launches ARKKUSDT Perpetual Contract with Up to 20x Leverage

    Cryptocurrency exchange Bybit has announced the listing of the ARKKUSDT Perpetual Contract, allowing traders to engage with the ARK Innovation ETF (ARKK) with up to 20 times leverage.

    The new contract is accessible for trading through Bybit’s Futures bots, including Futures Grid, Futures Martingale, and Futures Combo.

    The ARKKUSDT Perpetual Contract is based on the ARK Innovation ETF as its underlying asset and settles in USDT. It features a tick size of 0.01 and a maximum leverage of 20. The capped funding rate is set at 2.5%, with funding fees settled every eight hours. Trading for the contract is available 24/7.

    The ARK Innovation ETF is managed by ARK Invest.

  • XRP Consolidates Around $1.09: Korean Demand Signals Weighed Against Macro Uncertainty

    XRP Consolidates Around $1.09: Korean Demand Signals Weighed Against Macro Uncertainty

    XRP is currently trading around the $1.09 mark, reflecting a modest weekly gain of approximately 1%. With a market capitalization near $68 billion and roughly 62.4 billion circulating tokens, XRP has maintained its position by defending the $1.05 support area. However, immediate resistance is noted around $1.13, with a more significant ceiling identified between $1.20 and $1.30. The current price action indicates a period of consolidation, with market momentum appearing balanced rather than decisively committed.

    Analysts are observing demand from South Korean exchanges, where XRP is reportedly trading at a premium relative to Bitcoin. This localized demand is being considered by some as a potential indicator of stronger local conviction for XRP. Nevertheless, the extent to which this signal translates into future price movements remains uncertain. It is unclear if this demand represents a significant clue for a potential upward move or is merely a market quirk.

    Broader market influences continue to shape the cryptocurrency landscape. Bitcoin is hovering around the mid-$64,000 area, and overall risk appetite across crypto markets is heavily influenced by macroeconomic factors such as inflation data and central bank commentary. These macro events are currently dictating the tune for the broader market, making it challenging to isolate the impact of localized demand signals.

    The potential bull case for XRP, as suggested by some market observations, involves strengthening Korean demand, positive regulatory headlines, and a sustained move above the $1.13 resistance. If momentum traders were to join such a move, the $1.20-$1.30 zone could potentially be challenged. However, markets rarely provide clear invitations, and the initial stages of any price movement can often feel uncertain.

    Conversely, the base case scenario points towards continued sideways trading between the $1.05 support and $1.13 resistance levels, as traders await further clarity from macroeconomic data. A bear case could emerge if Bitcoin experiences a downturn due to hawkish surprises from central banks, leading XRP to lose its $1.05 support zone. Such a development would weaken the current base and delay any potential upward narrative.

    Reaching XRP’s all-time high near $3.84 would necessitate a significantly different market backdrop than what is currently observed. A move to the $1.30 level, representing a potential 19% gain from current levels, would require a confluence of factors including supportive macroeconomic conditions, positive regulatory news, and sustained volume from Korean markets simultaneously.

    In the current cycle, traders seeking asymmetric exposure are increasingly looking at early-stage infrastructure projects. For instance, LiquidChain ($LIQUID), an L3 infrastructure project focused on cross-chain liquidity, is in its presale phase priced at $0.01481, having raised $910,000 to date. The thesis behind such projects is solving cross-chain fragmentation, with their current valuation reflecting early positioning rather than market validation.

    Ultimately, XRP’s price action remains balanced, with key technical levels and broader market uncertainties shaping its near-term outlook. The significance of localized demand signals is yet to be definitively determined, and a clear direction for XRP will likely depend on the interplay between these signals and overarching macroeconomic trends.

    Broader Context

    Source materials place the market analysis in this context: XRP is trading around $1.09 with little price change over the past 24 hours.