
Tag: Negative

  • Ethereum ETFs Suffer Largest Weekly Outflow Since January

    Ethereum ETFs Suffer Largest Weekly Outflow Since January

    Ethereum ETFs Face Steepest Weekly Outflow Since January

    US spot Ethereum exchange-traded funds (ETFs) experienced their worst week since late January, with investors withdrawing $542.1 million during the trading week ending October 9, 2026. This marks the largest weekly exodus from these funds in over eight months and coincides with Ether’s price falling below a key trading threshold.

    Concentrated Redemptions Drive Outflows

    The significant outflows were not evenly distributed among the funds. BlackRock’s iShares Ethereum Trust (ETHA) accounted for approximately $477 million of the total weekly redemptions, representing about 88% of all withdrawals in the category. Grayscale’s ETHE followed with $31.9 million in outflows during the same period.

    For perspective, the last time the Ethereum ETF category saw such substantial weekly outflows was in late January, when withdrawals totaled $611 million.

    Extended Period of Outflows

    The recent week’s performance is part of a broader trend of declining investor interest. The funds have now recorded nine consecutive trading days of outflows, beginning on September 29. Over this extended period, total redemptions have reached $697.2 million.

    Price Decline and Reduced Trading Activity

    The price action for Ether has offered little solace to investors. ETH settled near $2,491 on October 10, marking a decline of over 7% from the previous week. This price movement pushed Ether below two significant technical indicators: its 50-day simple moving average and the $2,500 level. Trading volume for ETH also saw a considerable drop, falling 61% to $7.2 billion.

    Broader Market Trends

    Ether was not the only cryptocurrency ETF to experience outflows. Bitcoin ETFs saw approximately $681 million withdrawn during the same period. In a more symbolic development, spot Solana ETFs recorded their first outflows since their launch, ending a 14-week streak of inflows.

    As of October 9, 2026, cumulative net inflows into US spot Ethereum ETFs stood at approximately $13.26 billion, with total net assets across the funds estimated at $15.71 billion. While the recent redemptions are substantial, they represent a relatively small portion of the overall capital invested in these products.

    Investor Confidence and Market Sentiment

    The significant concentration of outflows in BlackRock’s ETHA, the largest fund in the category, suggests it serves as a primary avenue for large holders to quickly reduce their exposure. Analysts suggest these outflows may signal waning investor confidence amid shifting market conditions. The simultaneous declines in both Ether and Bitcoin could indicate a broader bearish sentiment, potentially influenced by external economic factors and regulatory uncertainties.

    Key Signals for Ether’s Trajectory

    For those monitoring Ether’s performance, several key indicators are noteworthy. The ability of ETH to reclaim the $2,500 level and its 50-day moving average will be crucial. Additionally, a rebound in trading volume, currently at $7.2 billion, and a reversal of the nine-day outflow streak in daily ETF data will be closely watched.

    The continued redemptions from newer products like spot Solana ETFs, following a prolonged period of inflows, could suggest a broader trend of investors trimming riskier crypto positions across the market rather than reallocating capital between different assets.

  • Bitcoin Price Analysis: US Demand Dips, Is BTC’s Rally Over?

    Bitcoin Price Analysis: US Demand Dips, Is BTC’s Rally Over?

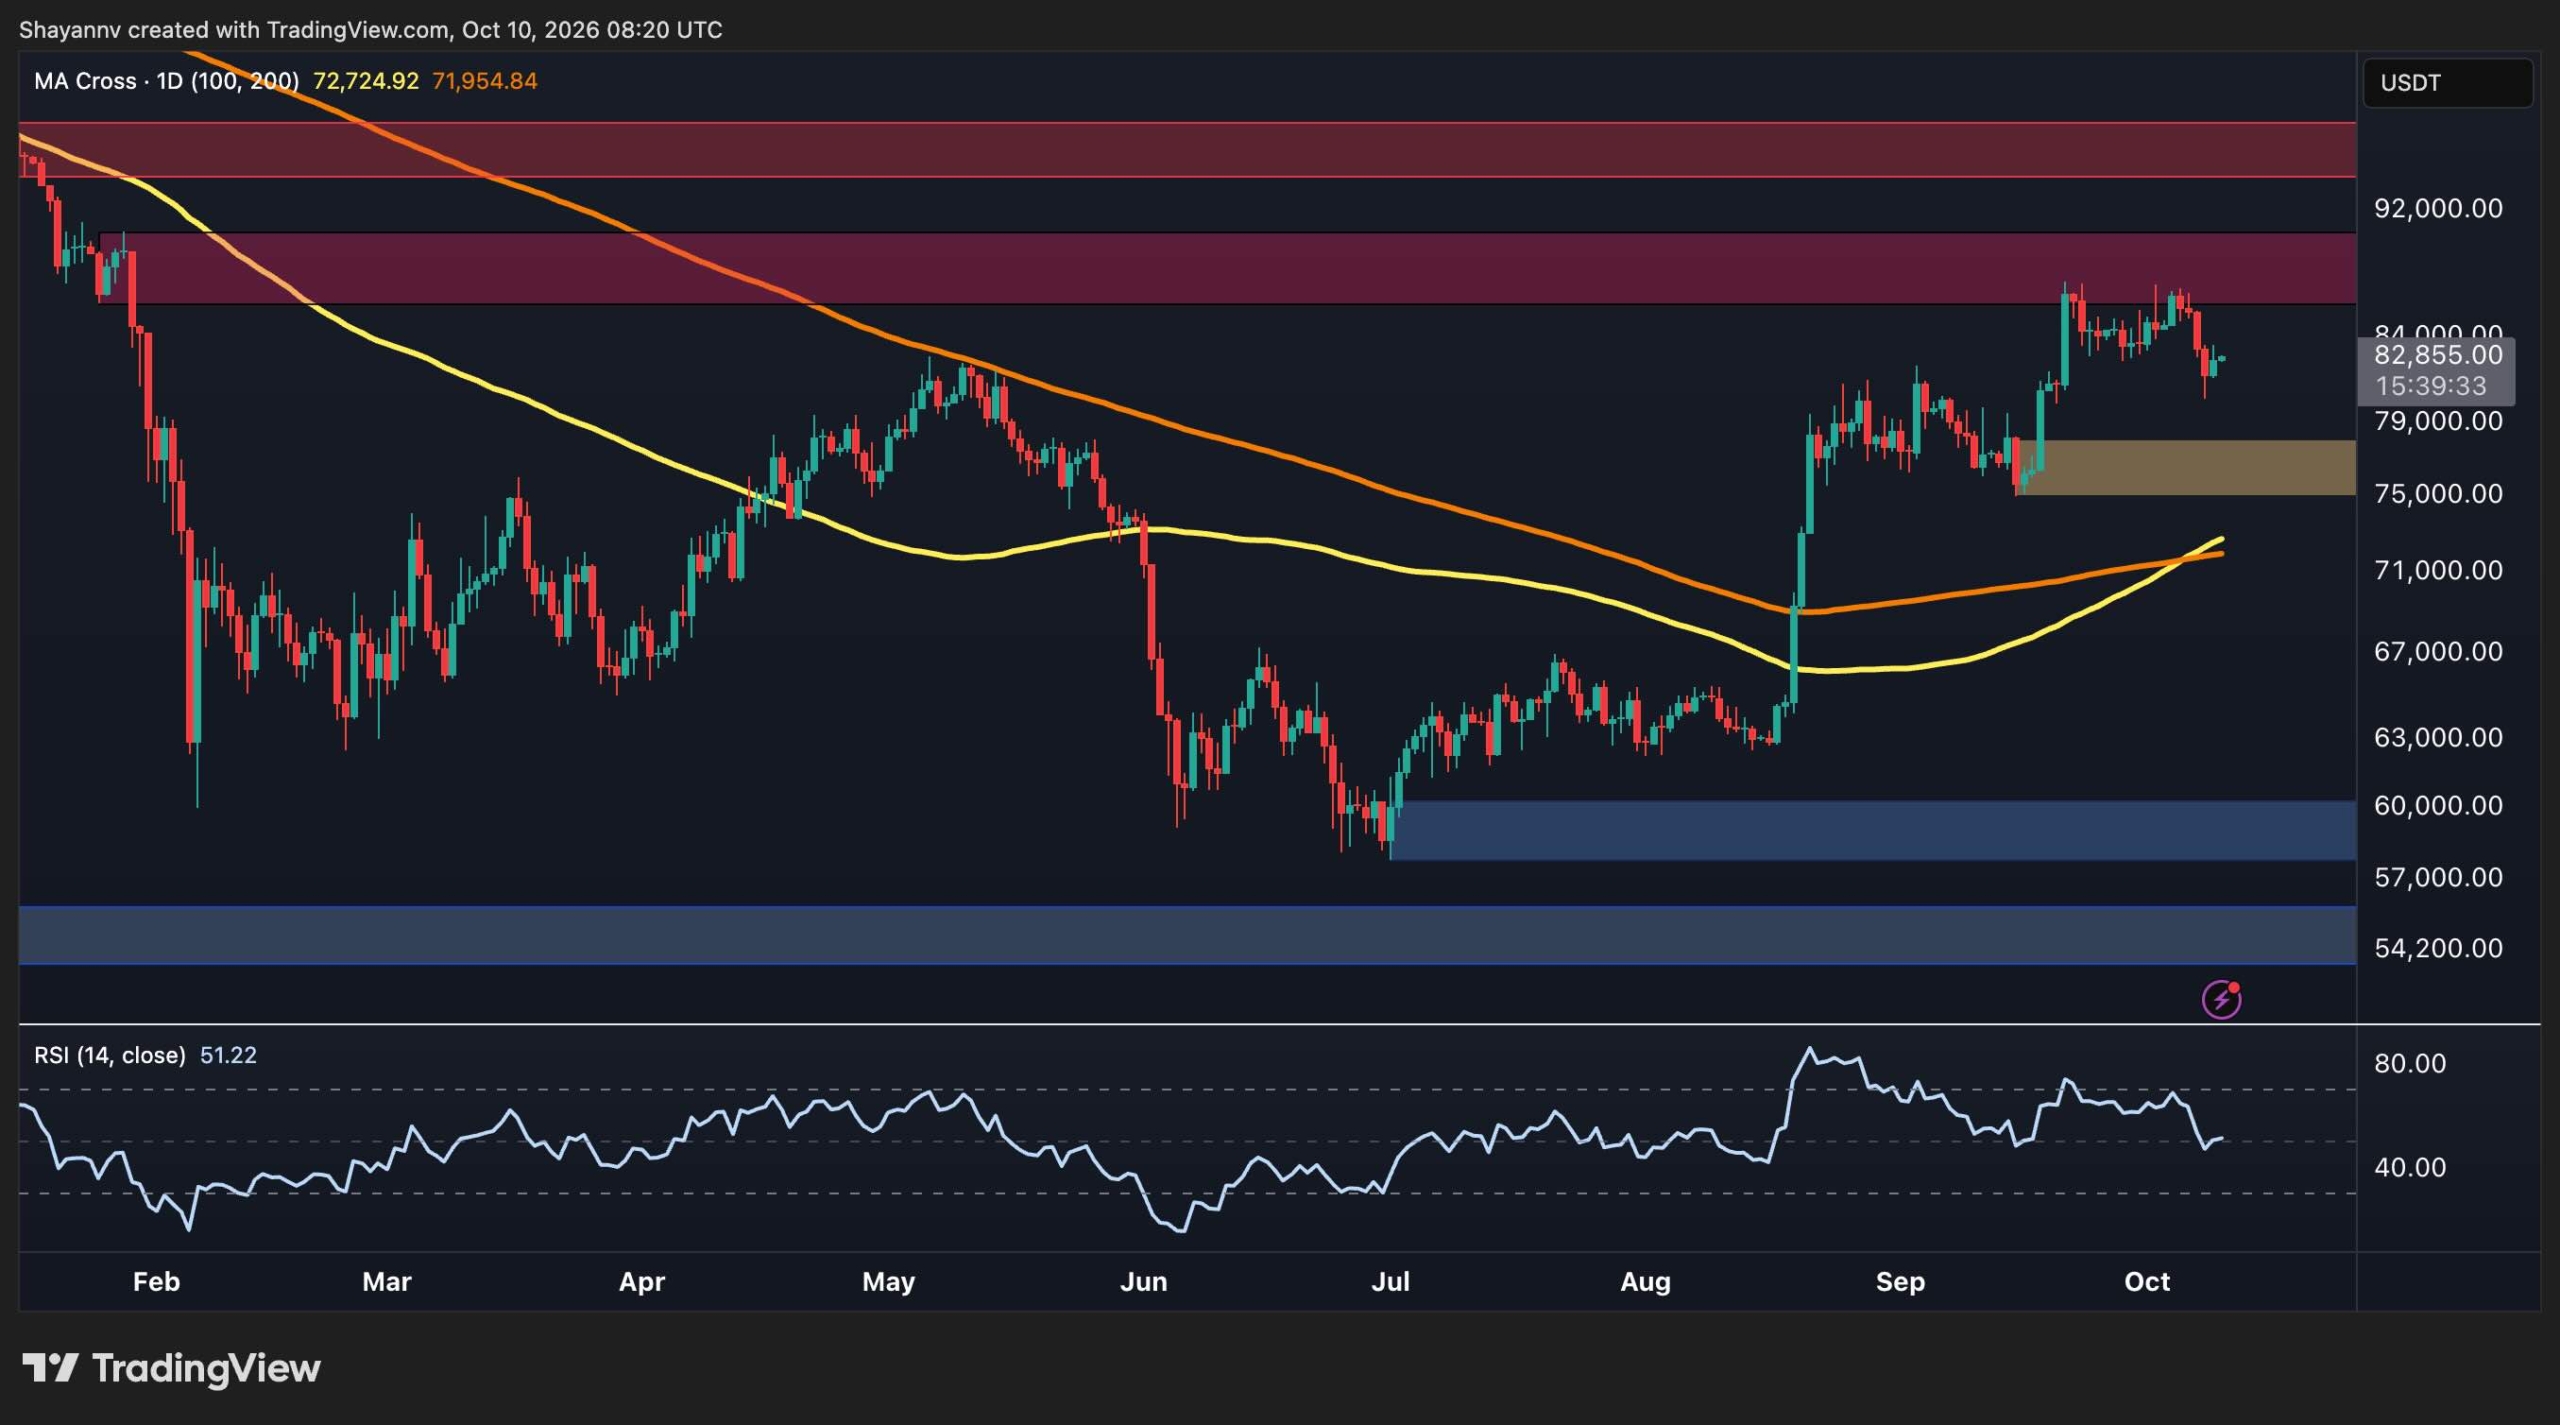
    Bitcoin is currently trading around $83,000, following a rejection from the $86,000 to $90,000 resistance zone, which has weakened its short-term structure. Concurrently, the Coinbase Premium Index has turned sharply negative, suggesting a potential waning of U.S.-based buying demand. While Bitcoin is attempting to stabilize, buyers must reclaim nearby resistance levels to improve the cryptocurrency’s outlook.

    Bitcoin’s Recovery Faces Resistance

    Bitcoin’s daily chart illustrates a significant recovery from its June lows near $58,000 to recent highs around $86,000. However, this rally has encountered robust resistance, and recent price action indicates that sellers are regaining short-term control.

    BTC has been rejected at the $86,000 to $90,000 resistance zone, with the lower boundary of this area, approximately $86,000, serving as the immediate hurdle for any renewed advance. A broader resistance level is observed around $95,000, which would become relevant should Bitcoin reclaim the nearer supply zone and resume its upward trajectory.

    Despite these headwinds, the price remains above the 100-day and 200-day moving averages, both currently situated near $72,000, following a bullish crossover. While BTC is comfortably trading above these averages, their recent crossover and upward trend reflect an improved medium-term structure after the summer’s recovery. These moving averages could emerge as significant dynamic support if the current correction deepens, but they are not immediate downside targets as long as the market stays above nearer support zones.

    The first critical downside area to monitor is the $77,000 demand zone, established by the bullish order block that fueled the final leg of the recent rally. A loss of this area, coupled with a price close below $75,000, would undermine the recovery structure and expose the aforementioned moving averages around $72,000.

    For the time being, the daily structure remains in a recovery phase. However, the rejection from resistance and a potential loss of short-term support could signal that Bitcoin may require a deeper correction before attempting another upward move.

    Short-Term Outlook Deteriorates

    On the 4-hour chart, Bitcoin has broken below a rising wedge pattern after being rejected from the $86,000 region. This breakdown below the pattern’s lower trendline suggests a bearish resolution for the pattern, at least in the short term.

    Following the breakdown, BTC experienced a decline towards the $80,000 area before staging a modest rebound to approximately $83,000. This recovery indicates buyers are attempting to stabilize the price, but the bounce appears limited, with a bearish order block forming near $85,000 that could exert downward pressure on the asset once more.

    On the downside, the $80,000 low represents the nearest level where buyers have recently intervened. A loss of this zone would lead to the next significant support being the $75,000 to $78,000 demand area, which is also visible on the daily chart.

    The 4-hour Relative Strength Index (RSI) has recovered from oversold territory and is now in the mid-40s, suggesting that selling momentum has somewhat eased. However, it remains below the neutral 50 level, indicating that the rebound has not yet established convincing bullish momentum.

    Consequently, the short-term outlook remains cautious. Bitcoin could continue to consolidate between $82,000 and $84,000 if buyers successfully defend recent lows. However, another rejection below $86,000, followed by a break under $80,000, would increase the probability of a deeper move towards the $75,000 to $78,000 demand zone.

    Coinbase Premium Index Signals Weakening Demand

    The Coinbase Premium Index chart reveals a sharp negative turn in its latest reading, falling to approximately -0.1 while Bitcoin trades near $82,700. This index measures the price difference between Bitcoin on Coinbase and a comparable market price. A negative reading generally signifies that BTC is trading at a discount on Coinbase relative to the reference market.

    A consistently positive premium can signal stronger buying pressure on Coinbase, often associated with U.S. spot demand. Conversely, a negative premium suggests weaker relative demand or stronger selling pressure on the platform. It is important to note that this metric is not a direct measure of total U.S. investor flows and can also be influenced by variations in liquidity and market conditions across exchanges.

    The recent deterioration is noteworthy as it coincides with Bitcoin’s rejection from the $86,000 resistance region and its subsequent breakdown from the 4-hour rising wedge. The alignment between weakening price structure and a negative Coinbase Premium suggests that spot demand may not be robust enough to support an immediate continuation of the rally.

    The index has exhibited repeated swings between positive and negative territory throughout its history, so the latest decline should not be interpreted as definitive proof of sustained distribution. Nevertheless, a continued negative premium alongside further price weakness would bolster the bearish case, particularly if BTC loses the $80,000 support area.

  • Bitcoin Crash Continues to Define Crypto Risk a Year On

    Bitcoin Crash Continues to Define Crypto Risk a Year On

    One Year On: The $19 Billion Crypto Liquidation Triggered by a Trade War

    A year ago, a single tariff announcement triggered a cascade of liquidations, wiping out over $19 billion in leveraged cryptocurrency bets in a single day. This event remains the largest derivatives liquidation episode the market has ever recorded.

    The catalyst for the turmoil originated not from within the crypto sphere, but from Washington. Then-President Donald Trump’s announcement of a 100% tariff on Chinese imports sent shockwaves through markets that had been anticipating positive news. Suddenly, investors were forced to reprice assets in the context of an escalating trade war.

    Crypto derivatives were the first to feel the impact. Within a 24-hour period, forced liquidations surged past $19 billion across various exchanges. The fallout affected more than 1.6 million accounts, with the majority of the losses borne by traders who had bet on prices rising. Long positions accounted for approximately $16 billion to $17 billion of the total liquidated value.

    Just four days prior, on October 6, Bitcoin had reached an all-time high of nearly $126,200. During the subsequent crash, it experienced an intraday decline of between 14% and 17%, dipping to lows between $102,000 and $107,000 before partially recovering.

    The selloff also saw open interest, representing the total value of outstanding derivatives contracts, plummet by over 30%. In the broader cryptocurrency market, hundreds of billions in market capitalization evaporated within hours.

    In response to the extreme volatility, Binance offered $300 million in compensation to users impacted by its automated liquidation processes.

    Structural Weaknesses Exposed

    The crash illuminated significant structural vulnerabilities within the crypto derivatives market, primarily concerning thin liquidity and cross-margin mechanics.

    Thin liquidity signifies an insufficient number of buyers available to absorb the surge of forced selling, leading to sharp price drops rather than gradual declines.

    Cross-margin, a system where a trader’s entire account balance serves as collateral for all open positions, proved particularly problematic. During a market downturn, a single losing trade could deplete collateral supporting other positions, resulting in a complete account wipeout from a single adverse bet.

    On-chain analyses indicated that realized losses for traders were considerably lower than the $19 billion figure, with estimates ranging from $950 million to $2.85 billion. This discrepancy arises because the $19 billion represents the notional value of liquidated positions, not the actual cash losses incurred by traders.

    Metaplanet reported a 39% drop in its third-quarter profits, underscoring the ripple effect of the October 10 event on companies holding Bitcoin on their balance sheets. As of early October 2026, Bitcoin was trading around $83,000 to $83,500, approximately 34% below its peak.

    Lessons Learned and Future Indicators

    While the liquidation event did effectively remove a substantial amount of leverage from the system, subsequent market positioning suggested that traders had not significantly reduced their risk appetite. Leverage monitoring around the anniversary of the crash indicated only a modest easing in risk metrics.

    For individual traders, the event served as a stark reminder of tail risk. The October 10 crash was initiated by a policy announcement external to the crypto ecosystem, rendering on-chain metrics ineffective as an early warning. Leveraged long positions had no time to react before automated liquidation systems were triggered.

    For exchanges, the episode underscored the importance of transparency. Binance’s substantial compensation offer highlighted that how a platform manages automated liquidations during extreme market conditions is a critical reputational concern, extending beyond mere technical execution.

    The crash, which impacted over 1.6 million accounts in a single day, may prompt some new entrants to favor spot holdings or more conservative investment strategies, while potentially deterring others from engaging with derivatives altogether.

    Key indicators to monitor for future market stability include open interest, funding conditions, and the proportion of positions utilizing cross-margin. A resurgence in these metrics toward pre-crash levels, coupled with persistently thin liquidity, could signal the market is rebuilding the same vulnerabilities that led to the domino effect on October 10.

  • Bitcoin ETF Outflow Largest Since June, Sparking Caution Amid Market Uncertainty

    Bitcoin ETF Outflow Largest Since June, Sparking Caution Amid Market Uncertainty

    US spot Bitcoin ETFs experienced a significant single-day outflow of $487 million on Wednesday, marking the largest such departure since June 25th. This outflow, statistically anomalous as it falls outside 2.1 standard deviations of the 90-day average net inflow, has prompted market observers to question the sustainability of recent price support.

    While the $487 million outflow is notable, its interpretation as a definitive trend reversal remains uncertain. The outflow represents a shift from the consistent inflows seen in September, which totaled approximately $2.65 billion. So far in October, net outflows have reached $166 million, contributing to a year-to-date net inflow of $717 million for Bitcoin ETFs. Cumulative inflows since January 2024 stand at $57.33 billion.

    Bitcoin’s price is currently trading around $83,000. Analysts, including FxPro Chief Market Analyst Alex Kuptsikevich, have identified a critical support zone between $80,500 and $81,500. This range encompasses previous regional highs and the 50-day moving average. A breach of this support could potentially lead to further price declines, with some analysts warning of downside targets at $76,000 or even $72,000.

    Interpreting the Data
    The immediate impact of Wednesday’s outflow is difficult to interpret definitively. Single-day data points can be misleading, and the market is currently navigating a boundary of uncertainty. The next three trading days are considered crucial for assessing whether this outflow is an isolated incident or the beginning of a sustained trend.

    Broader Market Influences
    Broader macroeconomic factors are also contributing to market caution. Volatile US Treasury yields, rising oil prices influenced by geopolitical tensions involving Iran, and the Federal Reserve’s continued focus on inflation as a primary risk are pressuring risk assets. The US Dollar Index is also nearing an 18-month high, potentially adding further headwinds.

    Historically, ETF inflows provided significant support during the August-September rally. A reversal or weakening of these flows removes a key buffer for Bitcoin’s price. The current environment, characterized by uncertainty in oil prices, geopolitical developments, and the Federal Reserve’s monetary policy stance, makes ETF fund flows a critical short-term indicator.

    Looking Ahead
    While the $487 million outflow is a significant data point, it is essential to view it within the broader context of market dynamics and macroeconomic influences. The potential for price declines exists if key support levels are breached, but the extent and duration of any such movement remain uncertain.

    Why This Matters

    The materials describe a narrow update: US spot Bitcoin ETFs saw a net outflow of $487 million on Wednesday, the largest single-day outflow since June 25th. Whether the recent $487 million outflow is a single event or the beginning of a trend.

  • Funds Shift from USDT to USDD to Evade Tether Freezes

    Funds Shift from USDT to USDD to Evade Tether Freezes

    Millions in Crypto Stolen from Ledger Users, Perpetrator Evades Freezes by Converting to USDD

    A sophisticated operation targeting Ledger hardware wallet users has resulted in the theft of an estimated $86 million to $93 million from over 300 wallets. The perpetrators appear to have strategically converted a significant portion of the stolen Tether (USDT) stablecoins into Decentralized USD (USDD) to circumvent Tether’s ability to freeze the assets.

    On-chain investigators, including Specter and MistTrack, traced the illicit funds across multiple blockchains, including Ethereum, Tron, and Bitcoin, on October 9, 2026.

    Tether, the issuer of USDT, was quick to respond, blacklisting over 20 addresses associated with the stolen assets and freezing approximately $10 million in USDT. However, the suspected attacker adapted rapidly. On the same day, using the SUN.io platform, they swapped roughly 14.7 million USDT for approximately 14.6 million USDD. While this conversion incurred a slight value loss, it effectively moved the funds beyond Tether’s direct control, as USDD operates outside Tether’s freeze mechanisms.

    The Ethereum portion of the stolen assets followed a different path. Around 430 ETH, valued at approximately $1.07 million, was reportedly laundered through Tornado Cash, a privacy-enhancing mixer. Some of these funds were subsequently traced to hot wallets belonging to the cryptocurrency exchange Binance.

    Remaining Stolen Assets Valued at Over $70 Million

    Despite the successful evasion of freezes for a substantial portion of the funds, the wallets linked to the thefts are estimated to still hold approximately $70.6 million in various cryptocurrencies. The breakdown of these remaining assets includes:

    • Ethereum (ETH): Roughly 11,406 ETH, valued at about $28 million.
    • Bitcoin (BTC): 213 BTC, worth approximately $17.6 million.
    • Decentralized USD (USDD): 13.65 million USDD, valued at about $13.65 million.
    • Tether (USDT): 10.91 million USDT, a portion of which has been frozen by Tether.

    Ledger Investigates Potential Supply-Chain Compromise

    The wave of thefts has been linked to Ledger hardware wallets purchased through CryptoBilis, a reseller operating in Southeast Asia, specifically in Indonesia, Malaysia, and the Philippines.

    In response, Ledger has launched an investigation into a potential supply-chain compromise and has suspended all sales through CryptoBilis. The company has advised customers who recently purchased wallets from the reseller to transfer their funds to new wallets with freshly generated seed phrases as a precautionary measure.

    Sophisticated Operation Highlights Stablecoin Freeze Limitations

    Investigators described the operation as highly planned and targeted, rather than random. The coordinated draining of over 300 wallets, followed by the strategic segregation of assets based on their susceptibility to freezes, underscores the attackers’ meticulous approach. The conversion of USDT to USDD after Tether’s intervention highlights a significant vulnerability in stablecoin freeze capabilities. Tether’s blacklisting mechanism is limited to USDT, allowing other stablecoins like USDD to bypass such controls.

    This incident is not the first time Tether’s blacklisting has prompted illicit actors to shift funds to USDD. In September 2026, a sanctioned marketplace reportedly moved its assets to USDD after Tether froze over $45 million in linked USDT.

    The reported movement of some stolen funds into Binance hot wallets places centralized exchanges in a position to potentially identify and hold these deposits, provided they can be accurately traced and linked to the illicit activity.

  • Bitcoin Holder Loses $5.2 Million in BTC After Ledger Hack

    Bitcoin Holder Loses $5.2 Million in BTC After Ledger Hack

    Millions in Crypto Vanish After Users Purchase Compromised Ledger Devices from Reseller

    A cryptocurrency holder has reported the loss of 80 Bitcoin, valued at approximately $5.2 million, after transferring the digital assets to a Ledger hardware wallet. The device in question was not purchased directly from Ledger, the manufacturer, but rather from CryptoBilis, a reseller operating in Southeast Asia. The transfer to the new hardware wallet occurred just one week prior to the funds disappearing.

    This significant Bitcoin loss is not an isolated incident. A number of other buyers who acquired Ledger devices through the same reseller have also come forward with reports of substantial financial losses.

    Ledger confirmed on October 9, 2026, that it has launched an investigation into fund losses linked to CryptoBilis. The company has opted to issue guidance to affected customers without waiting for the full investigation to conclude.

    Customers who purchased a Ledger device from CryptoBilis within the last 90 days have been strongly advised not to initialize their new devices. Ledger is further recommending that these buyers transfer their existing assets to newly set-up Ledger wallets, utilizing different seed phrases to ensure security.

    Another victim has reported losing 7 million USDT, a stablecoin pegged to the U.S. dollar. This user had acquired their Ledger device three weeks before the incident.

    On-chain analysts have been tracking the flow of stolen assets across multiple blockchain networks, identifying funds directed to known theft addresses. These trackers have flagged approximately $17.7 million in Bitcoin and an equivalent of $29 million in Ethereum currently held in wallets associated with these thefts.

    Estimates from analysts suggest the total financial damage could range from $72 million to over $87 million, distributed across a multitude of victim wallets.

    The precise cause of these losses remains unconfirmed. However, speculation is currently focused on two primary possibilities: supply-chain tampering, where a device is compromised before it reaches the end-user, or sophisticated phishing attacks designed to trick users into divulging sensitive information.

    To date, there have been no reports indicating that Ledger devices purchased through official, direct channels have been affected. This suggests the issue is localized and specifically tied to the reseller, CryptoBilis. The reseller’s operational reach extends across Southeast Asian markets, including Indonesia, Malaysia, and the Philippines.

    If supply-chain tampering is identified as the root cause, it would highlight a critical vulnerability in the security model, particularly if hardware can be compromised prior to delivery. Conversely, if phishing attacks are found to be responsible, the focus would shift to user behavior and the methods employed to target victims.

    For now, the recommended course of action for affected individuals is clear. Anyone who purchased a Ledger device from CryptoBilis within the past 90 days is urged to adhere to Ledger’s guidance: do not initialize the device and promptly move any existing funds to a new Ledger wallet secured with a different seed phrase.

    Ledger’s ongoing investigation will be crucial in determining the exact sequence of events, whether the reseller was complicit in the scheme or a victim itself, and if the extent of the financial damage surpasses current estimates.

  • Bitcoin at $82,800: Analysts Warn as ETF Demand Falters

    Bitcoin at $82,800: Analysts Warn as ETF Demand Falters

    Spot Bitcoin ETFs See Significant Outflows as Price Struggles

    US spot Bitcoin exchange-traded funds (ETFs) experienced net outflows totaling $729 million over the last two trading sessions, data from Farside Investors reveals, as the cryptocurrency grappled with reclaiming a key breakout level.

    The funds saw withdrawals of $484.9 million on October 7 and an additional $244.1 million on October 8. These outflows reversed a $118.8 million inflow recorded on October 6, pushing the net outflows across the four sessions beginning October 5 to $700 million.

    Key Resistance Level Identified

    In analysis shared on October 9, Bitunix analysts pinpointed $82,800 as the critical level Bitcoin must reclaim to regain upward momentum. Their assessment placed Bitcoin (BTC) trading near $82,500 following a rebound from an intraday low of approximately $80,434.

    Bitcoin had previously retreated from its October 5 peak of nearly $86,995, declining by approximately 2.6% on October 7 and another 1.9% on October 8, according to Bitunix. The exchange noted that any recovery remained unconfirmed as long as the price traded below the $82,800 mark.

    Derivatives Market Activity

    The recent price decline coincided with a reduction in derivatives exposure. Open interest, a measure of outstanding derivatives positions, had climbed to $28.162 billion on October 6 before falling to $26.972 billion by October 8.

    By October 9, open interest had seen a modest recovery to $27.134 billion, though it remained about 3.7% below its October 6 high. Bitunix stated that this slight increase alone did not signal renewed buying interest.

    Liquidation Trends and Market Sentiment

    The ability of Bitcoin to reclaim the $82,800 level is considered a more significant indicator. Liquidation data indicated that bullish positions bore the brunt of the recent losses, with Bitunix reporting approximately $220.17 million in Bitcoin long liquidations compared to $45.71 million in short liquidations, a ratio of roughly 4.8 to one.

    Across the broader cryptocurrency market, the commentary highlighted $930.49 million in long liquidations and $162.06 million in short liquidations. The exchange cautioned that substantial liquidations alone do not confirm a market bottom, emphasizing that price stabilization and renewed spot demand would offer stronger evidence.

    Trader Positioning and Future Outlook

    Trader positioning remains divided. Two prominent account groups tracked in the analysis exhibited significantly more short exposure than long exposure, while groups identified as “Super Whales” and “Smart Money” showed a leaning towards long positions.

    Bitunix clarified that these classifications reflect reported positions rather than investors’ complete strategies, noting that they can include hedging activities and should not be interpreted as standalone price forecasts.

    A sustained move above $82,800, coupled with healthier derivatives positioning and a decrease in ETF outflows, could pave the way for another test of the $85,000 to $87,000 price region, according to the exchange.

    Conversely, repeated rejections below this threshold, followed by a break below the recent low near $80,400, would likely shift market attention towards the $79,700 to $77,000 demand zone. Bitunix identified $70,500 to $72,900 as a deeper potential support area should selling pressure intensify.

    For the time being, the exchange views Bitcoin’s current rebound as a test of its recent breakout rather than a confirmed recovery. Reclaiming $82,800 and observing improved spot flows would strengthen the case for a relief rally following the reduction in leveraged exposure.

  • Bitcoin Plummets as Strategy’s Stash Peaks Ahead of CPI

    Bitcoin Plummets as Strategy’s Stash Peaks Ahead of CPI

    Bitcoin and the broader cryptocurrency market have experienced a sharp downturn in the past week, reversing the significant gains seen in late August and September.

    Market Turmoil

    Last Friday, our market update noted a 2% rise in Bitcoin, with the largest cryptocurrency trading near $86,000. However, signs of weakness emerged later that night as the asset fell below $84,000. While it managed to recover above $84,000 on Saturday and reached $85,000 on Sunday, an attempt to breach the $87,000 resistance level on Monday morning proved unsuccessful.

    The real trouble began in the following hours. Bitcoin dipped to $85,000, briefly rebounded to $86,600, but this proved to be a false rally. The cryptocurrency then slumped again, falling below $84,000. After another failed attempt to bounce back, BTC experienced its most significant decline since its mid-August breakout.

    Within approximately a day, Bitcoin plummeted to under $80,400, marking its lowest price since September 21. Several factors are believed to have contributed to this sharp fall, including substantial profit-taking, outflows from Bitcoin ETFs, macroeconomic developments, and fear, uncertainty, and doubt (FUD) triggered by major transfers from wallets associated with the U.S. government.

    Recovery and Outlook

    After shedding nearly $7,000 in a matter of days, Bitcoin saw a more significant rebound today, climbing above $83,000 as of press time. However, it remains uncertain whether this represents a genuine recovery or a temporary “dead-cat bounce.”

    Despite the recent rebound, the weekly performance remains in negative territory. Bitcoin has fallen by over 3%, while Ethereum has seen a decline of more than 8%. XRP is down 8.6%, and cryptocurrencies such as ZEC, DOGE, LINK, RAIN, XLM, and BCH have all experienced double-digit percentage drops. Consequently, the total cryptocurrency market capitalization has fallen by over $150 billion since last Friday.

    The upcoming week is anticipated to be even more volatile, with the announcement of September’s Consumer Price Index (CPI) numbers on Wednesday expected to influence market sentiment.

    Market Snapshot (October 9)

    • Market Cap: $3.050 trillion
    • 24H Volume: $113 billion
    • BTC Dominance: 56.6%
    • BTC: $85,670 (+1.9%)
    • ETH: $2,710 (+0.4%)
    • XRP: $1.51 (-4.8%)

    Other Market Developments

    Bitcoin’s Post-Midterm Performance: Analysts are examining three key factors that could shape Bitcoin’s performance following the upcoming U.S. midterm elections. Historically, BTC has shown strong performance in the 12 months after these elections, though XWIN Japan has cautioned that past gains are not indicative of future results.

    Lattice Cryptography Debate: Cardano founder Charles Hoskinson has publicly disagreed with Vitalik Buterin’s warnings regarding lattice-based cryptography. Hoskinson argued on X that no credible attacks have been identified against this cryptographic method and suggested that hash-based cryptography is not inherently more secure.

    Russia’s Regulatory Progress: While the U.S. has seen delays in passing legislation like the CLARITY Act, Russia has taken a significant step towards a regulated crypto market by registering its first digital asset operators under the oversight of its central bank.

    Arthur Hayes on AI and Bitcoin: Former BitMEX CEO Arthur Hayes reiterated his view that the artificial intelligence industry is overbuilt. He predicted a potential crash in data centers, which he believes could ultimately benefit Bitcoin.

    Metaplanet’s Bitcoin Strategy: Metaplanet, a major Asian corporate holder of Bitcoin, disclosed in its Q3 filing that it sold 10,000 BTC during the period. However, the company subsequently repurchased 11,000 BTC at slightly higher prices, stating the move was intended to demonstrate the liquidity of its treasury.

    Strategy’s Record Bitcoin Holdings: The largest corporate holder of cryptocurrency announced its third consecutive Bitcoin purchase, bringing its total holdings to a new all-time high of 848,000 BTC.

    This week’s analysis also includes chart reviews of Ethereum, Ripple, Cardano, Binance Coin, and Hyperliquid.

  • US Spot Bitcoin ETFs See Consecutive Outflows Amid Broader Market Pressures

    US Spot Bitcoin ETFs See Consecutive Outflows Amid Broader Market Pressures

    US spot Bitcoin ETFs experienced net outflows totaling approximately $729 million across October 7 and 8, marking the second consecutive day of withdrawals. This trend has erased early October inflows, leaving the month slightly in negative territory, according to daily flow data.

    The outflows occurred against a backdrop of broader market pressures, including rising oil prices, increasing Treasury yields, and a strengthened U.S. dollar. These external factors may be influencing institutional investors’ near-term exposure to digital assets, suggesting institutional holders are reassessing near-term exposure.

    On October 7, net outflows from U.S. spot Bitcoin ETFs reached $484.9 million, with BlackRock’s IBIT seeing $207.7 million in redemptions. The following day, October 8, saw continued outflows totaling $244.1 million, including $197.1 million from Fidelity’s FBTC.

    While these recent outflows are notable, they must be considered within a larger context. The five-day net outflow figure reached $512.4 million. However, the 21-day window for net flows remained modestly positive, and cumulative inflows since the ETFs’ January 2024 launch stand at around $57.09 billion. Total assets under management in these ETFs are approximately $104.91 billion to $105 billion.

    Bitcoin’s price action during this period saw the cryptocurrency trading between $81,500 and $83,000. The price briefly dipped below the $81,000 level this week. It remains uncertain whether ETF holders will remain patient if Bitcoin’s price breaks below $81,000, introducing an element of uncertainty regarding future investment behavior.

    Historically, Bitcoin ETFs have navigated periods of both deficits and significant inflows. For instance, in September 2026, these ETFs had year-to-date flows of $2.4 billion, a recovery from an earlier deficit of roughly $5.8 billion in 2026. The current outflows, while significant in the short term, represent a small fraction of the total assets under management and do not necessarily signal a definitive trend reversal, especially when viewed against the backdrop of substantial cumulative inflows.

    Why This Matters

    The materials describe a narrow update: US spot Bitcoin ETFs saw net outflows totaling approximately $729 million across October 7 and 8, following a period of inflows. Whether ETF holders will remain patient if Bitcoin’s price breaks below $81,000.

    Broader Context

    Source materials place the factual news in this context: US spot Bitcoin ETFs just had a rough couple of days.

  • Bitcoin Surges Past $81,000 Amidst $1 Billion Liquidations

    Bitcoin Surges Past $81,000 Amidst $1 Billion Liquidations

    Bitcoin’s price extended its decline for a fourth consecutive day, briefly dipping below $81,000 before recovering, as the total cryptocurrency market capitalization fell below $2.8 trillion to a one-month low. The immediate concern is whether Bitcoin can withstand volatile spot Bitcoin ETF flows, forced selling, and a less favorable macroeconomic environment.

    Key Support Levels Under Pressure

    Currently, $80,000 represents both a psychological barrier and a critical dividing line for Bitcoin’s recent bullish trend. While the price has not yet confirmed a definitive break below this level, the prevailing pressure makes it a more significant test than a typical intraday fluctuation. Demand from Bitcoin ETFs is now a factor in this crucial test, although daily fund flows do not establish a fixed price floor.

    Momentum in spot ETF inflows had previously slowed and shifted to net outflows over the preceding four trading days. This change has removed a significant source of demand that had been underpinning the market.

    Macroeconomic Headwinds Mount

    The broader economic landscape is adding further pressure. Rising U.S. Treasury yields, a strengthening dollar, and a general aversion to risk among investors can weigh on high-beta assets as they re-evaluate the cost of holding risk. The resulting pressure from yields and the dollar on Bitcoin is significant because it can dampen demand even without any crypto-specific catalysts.

    Derivatives Fuel Forced Selling

    Derivatives markets provided a more direct source of forced selling. Over a 24-hour period, more than 180,000 traders faced liquidations, with total crypto liquidations exceeding $1 billion, including $940 million in long positions.

    As leveraged long positions were unwound amid falling prices, these liquidations contributed to short-term downward momentum. This also illustrates how sharp market movements are not solely driven by spot selling. Broader cryptocurrency leverage and liquidation pressures can amplify price breaks, leaving the market vulnerable to further forced closures if prices continue to decline.

    Technical Outlook and Potential Downside

    Bitcoin briefly traded below $82,000 a few hours ago before reclaiming the level. The failure to maintain a close above $82,000 serves as a warning that the bullish structure may be compromised, with $80,000 now acting as the next, more decisive confirmation level.

    A decisive break below $80,000 would pose a threat to the higher-low trend that has been intact since July. Subsequent support levels are analytical downside areas rather than guaranteed targets, marking potential zones where the market might find support if selling pressure persists.

    Broader Market Weakness

    The selling pressure was not confined to Bitcoin. Major crypto assets experienced declines of 3% to 5% over 24 hours, with Ethereum trading near $2,400, BNB around $720, and XRP around $1.40. This widespread weakness is consistent with a market-wide reduction in risk appetite, rather than a move isolated to Bitcoin.

    Path to Stabilization

    A sustained hold above $82,000, coupled with a stabilization in ETF flows, would alleviate the immediate pressure on support levels. Neither of these conditions has been established by the brief rebound alone. The latest price action shows Bitcoin reclaiming a level after trading below it.

    The downside scenario becomes more concerning if Bitcoin decisively loses $80,000 while ETF outflows continue, long liquidations persist, Treasury yields climb, and the dollar strengthens further. In such a scenario, the $75,000 area would come into focus.

    For now, Bitcoin’s $80,000 support remains a risk line rather than a confirmed breakdown. The next signals to watch will be whether the price can hold above $82,000 and whether selling pressure abates. Without such stabilization, ETF outflows and leveraged positioning leave the market exposed to another test of its structural floor.