Tag: Negative

  • XRP Faces Resistance After $1.50 Rejection, Possible Drop to $1.

    XRP Faces Resistance After $1.50 Rejection, Possible Drop to $1.

    XRP Struggles to Maintain Key Support as Analysts Weigh Potential Price Movements

    As XRP attempts to hold a critical support level, analysts are scrutinizing key indicators that could determine whether the recent price decline is temporary or the start of a more significant correction.

    Technical Indicators Signal Caution

    XRP continued its recent downward trend on Tuesday, falling to approximately $1.35, its lowest point since late April. The cryptocurrency has been trading between $1.36 and $1.50 for the past month, repeatedly attempting to break above the upper boundary. Last Thursday, the altcoin briefly surpassed this key resistance level, reaching a two-month high of $1.54, driven by developments related to the CLARITY Act. However, the price was quickly rejected from this level, resulting in a roughly 12% drop over the past five days.

    Market analyst ChartNerd observed that XRP risks further price correction towards new lows as the altcoin retests the $1.35 area, stating that “the data speaks for itself.” The analyst pointed to several concerning signals, including significant resistance levels above and the confirmation of a “death cross” on the weekly Stoch RSI.

    ChartNerd highlighted the weekly 20 and 50 EMAs, currently at $1.50 and $1.80, as crucial resistance levels that have not been retested since their January 2026 crossover, which preceded XRP’s decline to its February low of $1.11. He also noted that the weekly Stoch RSI crossover has historically marked local tops for XRP, with the last two crosses leading to deeper corrections. The most recent crossover coincided with the relief rally that preceded the weekly EMA death cross four months ago.

    Following the recent rally to $1.54, the price has now retested the weekly 20 EMA for the first time since the January crossover. ChartNerd suggested that failure to break above this level and establish it as sustained support “will likely open the next leg down later this year.”

    Potential Price Targets and Market Sentiment

    ChartNerd emphasized that XRP must reclaim both EMAs and convert them into support to invalidate the bearish outlook, but added that “it just doesn’t feel like the right time yet.” Even if the altcoin rallies towards $1.80, the analyst believes the price will likely fail to hold that level long-term and “at least come back to, at a minimum, fill in most of this wick back down towards the lower dollar levels.” He explained that a rejection from these EMAs could potentially push the altcoin towards a cycle bottom of $0.70, a previous level of macro resistance that has not yet been retested.

    Meanwhile, analyst Ali Martinez believes XRP is poised for a significant price movement. He noted that the altcoin has been developing the “tightest Bollinger Band squeeze” on the three-day chart in over a year, describing the current compression zone as a “definitive ‘no-trade zone.’” Martinez indicated that such tight volatility compression often precedes a “violent price expansion.” He advised investors to await a clear three-day candlestick close outside of XRP’s current range, between $1.29 and $1.50, to confirm the next major trend direction. A close above the upper boundary would likely signal an expansion towards $1.80. Conversely, a breakdown below the lower boundary would invalidate the immediate bullish structure and potentially lead to a deeper correction towards the $1.00 psychological support level.
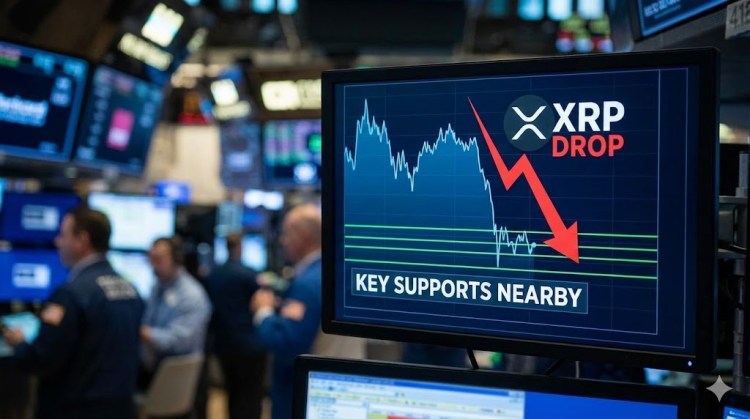

  • XRP Price Faces Further Downside Risk

    XRP Price Faces Further Downside Risk

    XRP Price Dips Below $1.40

    The price of XRP has continued its downward trend, trading below $1.40. The cryptocurrency is currently consolidating losses and facing resistance levels at $1.3650 and $1.3940.

    Technical Analysis

    XRP began another decline, falling below the $1.40 mark. It is now trading below $1.3880 and the 100-hourly Simple Moving Average. A bearish trend line is forming, with resistance at $1.3720 on the hourly chart of the XRP/USD pair, according to data from Kraken. The pair could continue to decline if it remains below $1.40.

    XRP failed to maintain its position above $1.4150 and extended its decline, mirroring the trends of Bitcoin and Ethereum. The price dropped below $1.4050 and $1.40, entering a short-term bearish zone and even extending losses below $1.380. A low of $1.3464 was established, and the price is currently consolidating losses well below the 23.6% Fibonacci retracement level of the downward move from the $1.5495 swing high to the $1.3464 low.

    The price is trading below $1.3880 and the 100-hourly Simple Moving Average. If a recovery occurs, the price may encounter resistance near the $1.3650 level. A bearish trend line is also forming, with resistance at $1.3720 on the hourly chart of the XRP/USD pair. The initial major resistance is near the $1.380 level, with the primary resistance at $1.3940. A close above $1.3940 could potentially push the price towards $1.40. The next hurdle is at $1.4250, which is also the 50% Fibonacci retracement level of the downward move from the $1.5495 swing high to the $1.3464 low. A clear move above the $1.4250 resistance could drive the price towards the $1.440 resistance, with further gains potentially leading to the $1.450 resistance.

    Potential for Further Losses

    If XRP fails to surpass the $1.40 resistance zone, a fresh decline could be triggered. Initial support on the downside is near the $1.3465 level, with the next major support near $1.3350. A break below $1.3350 could lead to a further decline towards $1.3220. The subsequent major support is near the $1.320 zone, below which the price could continue to fall towards $1.3120.

    Technical Indicators

    • Hourly MACD: The MACD for XRP/USD is gaining momentum in the bearish zone.
    • Hourly RSI (Relative Strength Index): The RSI for XRP/USD is currently below the 50 level.

    Key Levels

    • Major Support Levels: $1.3465 and $1.3350.
    • Major Resistance Levels: $1.3720 and $1.3940.
  • Warren: Crypto Bank Charters for Coinbase, Ripple Illegal

    Warren: Crypto Bank Charters for Coinbase, Ripple Illegal

    Senator Elizabeth Warren (D-MA) is seeking answers from the Office of the Comptroller of the Currency (OCC) regarding its approval of national trust bank charters for cryptocurrency companies during the Trump administration.

    Concerns Over Crypto Charters

    In a letter sent Monday to Comptroller of the Currency Jonathan Gould, Warren asserted that these approvals contravene the National Bank Act and pose “serious risks” to the stability of the U.S. banking system.

    “These companies are effectively crypto banks that want to evade the fundamental safeguards and obligations that come with being a bank,” Warren stated.

    The OCC has granted national trust banking charter applications to nine companies and their affiliates, including Coinbase, Circle, Ripple, Paxos, BitGo, Fidelity, Crypto.com, Stripe, and Protego.

    Since President Donald Trump’s return to office last year, the OCC, a division of the Treasury Department, has approved nine national trust banking charter applications for crypto-focused firms.

    National trust companies are subject to less stringent regulation than traditional banks, but they also have limitations on the services they can offer. They typically provide fiduciary services, such as managing assets on behalf of others, but do not accept customer deposits.

    Stablecoin and Regulatory Oversight

    Following the passage of the stablecoin-focused GENIUS Act last year, numerous crypto companies have applied for national trust banking charters to facilitate the issuance, redemption, and custody of stablecoins and their backing funds, among other functions. Stablecoins are cryptocurrencies typically pegged to the value of the U.S. dollar.

    In her letter to the OCC, Warren argued that these companies “look like crypto banks, not trust companies.”

    “The business plans include language that suggests the companies intend to engage in non-fiduciary custodial activities, facilitating payments and lending activities, and conducting stablecoin activities closely related to deposit-taking,” she explained.

    Warren has requested detailed information from the OCC about the crypto banks’ approved bank charters, including whether the regulator allows national trust companies to engage in non-fiduciary activities. She also requested copies of all correspondence between OCC officials and President Trump, his family, and his associates regarding the approval of crypto-focused national trust applications.

    Previous Confrontation

    The progressive senator and the OCC’s Gould previously clashed publicly in February during a Senate hearing. Warren questioned Gould about a pending national trust bank application from World Liberty Financial, a crypto company associated with the Trump family. Gould declined to commit to delaying or denying the application, leading Warren to accuse him of being “an accomplice” to alleged corruption.

    At an event earlier this month, World Liberty co-founder Zach Witkoff stated that the company is “in the final stages” of receiving conditional approval from the OCC.

  • XRP Hodlers Divided as ETF Hopes Fade, $27 Target Remains.

    XRP Hodlers Divided as ETF Hopes Fade, $27 Target Remains.

    XRP Price Faces Conflicting Signals Amid Market Uncertainty

    The price of XRP is currently trading below its support level, creating a divergence between short-term technical indicators and long-term price predictions. This situation presents a complex outlook for the cryptocurrency, with both bearish and bullish arguments supported by available data.

    Bearish sentiment is fueled by XRP’s position below all major moving averages. Data reinforces this, with market sentiment registering 89% bearish and a Fear & Greed score of 39. Furthermore, institutional demand for Exchange Traded Funds (ETFs) has cooled, removing a key argument for near-term price increases.

    The broader market environment, led by Bitcoin, is also contributing to the uncertainty. Risk-off behavior is evident, with 30-day volatility exceeding 3%, indicating potential panic selling. Sentiment has retreated from early-year highs, leaving XRP caught between opposing forces.

    Technical Analysis and Price Levels

    At $1.38, XRP is currently at its immediate support level. Resistance begins at $1.40, with a more significant ceiling at $1.45, representing a potential 5% increase from the current price.

    The Relative Strength Index (RSI) on the daily chart is approximately 42, indicating a neutral position but trending toward oversold territory. The weekly RSI is already in oversold territory, around 38. This divergence often precedes a sharp reversal or extended consolidation period.

    Potential Scenarios

    If XRP can surpass the $1.45 resistance level with increased trading volume and daily Exponential Moving Averages (EMAs) begin to compress, momentum could shift, potentially driving the price toward $1.65–$1.80 in the coming weeks. Regulatory developments could accelerate this upward movement.

    Alternatively, the price may consolidate within the $1.35–$1.45 range for an extended period as the market awaits a new catalyst. The weekly oversold reading could limit any further price declines.

    CoinLore’s 10-day forecast projects relatively stable price action around current levels. The current market conditions suggest that patience may be the most prudent approach.

    Market Dynamics and Alternative Investments

    As a blue-chip asset, XRP’s recent performance, including a 5% weekly decline while trading below major moving averages, has prompted some traders to explore earlier-stage investment opportunities. This shift is not necessarily a reflection of a broken XRP thesis but rather a response to the compressed near-term risk/reward profile.

    This rotation has drawn attention to presales with asymmetric structures, such as Maxi Doge ($MAXI). Maxi Doge is a meme token on Ethereum, built around the “Leverage King” trading culture.

    The presale has raised over $4.7 million at a current price of $0.00028, with a 65% Annual Percentage Yield (APY) staking bonus for early participants. Features include holder-only trading competitions with leaderboard rewards and a dedicated Maxi Fund treasury.

  • Dogecoin Tests $0.10 Support Amidst Decline

    Dogecoin Tests $0.10 Support Amidst Decline

    Dogecoin Slides Further, Facing Potential Hurdles

    Dogecoin has begun a fresh decline, falling below the $0.1080 mark against the US Dollar. The cryptocurrency is currently consolidating its losses and could encounter resistance near $0.1065 and $0.1075.

    Technical Analysis

    The price of DOGE has initiated a new downward trend, trading below $0.1075 and the 100-hourly simple moving average. A bearish trend line is forming, with resistance at $0.1075 on the hourly chart of the DOGE/USD pair, according to data from Kraken. Further losses are possible if the price remains below $0.1075 and $0.110.

    Price Movement

    Following a close below $0.110, Dogecoin’s price has declined, mirroring trends seen in Bitcoin and Ethereum. DOGE fell below support levels at $0.1080 and $0.1050, briefly dipping towards $0.1020. A low was established near $0.1025, and the price is exhibiting bearish signals, trading well below the 23.6% Fibonacci retracement level of the downward movement from the $0.1127 swing high to the $0.1025 low.

    Dogecoin is currently trading below $0.1065 and the 100-hourly simple moving average. Immediate resistance on any recovery wave is near $0.1065. The bearish trend line, with resistance at $0.1075 on the hourly chart, is also a factor. This level is close to the 50% Fibonacci retracement level of the downward move from the $0.1127 swing high to the $0.1025 low.

    Potential Price Targets

    The initial major resistance for bulls could be near $0.110. A close above this level might push the price towards the $0.1120 resistance. Further gains could see the price targeting $0.1190, with the next significant target for bulls potentially at $0.120.

    Downward Risks

    If DOGE fails to surpass $0.1075, further declines are likely. Initial support on the downside is near $0.1020, followed by the next major support at $0.10. The primary support level is at $0.0965. A break below this level could lead to further declines, potentially towards $0.0920 or even $0.090 in the short term.

    Technical Indicators

    The hourly Moving Average Convergence Divergence (MACD) for DOGE/USD is currently gaining momentum in the bearish zone. The hourly Relative Strength Index (RSI) for DOGE/USD is below the 50 level.

    Major Support Levels: $0.1020 and $0.1000.
    Major Resistance Levels: $0.1065 and $0.1075.

  • Ethereum Whales Deposit 225,000 ETH on Binance, Biggest Inflow Since 2022

    Ethereum Whales Deposit 225,000 ETH on Binance, Biggest Inflow Since 2022

    Ethereum has fallen below the $2,150 level as a combination of selling pressure and market uncertainty erases the recovery that had been building since the February lows. The decline is not gradual; it appears to be a market encountering a pre-positioned and waiting supply. Data from CryptoOnchain has identified the origin of this supply, revealing a picture more concerning than a routine price correction.

    Significant Inflow to Binance

    In a single day, over 225,000 ETH was deposited to Binance, marking the largest net inflow the exchange has recorded in the past six months. The seven-day moving average of exchange netflow has surged to levels not seen since late 2022, a period many in the Ethereum market remember as one of its most challenging phases. When this specific indicator reaches such levels, it signals more than routine portfolio management. It indicates that large holders are making deliberate, significant decisions about the positioning of their assets.

    The behavioral implication is direct. Investors who keep Ethereum in cold storage – offline, inaccessible, and removed from trading – are moving coins onto the world’s largest exchange in volumes exceeding anything the market has absorbed in the past three years. Whether they intend to sell, rebalance, or deploy as collateral for derivatives positions, the act of moving such a large amount of ETH onto Binance is a signal the market cannot ignore. CryptoOnchain’s analysis attempts to determine the next steps of these large holders.

    Three Potential Reasons for the Inflow

    CryptoOnchain’s analysis identifies three potential motivations for a deposit of this scale and examines the implications of each for the market.

    The first possibility is profit realization. Large holders who accumulated Ethereum at lower prices and have been holding gains may have chosen the current price environment to convert those gains into realized returns. This behavior creates direct selling pressure that the market must absorb before the price can stabilize.

    The second possibility is defensive repositioning. Holders concerned about further price declines may be moving coins onto exchanges to facilitate faster exits. While they may not be selling yet, they are reducing the friction between their position and the sell button, increasing the likelihood of selling ETH.

    The third possibility is collateral deployment. Institutional participants moving ETH onto exchanges to back aggressive derivatives positions are not necessarily bearish on the asset. However, the leverage they build on top of that collateral creates the fragility that amplifies any adverse price movement.

    All three explanations lead to the same market consequence. The arrival of 225,000 ETH on Binance from cold storage represents supply previously unavailable to the market, now immediately accessible. CryptoOnchain’s assessment is direct: major holders are positioning defensively, and the market is entering a period of severe turbulence and highly unpredictable price action as that supply meets existing demand. Ethereum’s drop below $2,150 is the initial indication of this dynamic. The extent of the impact will depend on which of the three motivations is driving the largest share of the inflow, a question that will be answered in the coming sessions.

    Technical Analysis

    Ethereum is trading near $2,110 after losing the short-term recovery structure that supported the price throughout most of April and early May. The daily chart shows ETH breaking below the 100-day moving average while continuing to trade well below the 200-day moving average, indicating that the broader trend remains under pressure despite previous rebound attempts.

    After a strong recovery from the February capitulation event near $1,800, Ethereum established a local range between $2,200 and $2,400. However, repeated failures to reclaim higher resistance levels gradually weakened bullish momentum. The latest rejection near the $2,350 region triggered a new wave of selling pressure, pushing ETH back toward the lower end of its multi-week consolidation zone.

    Volume has also increased during the recent decline, suggesting that the price drop is driven by active selling rather than a passive lack of demand. This aligns with the recent surge in Binance ETH inflows, raising concerns about growing exchange-side supply pressure from larger holders. The $2,050-$2,100 region is now a critical short-term support area. If Ethereum decisively loses this zone, the market could revisit the broader demand region between $1,900 and $2,000, where buyers previously stepped in aggressively after February’s crash.

  • Hacker Drains $11M From Crypto Bridge

    Hacker Drains $11M From Crypto Bridge

    Verus-Ethereum Bridge Exploited for $11.58 Million

    Hackers have reportedly stolen $11.58 million from the Verus-Ethereum bridge, according to alerts from blockchain security platforms. The exploit targeted one of Verus’s cross-chain bridge contracts, resulting in the draining of reserves containing ETH, tBTC, and USDC.

    Suspicious Activity Detected

    Security firms CertiK and PeckShield flagged suspicious activity from the bridge contract at 0x71518580…cd7f63 within hours of the exploit. Their posts on X indicated that the stolen assets included 1,625 ETH, 103.56 tBTC, and 147,000 USDC. The attacker quickly converted the assets into approximately 5,402 ETH and transferred the funds to a separate wallet.

    Technical Breakdown of the Exploit

    Blockaid, another on-chain security firm, published a technical analysis of the incident. According to their report, the bridge correctly verified a notarized Verus state root, a Merkle proof of the cross-chain export, and a hash binding confirming the integrity of the transfer data. However, the bridge failed to validate whether the source-chain export’s stated amounts matched the payout.

    The attacker constructed a transaction on the Verus side for approximately 0.02 VRSC, worth about $0.01, which committed a keccak hash of a payout blob while listing empty source-side totals. The Verus protocol accepted the transaction, and the notaries signed the resulting state root without issue.

    On the Ethereum side, the attacker used submitImports() with a serialized transfer blob whose hash matched the committed value. The bridge then verified the hash, decoded the blob, and disbursed 1,625 ETH, 103 tBTC, and 147,000 USDC from its reserves to the attacker.

    In essence, the attacker spent about $10 in VRSC fees and received $11.58 million in return. The Blockaid report noted that there was no ECDSA bypass, no compromise of notary keys, and no parser or hash-binding bug. The vulnerability stemmed from a missing source-amount validation in the “checkCCEValues” function, which, according to the security firm, could be fixed with around ten lines of Solidity code.

    Broader Impact on the Crypto Sector

    Certik reported that the wider crypto sector lost over $650 million to malicious actors last month, with a significant portion of that amount resulting from two incidents: an attack on KelpDAO, which led to the theft of more than $292 million, and another on Drift Protocol, which lost over $285 million.

    Bridges are increasingly targeted, with the Verus exploit being the eighth incident involving such platforms this year. PeckShield estimates that attackers have stolen at least $328 million from these platforms.

    Market Reaction

    VRSC, the Verus native token, did not appear to react significantly to the news of the exploit. Data from CoinGecko indicates that the token remained largely flat on the day of the hack, with minimal movement in the 24-hour period leading up to the attack. At the time of writing, VRSC was trading at approximately $0.75, down 6% over 30 days, and had lost nearly 73% of its value in the past year.

  • Ethereum Price Affected by $11 Million DeFi Exploit

    Ethereum Price Affected by $11 Million DeFi Exploit

    Ethereum’s price is struggling, barely holding above $2,100, as a new protocol risk fuels bearish sentiment. A cross-chain bridge exploit has just resulted in the loss of over $11 million, occurring at a particularly sensitive moment for the cryptocurrency.

    Verus-Ethereum Bridge Hacked

    PeckShieldAlert reported that the Verus-Ethereum Bridge was exploited, resulting in the theft of 103.6 tBTC, 1,625 ETH, and 147,000 USDC. The attacker has already converted the stolen funds into 5,402 ETH, which are now held in a single wallet.

    The Verus-Ethereum bridge was the target of the attack. The perpetrator extracted the assets before swapping them for 5,402.4 ETH, valued at just over $11 million. This exploit follows a pattern of significant losses: Kelp DAO lost $293 million in April through LayerZero’s cross-chain messaging system, and the Drift attack earlier this year added $270 million to the industry’s losses.

    These bridge exploits consistently account for the largest individual losses each year. Oracle and protocol vulnerabilities also pose a systemic threat.

    Market Analysis and Outlook

    ETH is currently experiencing a bearish-to-neutral consolidation phase, with limited catalysts to reverse the trend. The current price is $2,110, and the Relative Strength Index (RSI) is at 34, indicating weak overall momentum.

    Key levels are defining the near-term range. Support is at $2,100; a close below this level could lead to further declines. Resistance is clustered at $2,200, with $2,250 as the next level if ETH breaks out.

    On-chain liquidity and the structure of the DeFi market suggest that the exploit will hinder any recovery. A shift away from smaller DeFi tokens is already evident. ETH needs a catalyst to initiate a rebound.

    The Future of Cross-Chain Infrastructure

    ETH’s consolidation near six-week lows, coupled with ongoing cross-chain infrastructure exploits, raises concerns for DeFi participants: what would a safer, unified liquidity architecture look like?

    The current fragmentation of assets across Bitcoin, Ethereum, and Solana creates high-value targets for attacks on bridges. The $293 million loss by Kelp DAO was due to a LayerZero messaging failure, not a smart contract bug.

    LiquidChain, a Layer 3 infrastructure project, is developing what it calls the Cross-Chain Liquidity Layer, aiming to merge BTC, ETH, and SOL liquidity into a single execution environment. The architecture is based on four components: a Unified Liquidity Layer, Single-Step Execution, Verifiable Settlement, and a Deploy-Once model that allows developers to access all three ecosystems without redeploying across chains.

    The presale token, $LIQUID, is currently priced at $0.0146, with $770,000 raised to date. The project is also offering a 1500% APY staking bonus for early buyers.