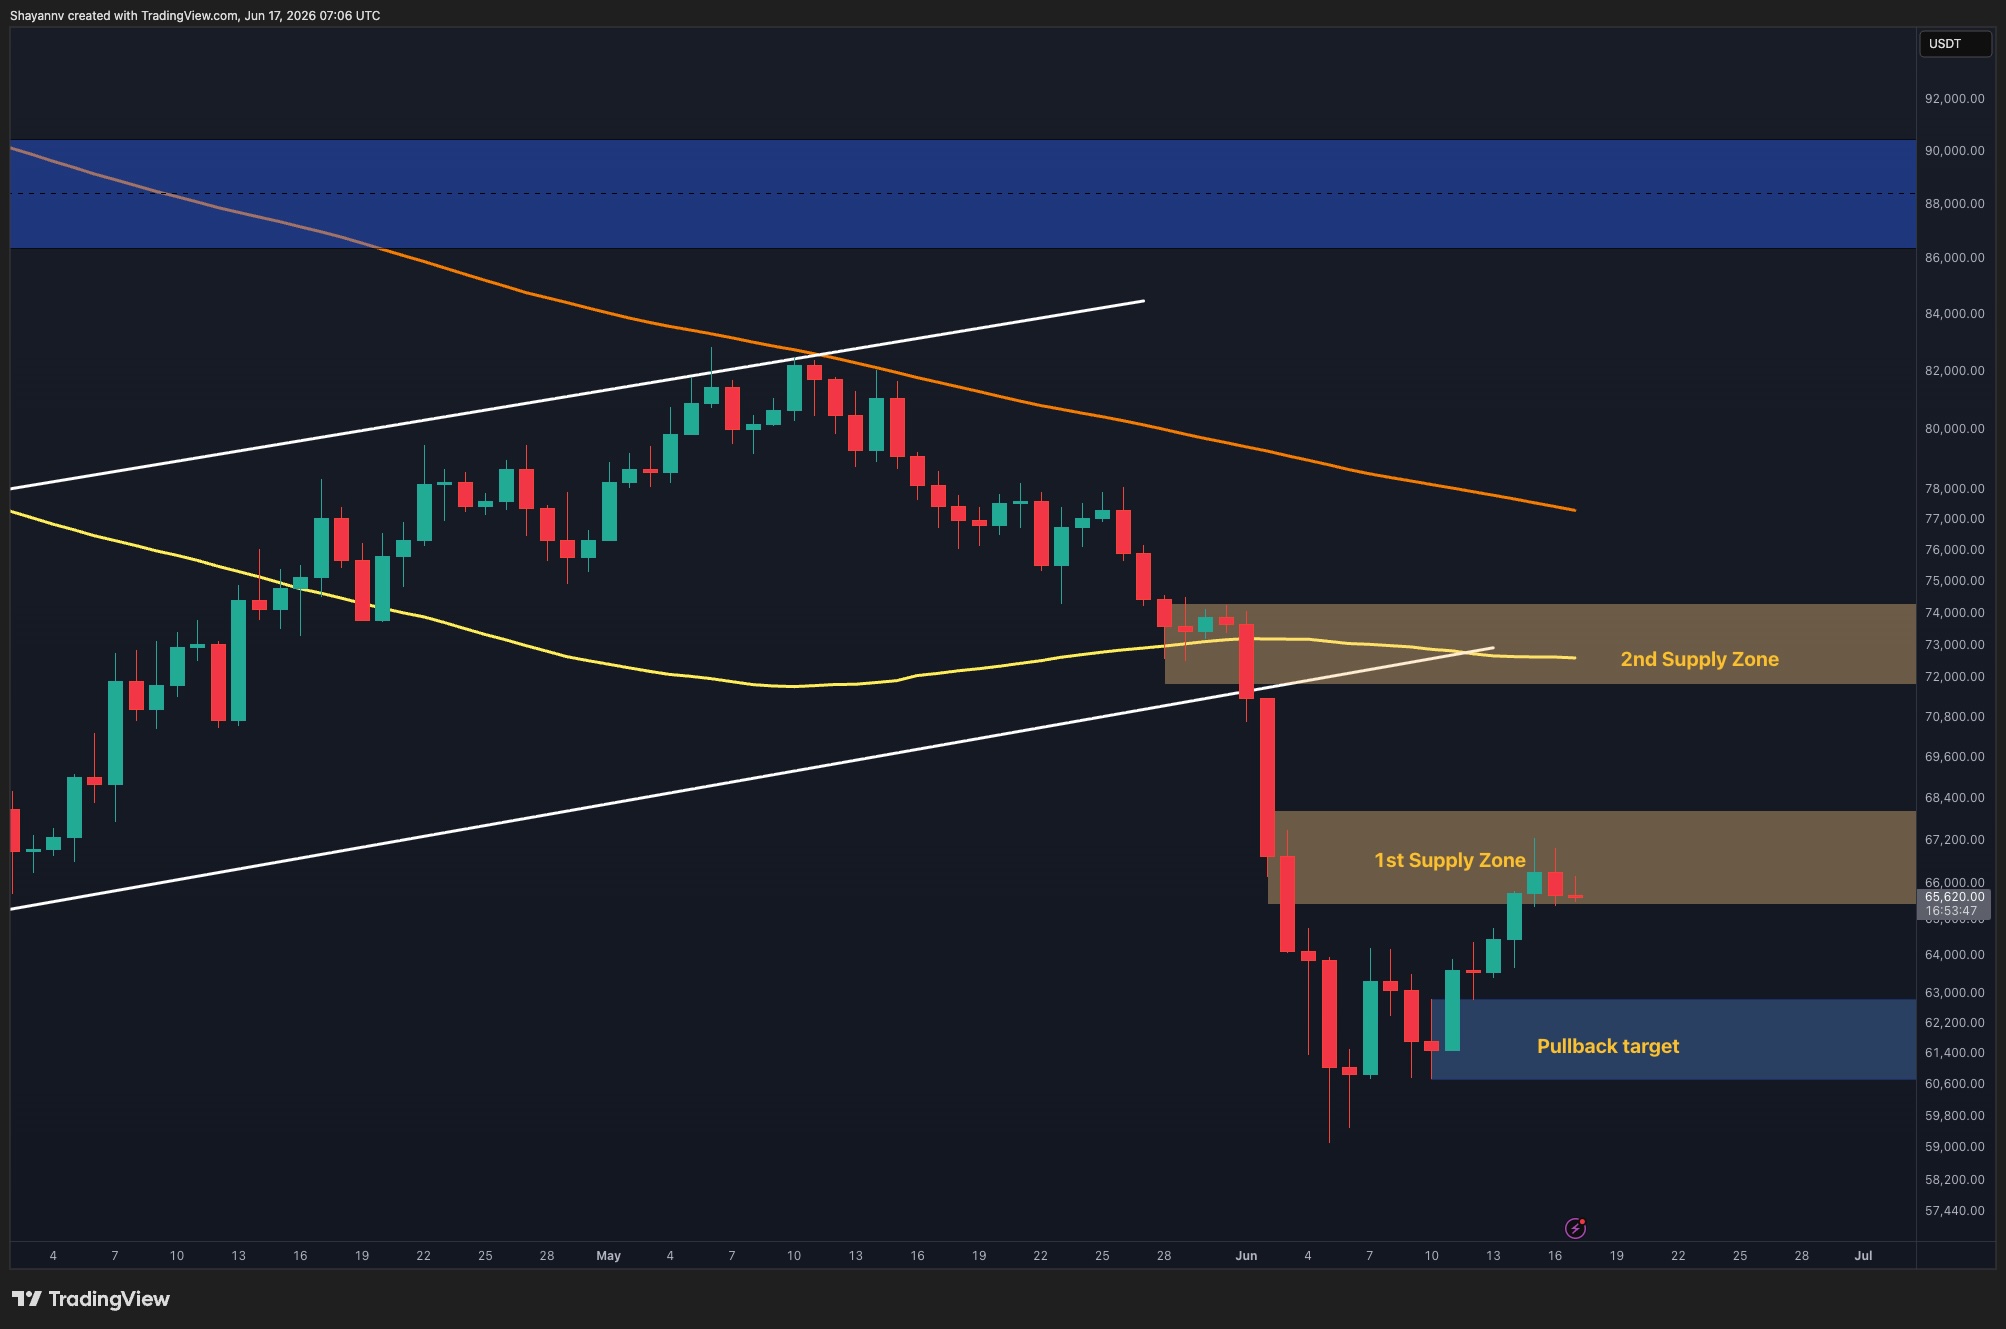
Bitcoin’s recovery has stalled after hitting a significant resistance cluster, with the cryptocurrency now consolidating below a key supply zone. Current price action indicates bulls are striving to maintain upward momentum, but the market is at a pivotal juncture where the next move—either a breakout or rejection—will likely dictate the short-term trend.
Daily Chart Dynamics
On the daily chart, Bitcoin is trading near $65,000, having rebounded from the $60,000 support level earlier this month. This recovery has propelled the price directly into the initial major supply zone, situated between $65,000 and $67,000, where selling pressure has begun to manifest.
Recent daily candles show consolidation within this resistance area rather than an immediate sell-off, which is generally viewed as a positive sign for buyers. However, Bitcoin remains below its 100-day moving average, which is hovering around $72,000, and its 200-day moving average, located near $77,000. This suggests that the broader upward trend has not yet fully re-established itself.
Should buyers successfully reclaim the current supply zone, the next upward target would be the higher resistance region between $72,000 and $74,000. This area is significant as it coincides with the second supply zone, the 100-day moving average, and the lower boundary of a previously breached ascending channel, presenting the next substantial obstacle for the market.
On the downside, the $60,000 to $62,000 range continues to serve as the critical support zone. As long as Bitcoin maintains its position above this level, the recent recovery structure is expected to remain intact.
Four-Hour Chart Perspective
The four-hour chart illustrates the recent rally into the $65,000-$67,000 supply zone, following a breakout from an ascending recovery channel. After reaching the upper limit of this zone near $66,800, Bitcoin has entered a phase of sideways consolidation.
The latest price movements suggest that neither bulls nor bears currently hold dominant control. The asset is holding above the former breakout region, roughly between $64,000 and $65,000, while sellers have so far prevented a decisive breach of the supply zone.
A breakout above $67,000 would bolster the bullish outlook and potentially pave the way toward the higher resistance area around $72,000. Conversely, a failure to hold the $64,000 support region could trigger a more significant pullback toward the demand zone between $61,000 and $62,000.
For the immediate future, the short-term technical structure remains constructive, provided that higher lows continue to form above the recent breakout area.
Liquidity Heatmap Analysis
The Binance liquidation heatmap reveals a notable concentration of liquidity both above and below the current price. However, the closest and most significant cluster of liquidity is situated between $67,000 and $69,000.
Given that Bitcoin is currently consolidating around $65,000, this overhead liquidity zone could act as a short-term magnet. A move through the current supply region might trigger liquidations of short positions, potentially accelerating momentum toward the $68,000-$69,000 area.
Concurrently, a substantial liquidity pocket exists below the market, between $62,000 and $63,000. If Bitcoin were to lose the $64,000 support area, the market could be drawn lower to absorb this liquidity before establishing its next directional trend.
Overall, the heatmap indicates that the market is currently positioned between two major liquidity pools. Considering the proximity of the upper cluster and Bitcoin’s ability to hold within the $65,000-$67,000 resistance zone, the short-term bias leans slightly toward an upward sweep of liquidity into the $67,000-$69,000 region before a more significant directional decision is made.
Leave a Reply