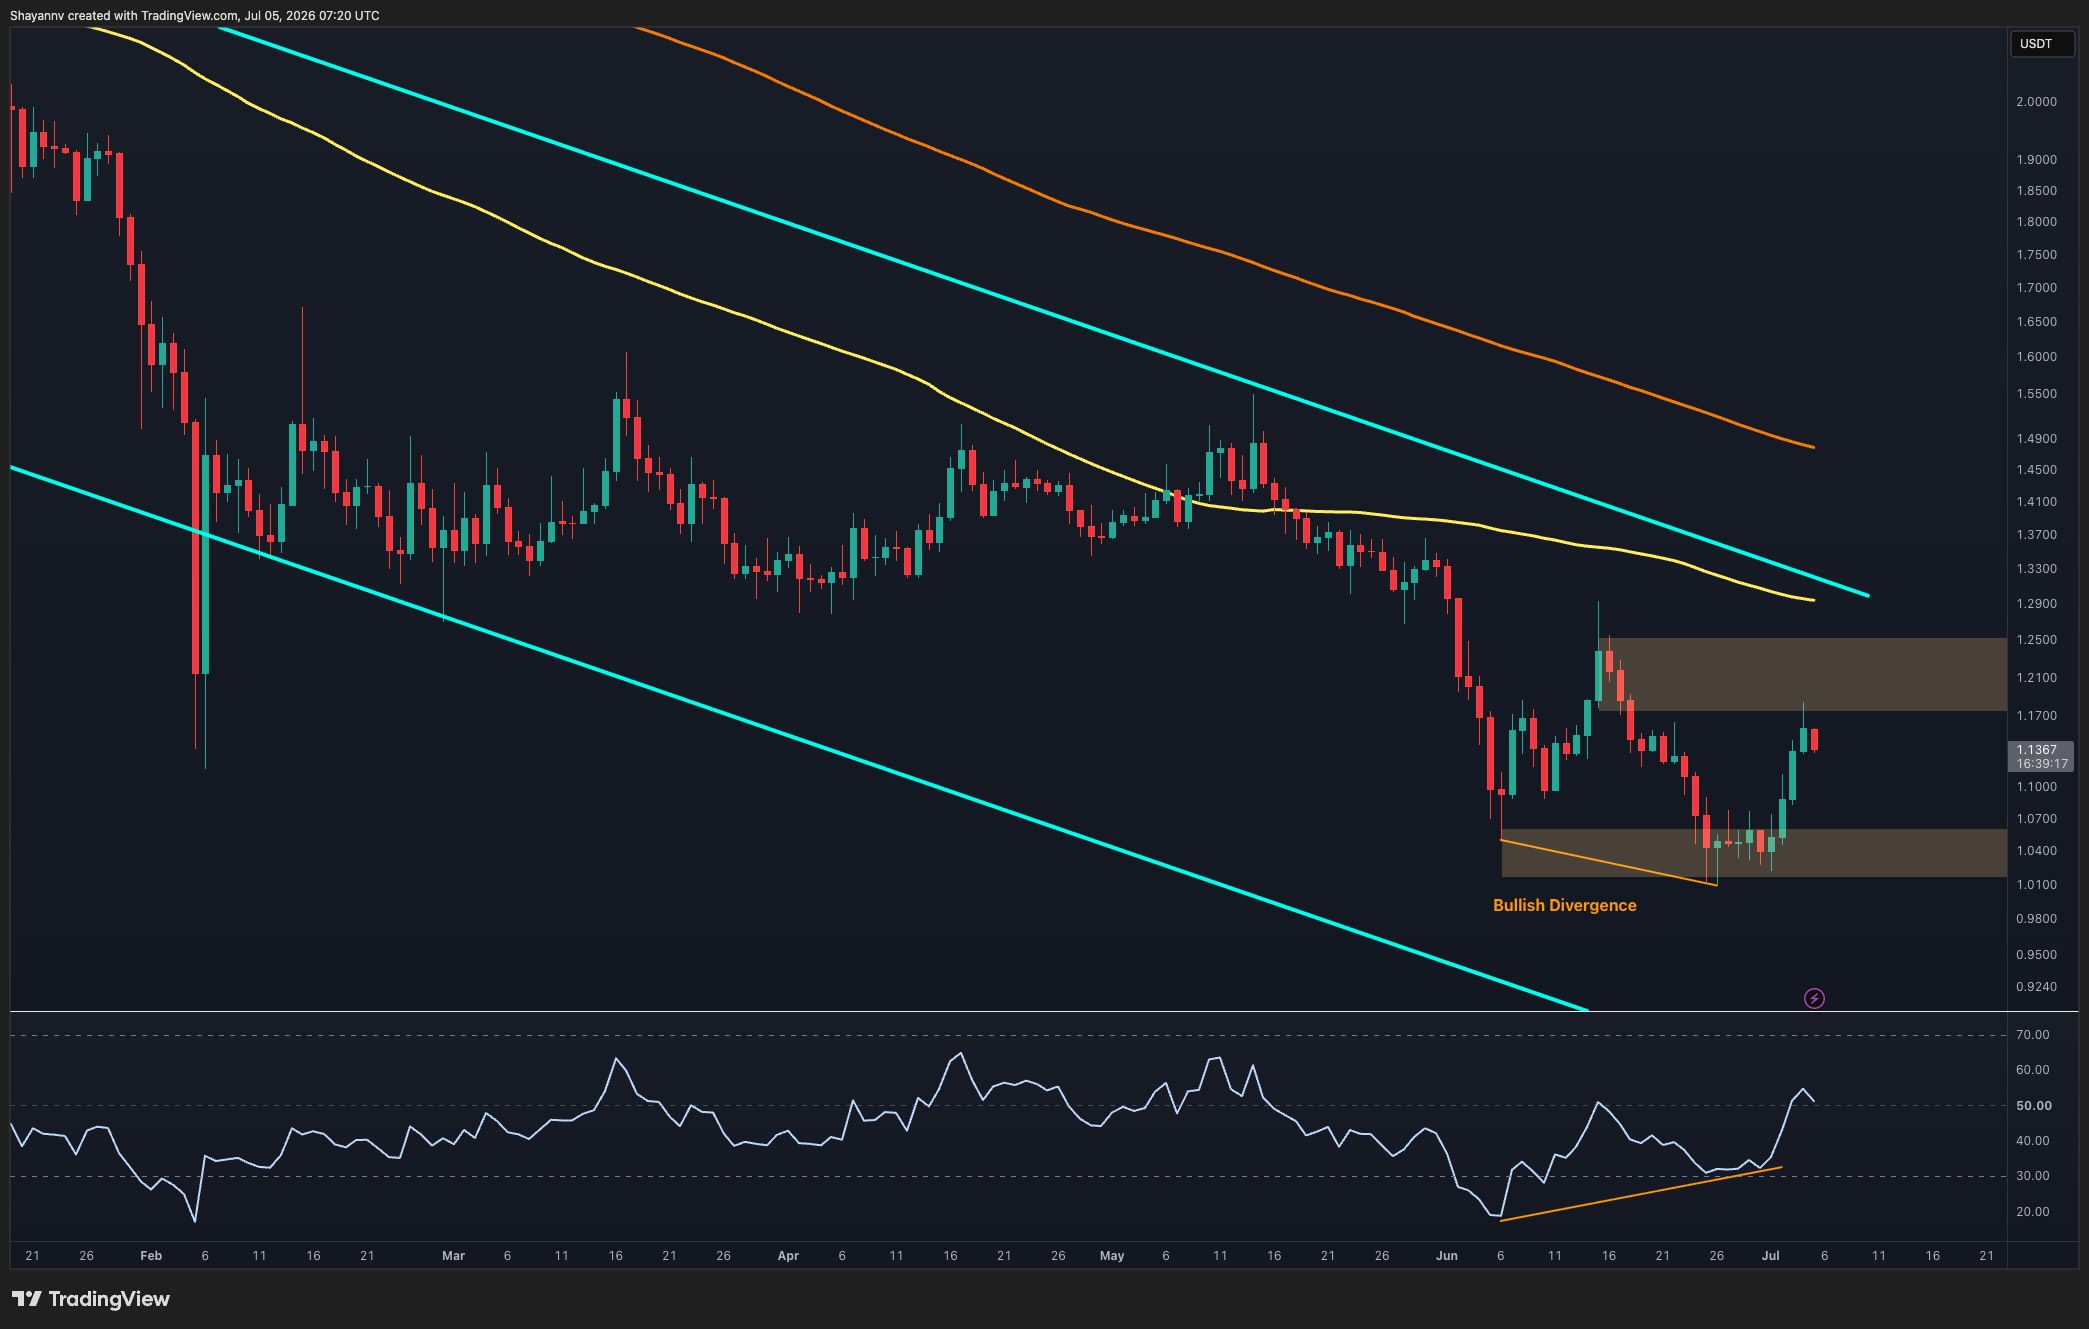
Ripple’s XRP has staged a significant recovery from recent lows, confirming a bullish divergence that emerged near a key support level. While the broader market structure remains in a corrective phase, the latest surge has propelled XRP back toward a critical technical inflection point that could dictate its next directional move.
Daily Chart Outlook
On the daily timeframe, XRP continues to trade within a long-term descending channel. It remains below major moving averages and the upper boundary of this channel. Despite this overarching bearish structure, recent price action has shown considerable improvement.
The bullish Relative Strength Index (RSI) divergence that formed around the $1.02-$1.05 support zone has played out as anticipated. During this period, XRP was making lower lows while momentum indicators were printing higher lows, signaling a waning selling pressure. Since then, XRP has experienced a sharp rebound, reclaiming the lower support region between $1.02 and $1.06.
This recovery has now brought the price to the first significant resistance zone, situated between $1.17 and $1.24. This area previously served as support before the recent breakdown and is now acting as a supply zone. The RSI has also moved back above the midline, indicating improving momentum and bolstering the case for a continued recovery attempt.
However, the broader trend remains bearish as long as XRP trades below the descending channel’s resistance and the overhead moving averages. A successful reclaim of the $1.17-$1.24 region would be the initial indication that the market is attempting to build a larger reversal structure.
Four-Hour Chart Insights
The 4-hour chart offers a clearer perspective on the recent breakout. XRP spent several days consolidating within the $1.02-$1.06 demand zone before buyers aggressively intervened, triggering a sharp rally toward the descending trendline resistance.
This move has already seen XRP reclaim its local support area and push directly into the trendline that has capped higher highs since mid-June. XRP is now testing this dynamic resistance as it approaches the lower boundary of the broader $1.21-$1.29 supply zone.
This presents a pivotal juncture. A confirmed breakout above the descending trendline would likely pave the way for a move into the upper resistance region, where sellers might attempt to reassert control. Such a breakout would also signify a short-term structural shift after weeks of lower highs and lower lows.
Conversely, a failure to break through the trendline could lead to a temporary pullback toward the recently reclaimed support zone. As long as XRP remains above the $1.02-$1.06 area, the current recovery structure is expected to hold.
For the moment, short-term momentum favors the bulls. However, the market is approaching a significant resistance cluster, and a decisive breakout will be necessary to confirm that this recovery is evolving into something more substantial than a mere relief rally.
Leave a Reply