XRP Faces Persistent Selling Pressure, Key Support Level Under Scrutiny
XRP is currently experiencing sustained downward pressure against both Tether (USDT) and Bitcoin (BTC). Despite intermittent attempts at recovery, sellers continue to dictate the prevailing trend. While the USDT chart indicates buyers are actively defending a crucial support zone, the XRP/BTC pair is trading near multi-month lows, underscoring XRP’s ongoing relative weakness compared to the market leader.
Technical Outlook for XRP/USDT
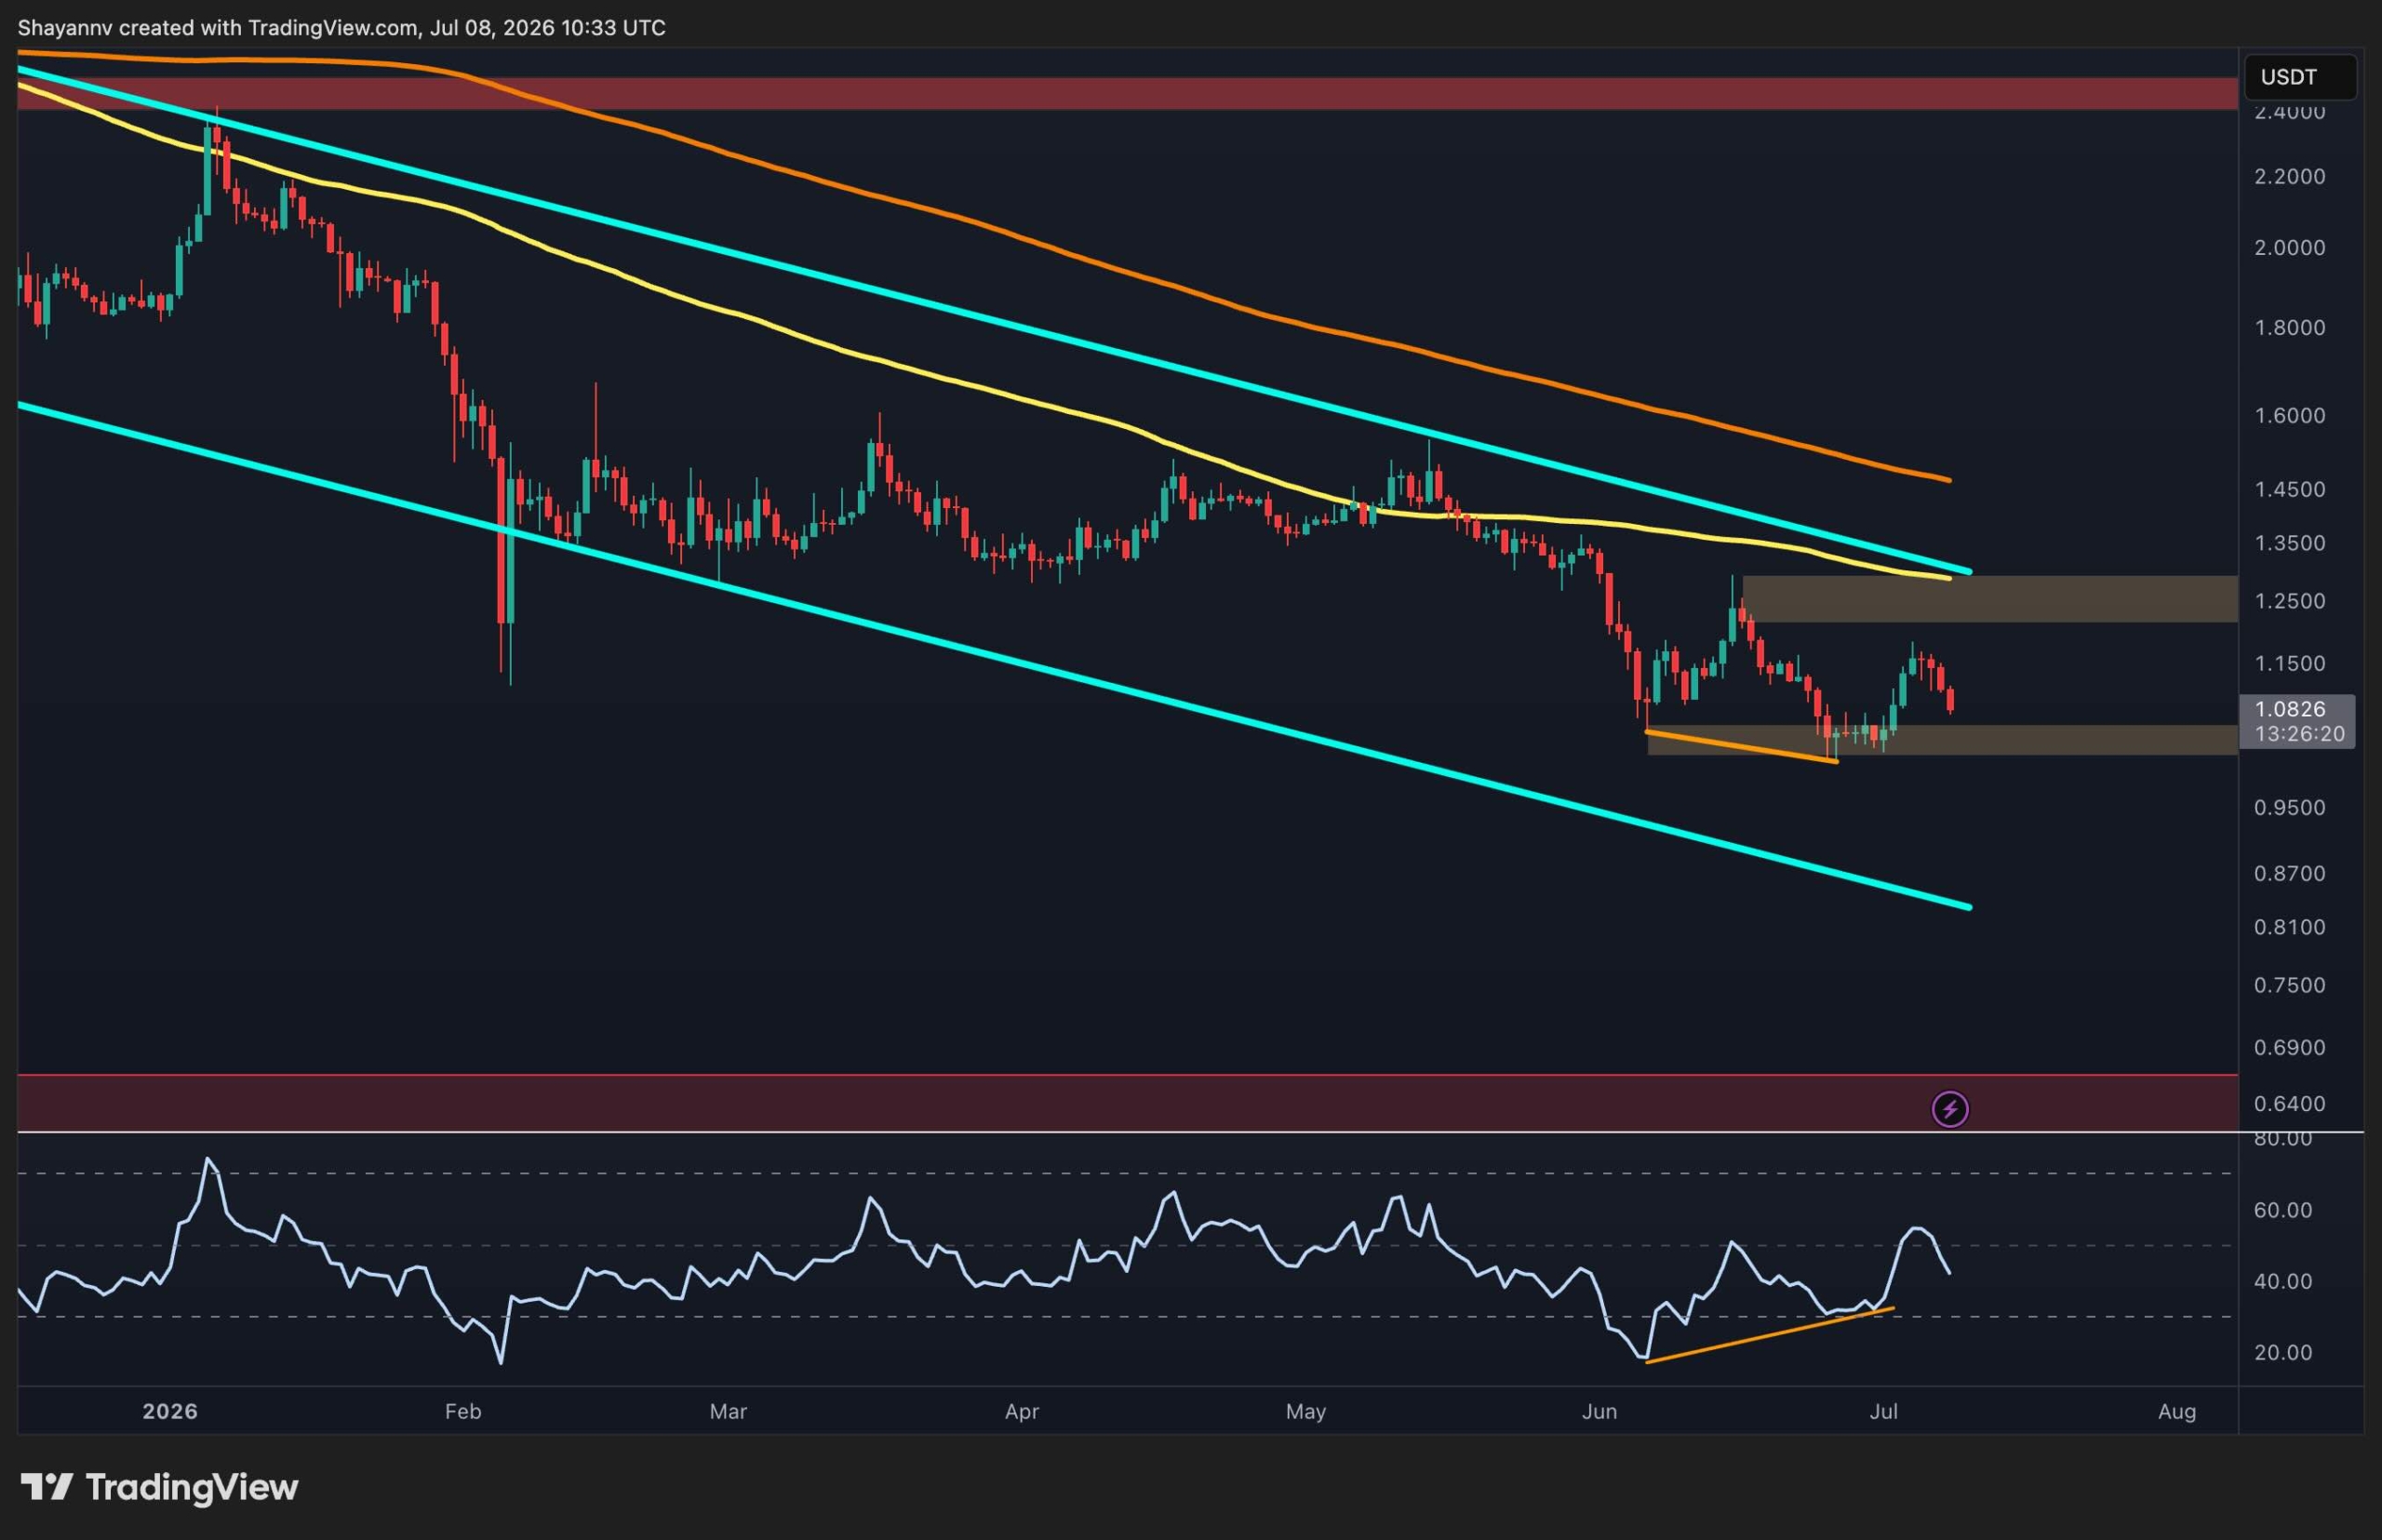
On the daily chart, XRP remains confined within a clearly defined descending channel, signaling a firmly bearish market structure. The cryptocurrency is trading below both its 100-day and 200-day moving averages, which are both trending downwards and acting as dynamic resistance points above $1.25. This technical alignment suggests that seller momentum is still dominant, and a significant trend reversal would be required to shift the balance.
Following the loss of the $1.25 level in early June, XRP found demand around the critical $1 mark. This region has repeatedly seen buyers step in to halt further declines and has now emerged as the most important support level to monitor. As long as this $1 support holds, the market may continue to establish a short-term base.
On the upside, the immediate significant resistance is located around $1.25. This area coincides with the descending 100-day moving average and the upper boundary of the channel, presenting a substantial obstacle for any sustained recovery. A successful breach above this level would then target the 200-day moving average near $1.45. Conversely, a failure to hold the $1 support could trigger another downward move, potentially testing the channel’s lower trendline around $0.80.
Meanwhile, the Relative Strength Index (RSI) has been printing higher lows, even as the price has made lower lows near $1. This developing bullish divergence suggests that bearish momentum may be waning, and buyers could initiate another recovery attempt if resistance levels begin to falter.
XRP/BTC Pair Shows Continued Weakness
Against Bitcoin, XRP’s technical picture remains weaker. The pair is trading below both major moving averages, which are continuing their downward trajectory and reinforcing the long-term bearish structure.
After several weeks of range-bound trading, XRP/BTC is once again testing key horizontal support at approximately 1,700 satoshis. This level has served as the floor for recent consolidation, and another breakdown attempt is currently underway. A confirmed daily close below 1,700 satoshis would likely invalidate the current trading range and increase the likelihood of a decline toward the next significant demand zone, situated between 1,450 and 1,500 satoshis.
To regain bullish momentum, buyers must first reclaim the 1,850 satoshis resistance area, which also aligns closely with the declining 100-day moving average. Until this resistance is overcome, rallies are likely to be viewed as corrective within the broader downtrend, potentially leading to further depreciation of XRP against Bitcoin.
Leave a Reply