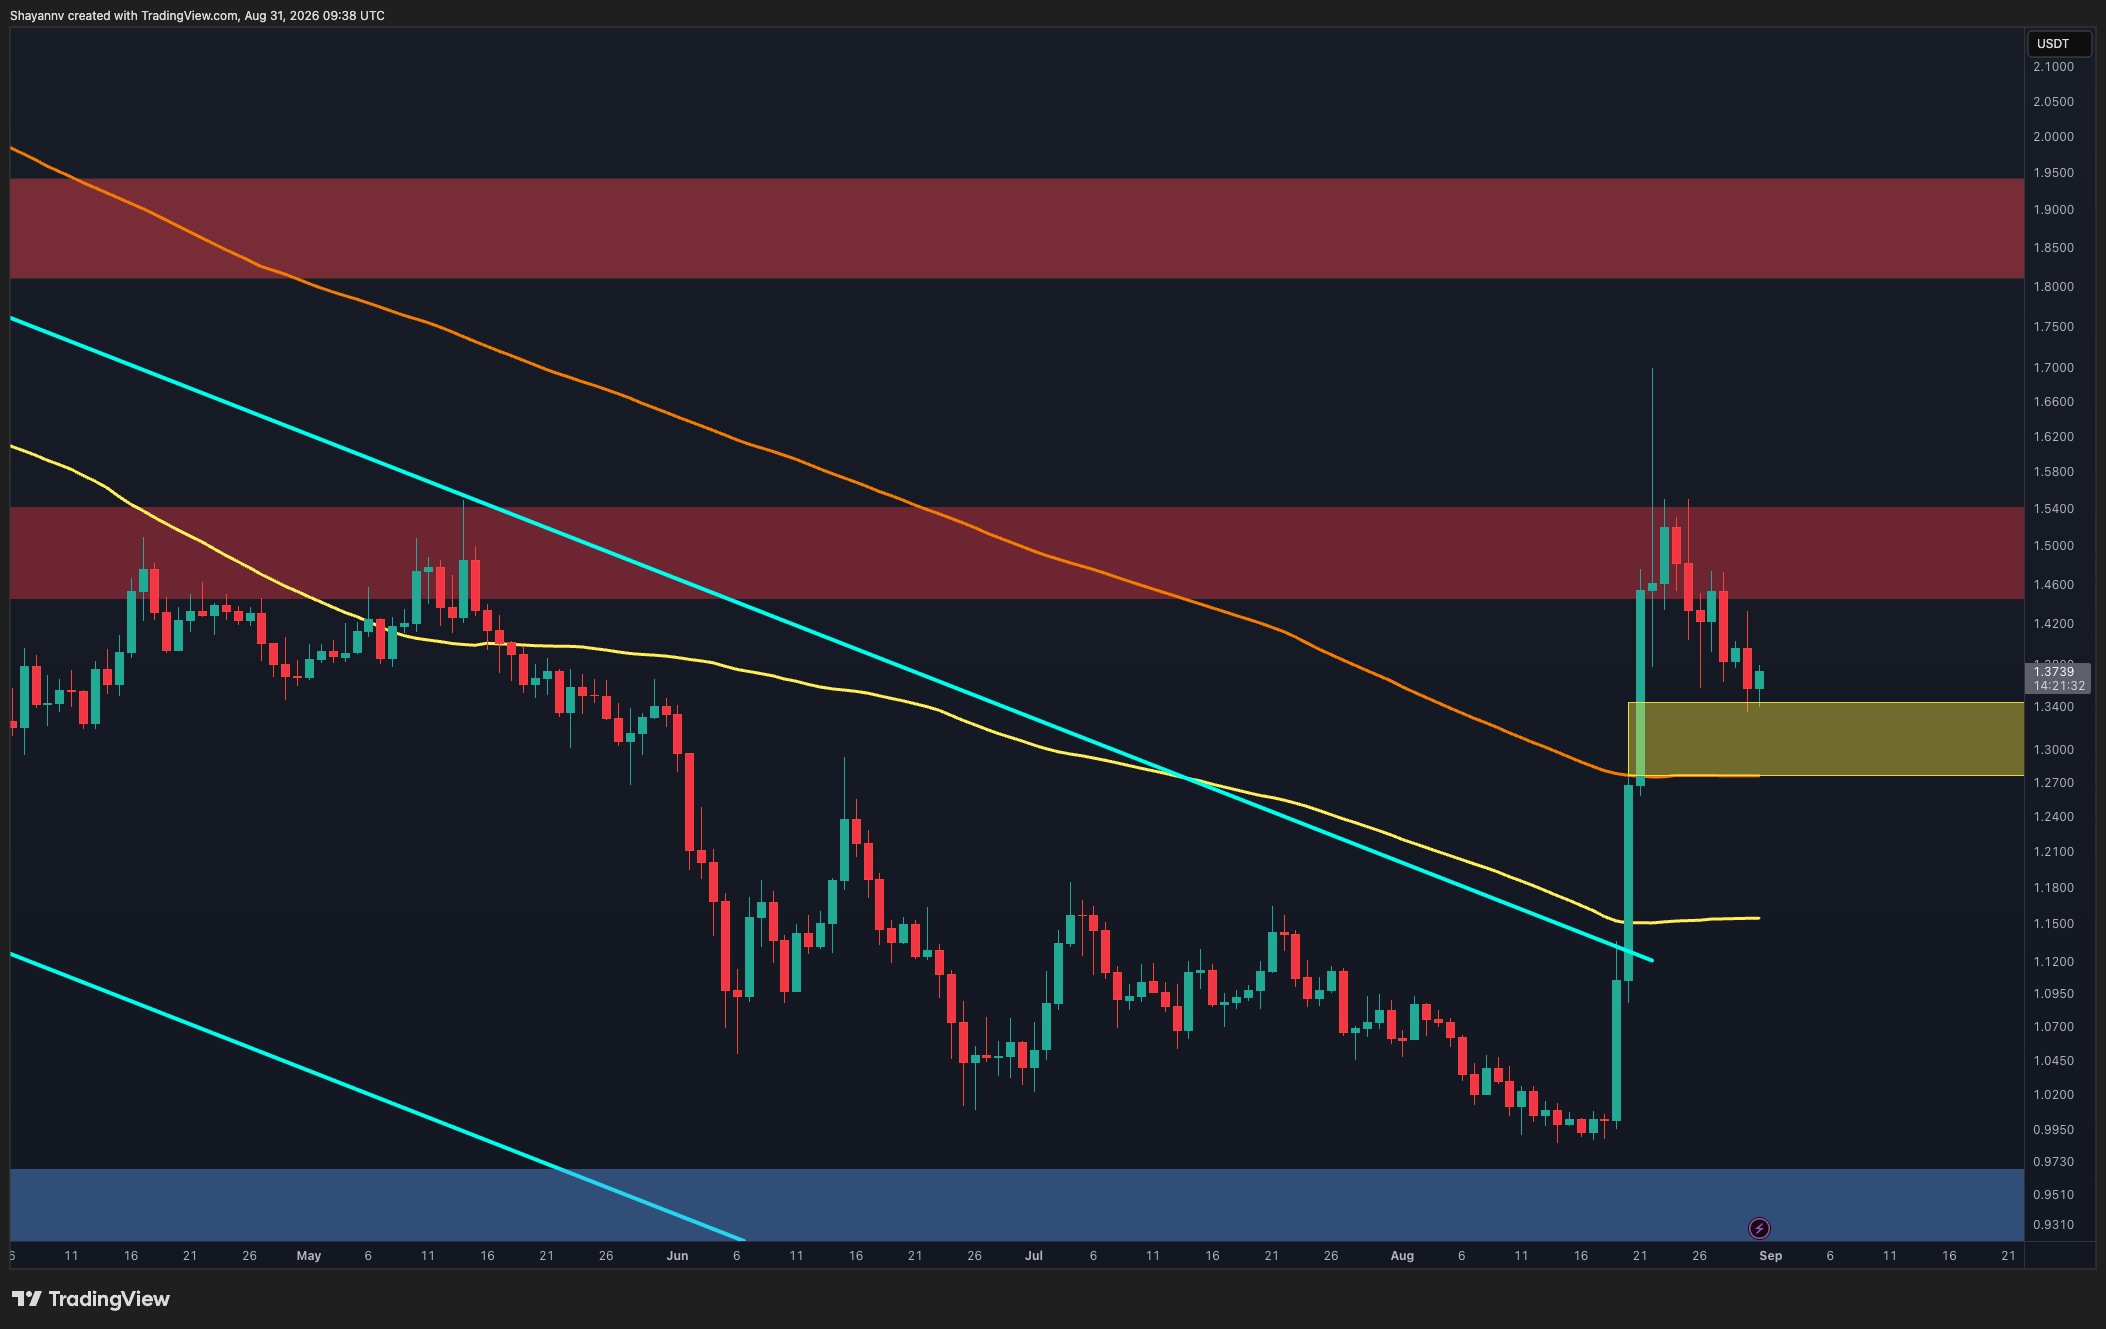
Ripple’s XRP is currently in a corrective phase following its significant surge past the $1 mark. While the cryptocurrency’s broader market structure has seen considerable improvement, a waning momentum below the $1.45-$1.55 resistance zone suggests that a deeper pullback or extended consolidation may be necessary before XRP can mount another sustained advance.
On the daily chart, XRP’s breakout signaled a substantial structural shift, as the price exited a prolonged descending channel and decisively moved above key moving averages. However, the rally encountered significant selling pressure within the $1.45-$1.55 resistance area. The long upper wick reaching towards $1.70 further underscores the rejection of higher price levels.
Since then, XRP has retreated to approximately $1.37. The subsequent pattern of lower highs and lower lows indicates that short-term momentum has turned corrective.
The initial significant support level is identified as the $1.27-$1.34 zone. This area also coincides with the higher moving average on the chart, enhancing its technical importance. A positive reaction from this region could enable XRP to stabilize before attempting to challenge the $1.45-$1.55 resistance zone once more.
Conversely, a daily close below $1.27 would undermine the post-breakout structure and increase the likelihood of a more pronounced correction. In such a scenario, the lower moving average, situated around $1.15, could become a relevant price point, preceding the broader demand zone between $0.93 and $0.97.
Technical Outlook on Shorter Timeframes
Examining the 4-hour chart reveals XRP consolidating after its initial ascent from around $0.99 to $1.70. The subsequent rejection from the $1.43-$1.55 supply zone has gradually pushed the price back towards the 0.5 Fibonacci retracement level, which sits at $1.34.
This positions the $1.33-$1.34 area as a critical near-term decision point. XRP has already tested this level, eliciting a modest response, but buyers have yet to engineer a convincing recovery. Maintaining a position above this level could lead to continued sideways trading and potentially another attempt at the $1.43-$1.55 resistance.
However, if the $1.34 level fails to hold, the correction could extend towards subsequent Fibonacci retracement levels. The 0.618 retracement at $1.26 falls within the first notable pullback zone, while the 0.702 level near $1.20 offers another support reference. A more substantial correction would bring the 0.786 retracement at $1.14 and the broader $1.09-$1.14 support zone into focus.
For the time being, the short-term structure remains corrective below the $1.43-$1.55 resistance. A sustained reclaim of this zone would be essential to decisively shift momentum back in favor of the bulls and re-open the possibility of challenging the $1.70 high.
Leave a Reply