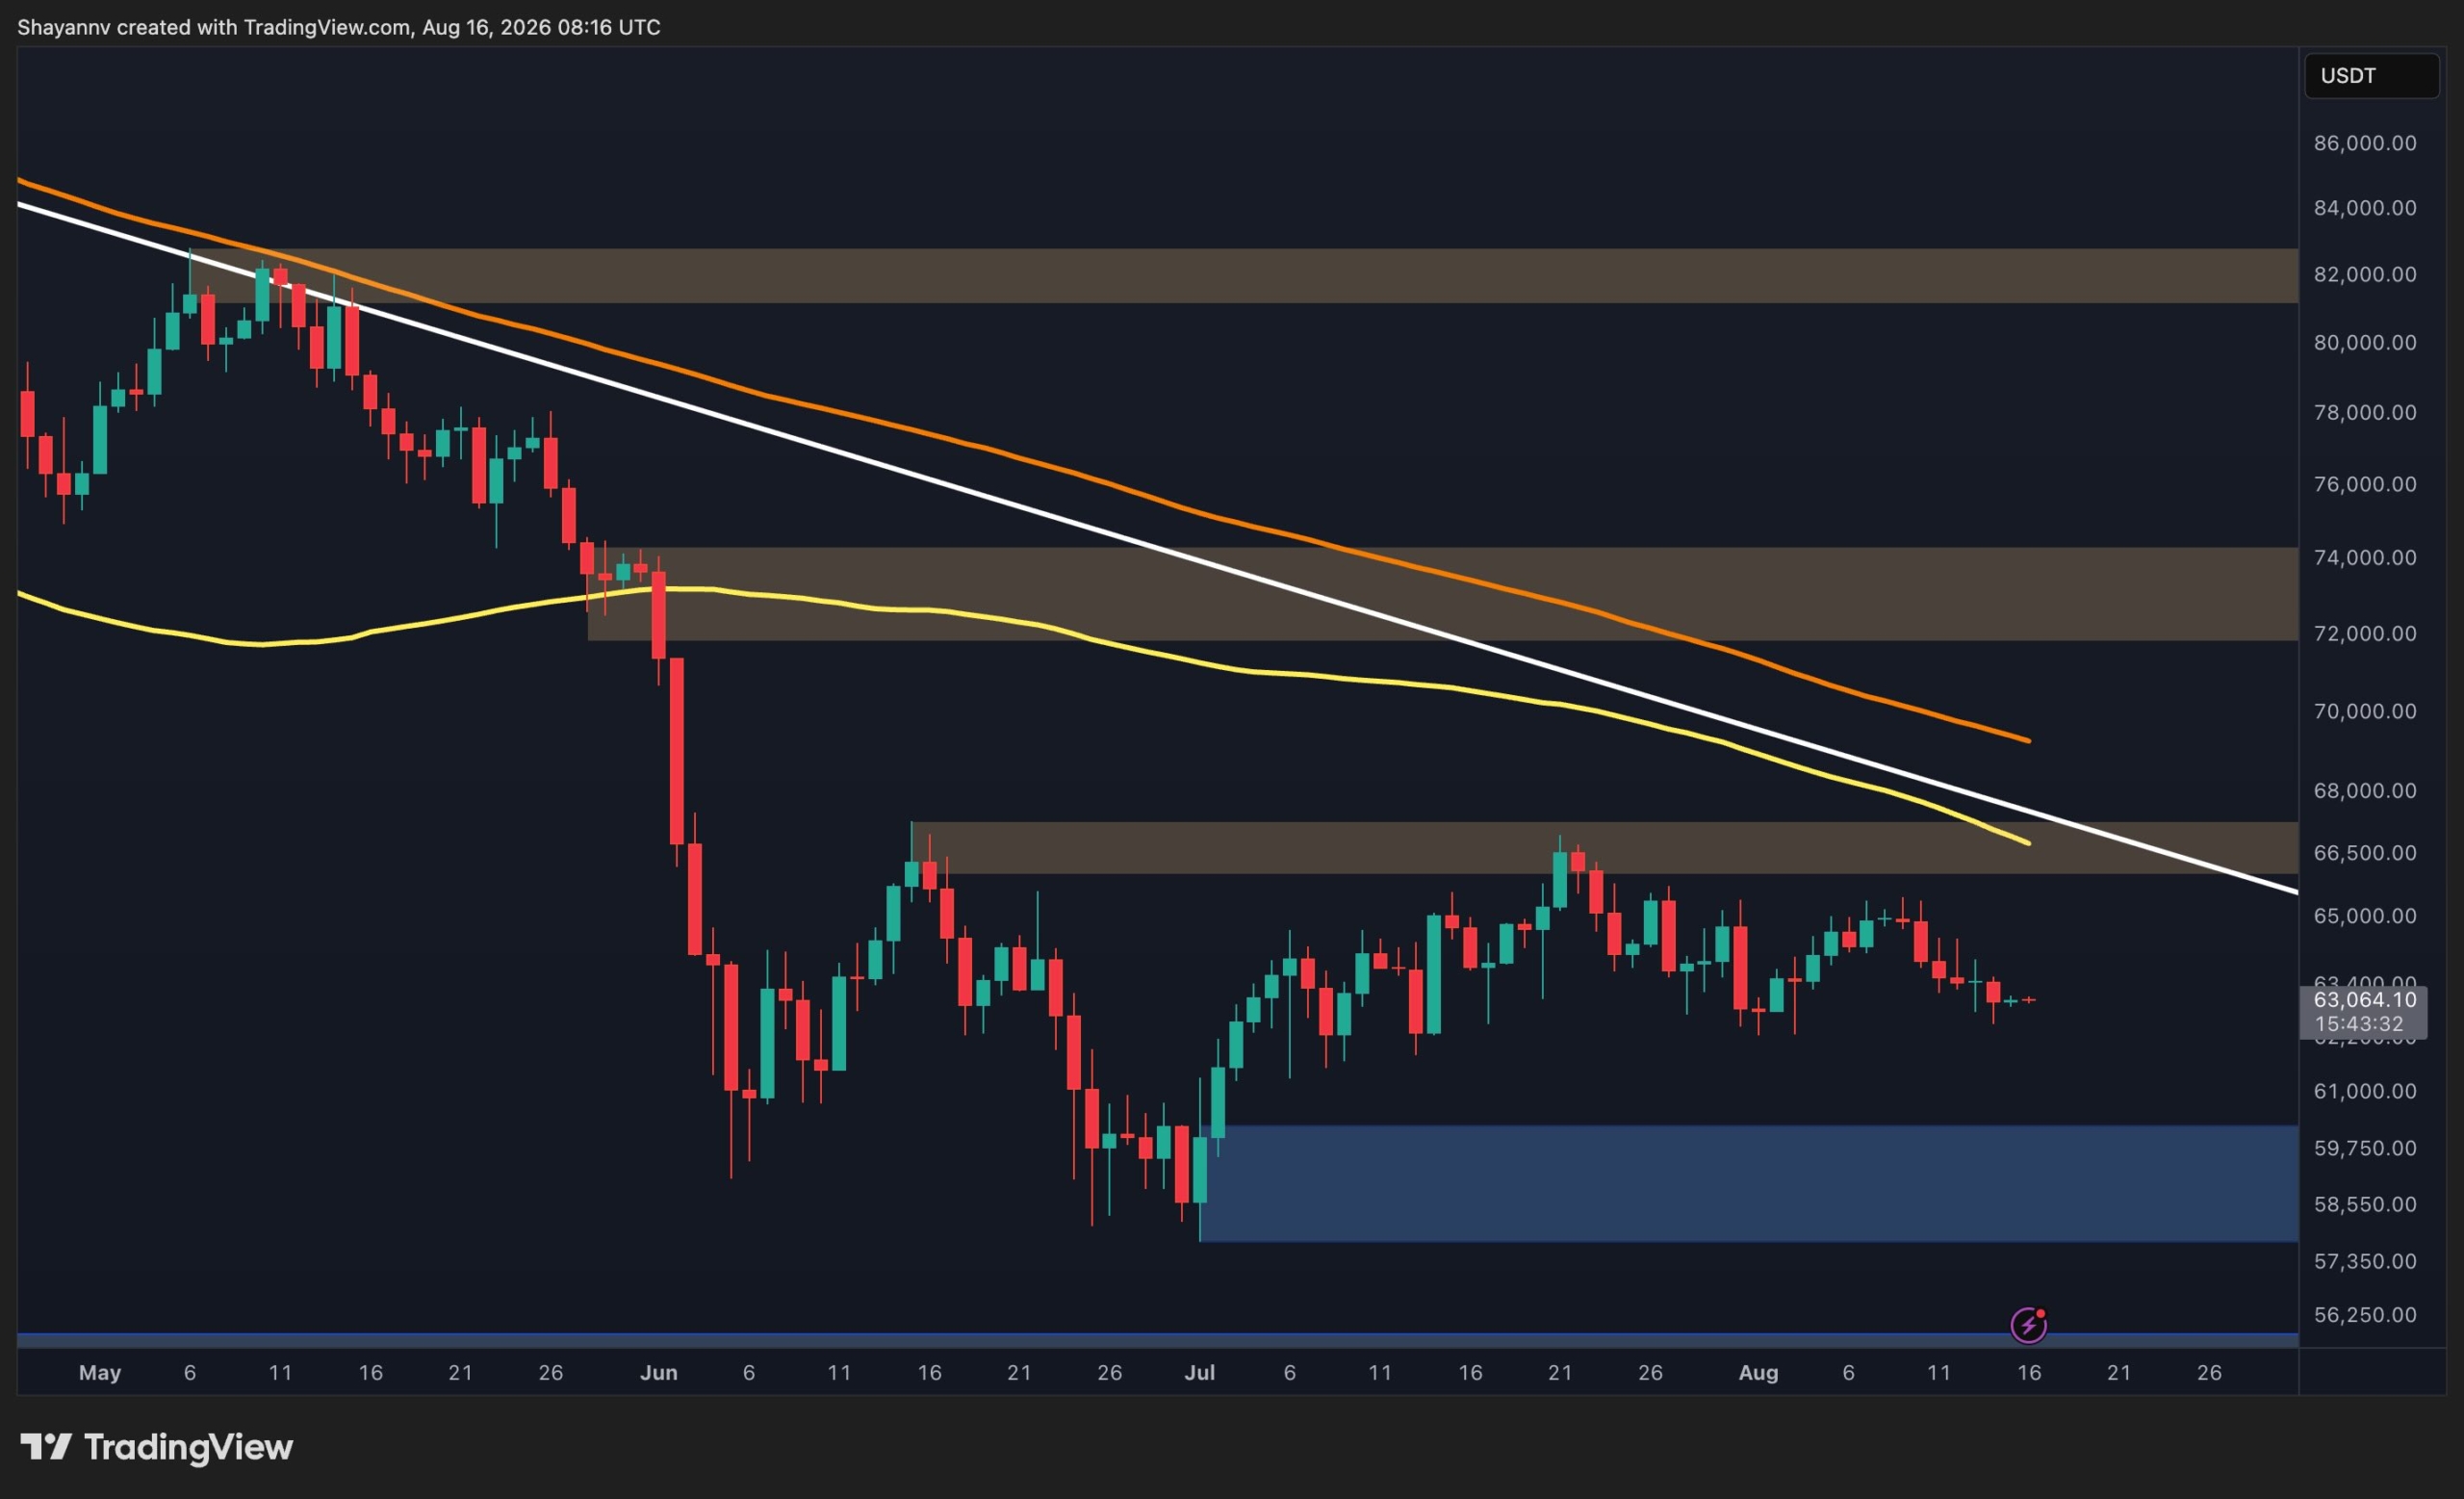
Bitcoin is currently navigating a period of choppy consolidation, trading around the $63,000 mark with notably low volume. This sideways price action, according to the analysis, suggests a market lacking a decisive directional impulse, making its next move difficult to ascertain.
Why This Matters
The current market analysis indicates that Bitcoin’s price action is characterized by sideways consolidation due to limited liquidity and volume, preventing a decisive directional move. It remains uncertain whether Bitcoin may break out of its consolidation phase next week.
Broader Context
Source materials place the market analysis in this context: Bitcoin remains trapped in a low-momentum environment, with price action increasingly characterized by choppy consolidation rather than a decisive directional move.
Key Technical Levels
Resistance is identified between $66,200 and $67,200, while a significant support area lies between $58,500 and $59,800. The broader market structure remains compressed, with Bitcoin trading below major descending moving averages, and the 100-day moving average acting as an overhead reference.
On the 4-hour timeframe, the price action is compressing between a descending upper trendline, around $64,500-$65,000, and an ascending lower trendline. This tightening range suggests that a break below the near-term support structure could lead to a revisit of lower price zones.
Potential Downside Scenarios
The article suggests that a notable move below the ascending lower trendline on the 4-hour chart could initiate a deeper correction. Such a move might first target the $60,300-$60,900 support zone, followed by the broader $58,100-$59,600 area. Significant liquidity concentrations exist around the current consolidation range, with notable clusters extending through the $53,000-$56,000 region. The heatmap indicates that a liquidity hunt below the $58,000 region remains a possibility if the current 4-hour support structure fails. This scenario, however, remains uncertain and requires confirmation.
Potential Upside and Limitations
Conversely, a notable move above the descending resistance trendline on the 4-hour chart could potentially invalidate the near-term bearish structure and improve the short-term outlook. However, the $66,200-$67,200 zone represents a more substantial resistance area that would need to be overcome for a material improvement in the short-term structure. Substantial liquidity also exists above the market around $66,000-$67,000 and at higher levels.
The analysis highlights that the absence of significant volume favors continued consolidation rather than an immediate notable move. A downside liquidity sweep, potentially extending below $58,000, could theoretically precede a stronger bullish cycle, but this remains a speculative scenario. According to the analysis, Bitcoin would first need to reclaim key resistance zones and demonstrate meaningful volume expansion to suggest such a transition.
Conclusion on Uncertainty
Ultimately, the current market conditions for Bitcoin remain uncertain. The lack of liquidity and volume continues to limit follow-through, and the structure leaves room for potential liquidity-driven moves before a stronger trend develops. A decisive notable move below the $58,500-$59,800 zone would significantly weaken the bullish case, while a break above the descending trendline would introduce a more positive scenario. However, the article emphasizes that predicting the direction or timing of any significant price movement is difficult given the current ambiguous signals. The next week may provide more clarity as the consolidation range potentially resolves.
Leave a Reply