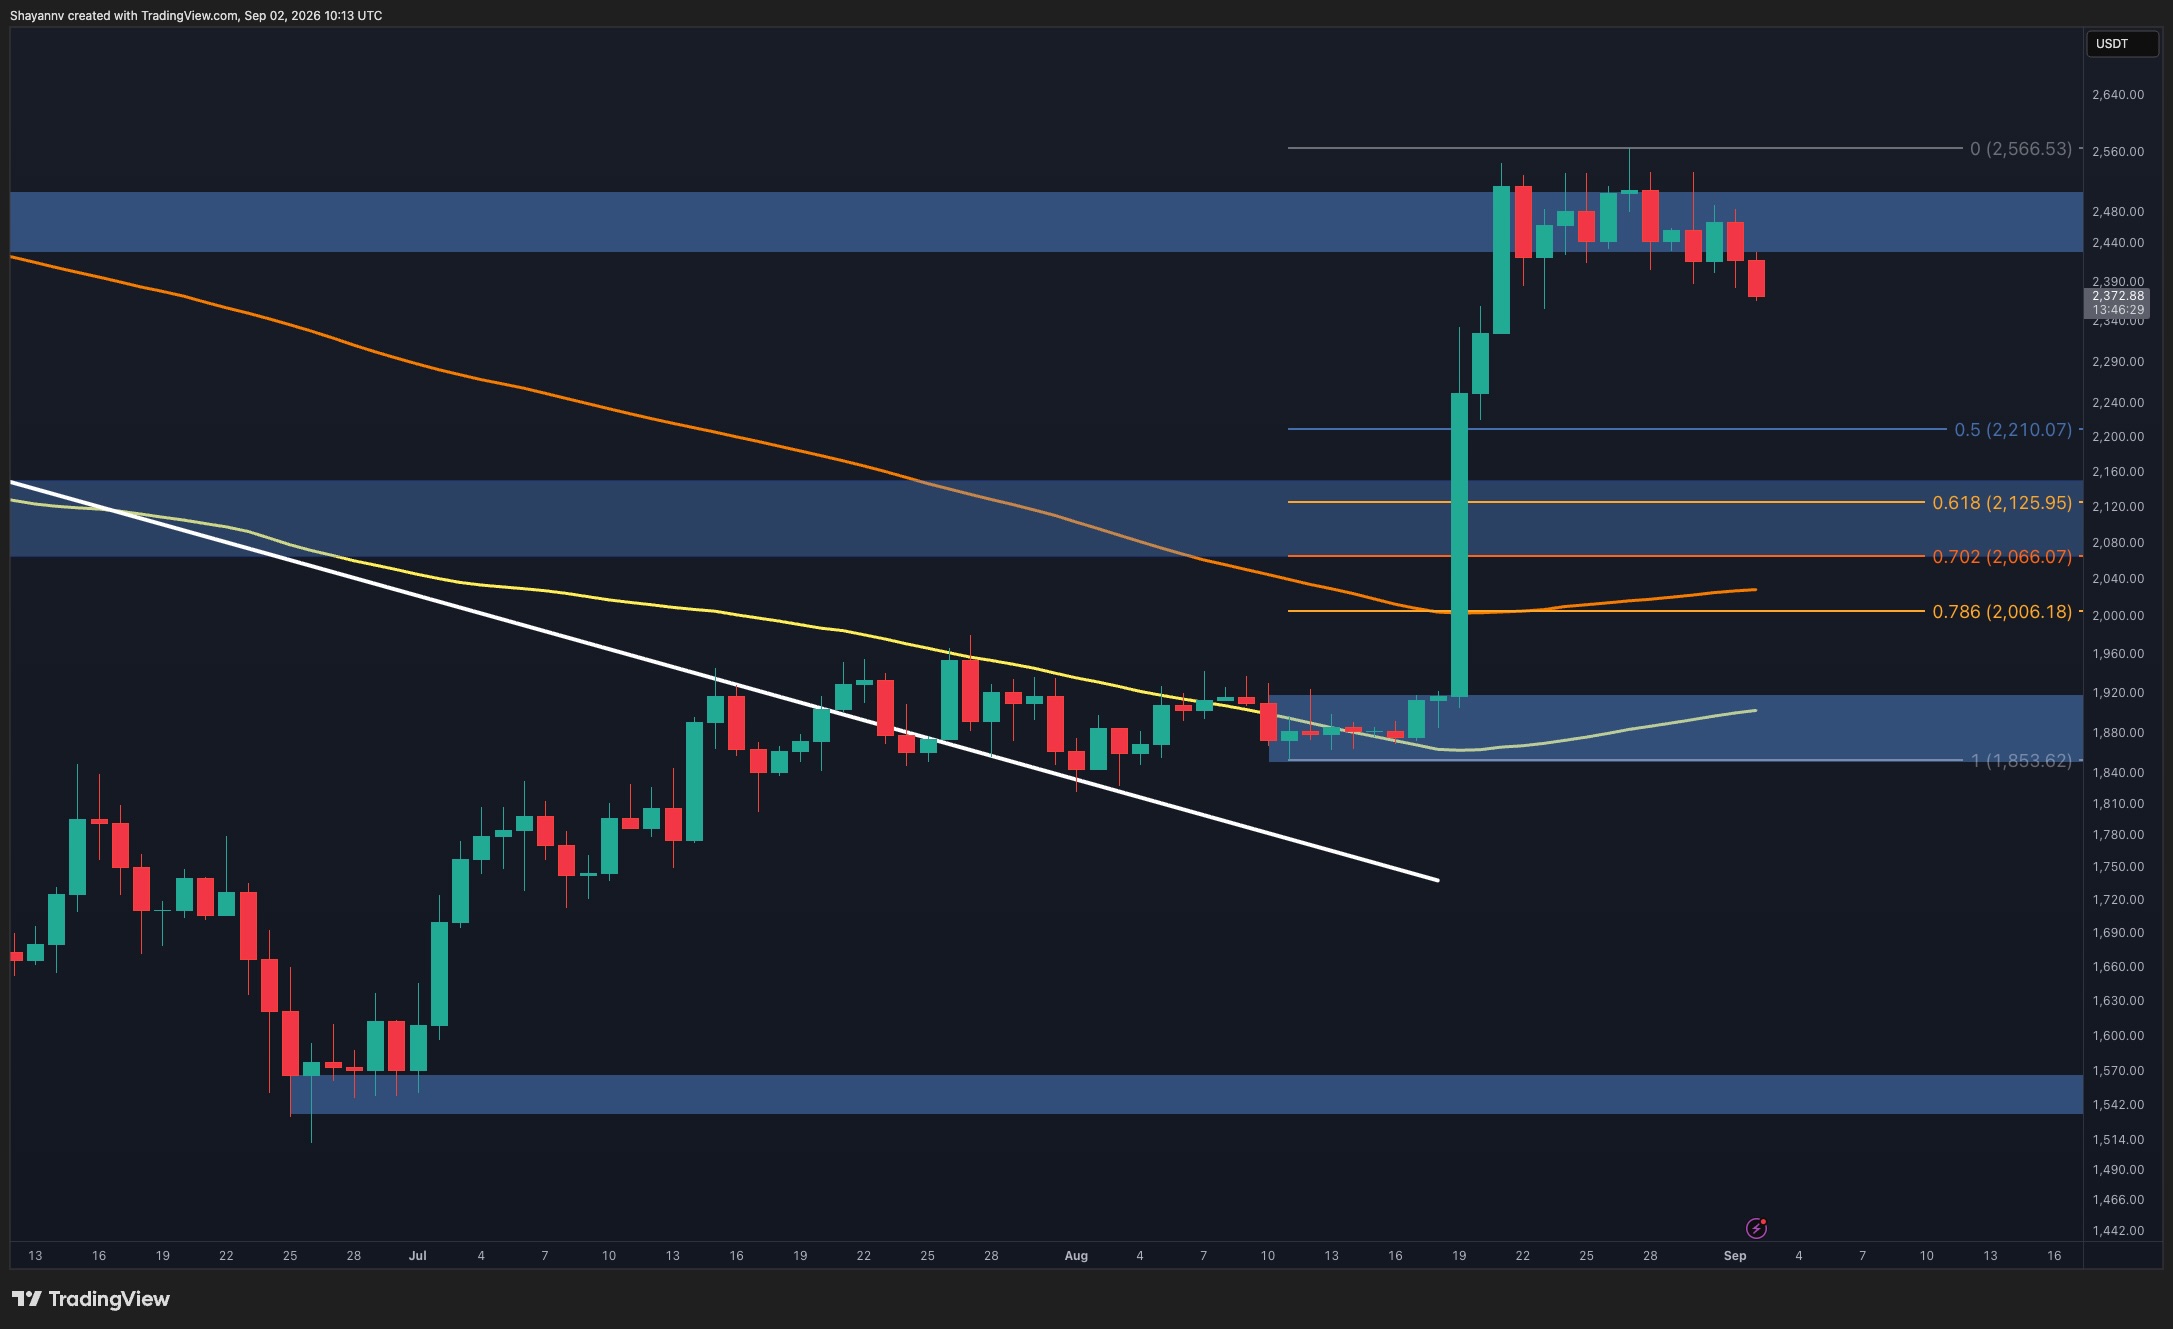
Ethereum’s price is exhibiting signs of a corrective phase after failing to breach the critical resistance zone between $2.44K and $2.51K. This failure has coincided with a decline below its recent consolidation range, with technical indicators and liquidity levels suggesting potential downside targets. However, the broader bullish structure may remain intact.
According to the analysis, Ethereum has fallen below the lower boundary of the $2.44K-$2.51K resistance zone and is currently trading near $2.37K. This follows multiple unsuccessful attempts by buyers to establish acceptance above this key area. The initial recent price movement, which propelled Ethereum from its $1.85K-$1.92K base, appears to have been exhausted in the short term, with recent price action indicating a gradual shift in favor of sellers.
Technical Indicators Signal Corrective Momentum
The data suggests that a weakening short-term structure could prompt Ethereum to seek liquidity at lower levels before buyers attempt another sustained advance. The market has cooled considerably following the recent rally, which carried ETH directly into the significant resistance zone. The latest rejection from the $2.48K-$2.50K area was followed by a sharp move lower, indicating that sellers are gaining control as the previous consolidation resolves to the downside.
Identifying Downside Targets
Technical pullback zones and support levels are being closely monitored. The first major technical pullback zone is identified around $2.21K-$2.31K. Given the vertical nature of the original rally, relatively little price structure was established between the current market and this area, making a deeper retracement toward it increasingly plausible if selling pressure continues. The next significant support is noted around the $2.07K-$2.12K region.
Fibonacci retracement levels offer a roadmap for a potential correction. The 0.5 level is situated around $2.21K, while the 0.618 retracement near $2.13K overlaps closely with the broader $2.07K-$2.16K support zone. This confluence makes the $2.07K-$2.21K region an important potential demand area during a deeper pullback.
Liquidity Levels Align with Technical Weakness
Liquidation data reinforces the possibility of a near-term move lower. With Ethereum trading around the upper-$2.3K region, a substantial concentration of liquidation liquidity is visible immediately beneath the market, roughly between $2.32K and $2.36K. This downside liquidity represents a relevant near-term target on the heatmap. If the current decline continues, the market could be drawn toward this cluster as leveraged positions are cleared and liquidity is collected. Therefore, the liquidation data aligns with the weakening technical structure.
Broader Context and Uncertainties
It is important to note that the broader bullish structure would not necessarily be invalidated by such a correction. A recovery back above the $2.44K-$2.51K resistance zone would reduce the immediate bearish pressure and could put the $2.57K local high back in focus. Conversely, a recovery above the $2.43K-$2.51K zone would weaken the corrective scenario and indicate that the latest notable move lacked sufficient follow-through.
Key uncertainties remain regarding whether buyers will regain control and the exact extent of any potential deeper pullback. The analysis suggests that a sweep of the liquidity below the current price could serve as the first objective of the developing pullback before the market determines whether a larger correction toward the major technical support zones is necessary.
Why This Matters
The materials describe a narrow update: Ethereum’s price has fallen below a recent consolidation range after failing to break through the $2. Whether buyers will regain control.
Leave a Reply