Category: Uncategorized

  • NEAR Protocol Surges 28% on Upgrades

    NEAR Protocol Surges 28% on Upgrades

    NEAR Protocol’s token surged 28% in the past 24 hours, leading gains among altcoins and extending its weekly rally to nearly 45%. The surge follows a series of announcements from the team regarding privacy, AI, and scalability between May 20 and May 22.

    The token’s increase surpasses gains from Worldcoin, which rose 12%, and Venice Token, which gained 8% over the same period, according to CoinGecko data. These gains occurred even as Bitcoin retreated from nearly $82,000 to $77,000 over the past week.

    Capital Rotation and AI Exposure

    The significant price movement is partially attributed to capital rotation after months of Bitcoin dominating available liquidity, according to Sammi Li, CEO of the crypto exchange Ju.com. NEAR has become “one of the more obvious beneficiaries” as funds move into large-cap altcoins, Li told Decrypt, adding that the project’s long-standing focus on AI makes it a natural choice for market exposure to AI-related projects.

    The rally reflects a concentrated product push across three areas: confidential on-chain treasuries, AI prompt privacy, and automatic network scaling. This positions NEAR as a potential settlement layer for AI agents and confidential finance.

    Recent Product Launches

    On Wednesday, Trez launched Confidential Treasuries, a product offering private on-chain multisig, payroll, balance management, and cross-chain payments across more than 35 chains. The product utilizes NEAR’s private sharding and Intents infrastructure. NEAR’s official account noted that $68 million moved confidentially out of near.com over the past month.

    Separately, NEAR AI rolled out automatic PII anonymization for prompts sent to closed models, including Claude, ChatGPT, and Gemini. The new system ensures sensitive data remains on the user’s machine, addressing enterprise concerns about AI inference costs and data leakage.

    Future Developments

    NEAR Co-founder Illia Polosukhin has been actively promoting the upgrades on social media, linking the developments directly to what he calls the coming “agentic market” where specialized AI agents compete on outcomes via intents.

    “Dynamic resharding is coming soon to NEAR Protocol – unlocking a new level of scalability to power the growth of NEAR Intents and agentic commerce,” Polosukhin tweeted Thursday. “As more AI agents transact onchain, we’ll need more scalable infrastructure. This upgrade allows NEAR to scale to 70+ shards, which would have a higher throughput than Visa.”

    The dynamic resharding upgrade, scheduled for June 2026 as part of network upgrade 2.13, will allow shards to split automatically when a shard reaches a certain state size.

    Market Sentiment and Outlook

    Li cautioned that price movements can outpace fundamentals once momentum builds, describing the rally as partly narrative-driven and partly due to traders chasing strength. However, she views the persistent caution as constructive, noting that cautious sentiment persists even as the market improves, which she said is “usually not a bad sign.”

    On prediction market Myriad, owned by Decrypt’s parent company Dastan, user confidence in a broader altseason has not shifted despite recent uptrends in standalone altcoins like HYPE, Ondo, or Zcash. Users assign only a 12% chance to an altseason starting by July. This number has remained unchanged in May, underscoring the “fearful” reading on the Fear & Greed Index.

    Looking ahead, Li does not expect all altcoins to perform equally. Capital will likely remain concentrated in projects with strong narratives and real ecosystems, she said, noting the market is “much more selective than previous cycles.” If Bitcoin remains stable, she sees room for quality altcoins to outperform over the next few months—a move that “often starts when people are still skeptical.”

  • XRP Price Climbs Despite Crypto Market Downturn

    XRP Price Climbs Despite Crypto Market Downturn

    XRP Holds Steady Amid Market Downturn

    XRP’s price has shown resilience while the broader cryptocurrency market experiences a downturn, supported by positive data from its exchange-traded funds (ETFs). XRP ETFs saw inflows of $8.88 million in the latest session, building on a trend that included $18.52 million on May 14 and $10.87 million on May 15, resulting in a total of $42 million in net inflows over the past week.

    In contrast, Bitcoin ETFs faced outflows of $100.9 million during the same period, following a series of significant redemptions totaling $648.6 million, $331.1 million, and $290.4 million on consecutive days. Ethereum also experienced a loss of $32.6 million in the most recent session.

    Network Growth and Price Action

    Beyond ETF flows, XRP also recorded its fourth-largest daily increase in wallet creation for 2025, with 4,300 new addresses added within 24 hours.

    The contrast between XRP’s inflows and the outflows from Bitcoin and Ethereum suggests a selective rotation of capital, as Bitcoin and Ethereum contend with key support levels.

    XRP’s price is currently holding in a range between $1.36 and $1.38. While the current stabilization is encouraging, the seven-day performance shows a 7% decline over the past week, indicating a recovery from a previous downturn rather than a continuation of an upward trend.

    Analysts identify the $1.20–$1.25 range as a critical support level, with resistance observed between $1.50 and $1.60, a level XRP has yet to convincingly surpass.

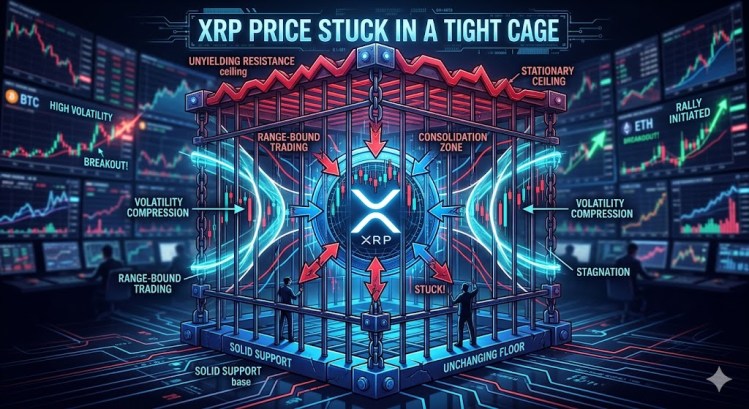
    Options positioning around the $1.40 level suggests market makers may be keeping the price within a tight range as the June expiry approaches. Although ETF inflow data is positive, spot volume has been moderate, which tempers the strength of the current price movement.

    The data indicates that XRP is in a critical phase, without yet confirming a definitive reversal. The $1.40 level is one to watch closely.

    Alternative Investment Opportunities

    While XRP’s performance is noteworthy, even a successful breakout to $1.60 from $1.37 would only represent a 17% increase. For traders seeking exposure to the Bitcoin ecosystem’s expansion, institutional capital flows, and infrastructure developments without the limitations of large-cap assets, early-stage presales offer an alternative risk/reward profile.

    Bitcoin Hyper ($HYPER) is currently in presale at $0.0136, having raised $32 million to date. The project is positioning itself as the first Bitcoin Layer 2 with Solana Virtual Machine (SVM) integration, aiming for sub-second finality and smart contract capabilities on top of Bitcoin’s security layer, with performance exceeding Solana.

    A Decentralized Canonical Bridge facilitates BTC transfers, and staking is live with a high 36% APY for early participants.

    This infrastructure-focused approach aligns with the capital rotation dynamic currently influencing XRP’s performance. Investors are not exiting the crypto market but are instead seeking assets with structural upside that the larger cryptocurrencies may no longer provide at scale.

  • Polymarket Appoints Jupiter Executive to Head Japan Expansion

    Polymarket Appoints Jupiter Executive to Head Japan Expansion

    Polymarket Appoints Japan Representative, Eyes Regulatory Approval by 2030

    Polymarket has appointed a representative in Japan as it prepares to seek government approval to operate prediction markets in the country, according to Bloomberg. Sources familiar with the matter told the outlet that the company aims to secure regulatory authorization by 2030.

    Expansion Lead

    Mike Eidlin, who is listed as the head of Japan at the crypto firm Jupiter on his LinkedIn profile, has been appointed to lead Polymarket’s expansion in the country, Bloomberg reported.

    Current Restrictions

    Japan is currently on Polymarket’s list of restricted jurisdictions, where users are blocked from accessing the platform due to “regulatory requirements and compliance with international sanctions.”

    Legal Landscape

    The legal environment is strict. Japan’s Penal Code stipulates that habitual gamblers could face up to three years in prison, while operating a gambling business is punishable by between three months and five years of imprisonment.

    Company Statement

    A Polymarket spokesperson told Bloomberg that the firm has seen “meaningful organic interest from users” in Japan and Asia, adding that it is “always evaluating opportunities to expand access globally in compliant and locally appropriate ways.”

    Existing Presence

    The platform’s Japanese X account has already attracted more than 53,000 followers, and approximately 169 active Polymarket contracts are tied to Japanese events, including Bank of Japan rate decisions and political outcomes.

    Global Context

    Polymarket’s push into Japan comes amid a mixed global picture, as it competes with rival prediction market platform Kalshi. Polymarket posted notional volumes of $9.967 billion in April, down from $11.275 billion in March, according to DeFiLlama, while Kalshi saw volumes rise from $13.211 billion in March to $14.647 billion in April. Kalshi’s valuation reached $22 billion after a $1 billion raise in March, while Polymarket’s valuation is at $9 billion following a $2 billion investment from Intercontinental Exchange in October 2025.

    Regulatory Scrutiny

    Regulators in several jurisdictions are scrutinizing the prediction market sector. South Korea’s Korea Communications Standards Commission is examining whether Polymarket hosts illegal gambling content, according to local media outlets, while Indian authorities have blocked access to Polymarket and are in the process of blocking Kalshi, according to local reports citing an official at the Ministry of Electronics and Information Technology.

    U.S. Market

    Polymarket secured approval from the CFTC to re-enter the U.S. market last year, after being pushed offshore for operating a futures contract platform without a license. The prediction market platform has faced pushback from U.S. state gaming regulators, sparking a legal dispute between states and the CFTC and Department of Justice—with the federal agencies this week suing Minnesota over a newly signed bill that bans prediction markets in the state.

    Japanese Regulatory Changes

    Japan’s cabinet last month approved a bill that would reclassify cryptocurrencies as financial products under the Financial Instruments and Exchange Act, prohibiting insider trading and requiring annual disclosures from issuers.

  • XRP Wallet Growth Experiences Significant Surge, According to Santiment.

    XRP Wallet Growth Experiences Significant Surge, According to Santiment.

    XRP Sees Strongest Network Growth of the Year, According to Santiment

    XRP experienced one of its most significant network growth spurts of the year, with analytics firm Santiment reporting the creation of 4,300 new wallets within a 24-hour period. This marks the fourth-largest spike of 2024. Santiment highlighted the importance of this development, stating that “network growth is among the top leading signals to identify reversals,” positioning the wallet surge alongside on-chain metrics that suggest XRP is trading in a lower-risk zone.

    Undervalued Setup for XRP

    This data point was also discussed by Santiment’s Brian Quinlivan during a recent livestream. The XRP segment stood out due to a combination of new wallet creation, depressed profitability metrics, and relatively subdued crowd sentiment. Quinlivan noted that XRP’s MVRV setup resembled that of Ethereum, but with a more pronounced long-term drawdown among active holders.

    According to Santiment data cited during the livestream, XRP’s 365-day MVRV was approximately negative 35.12%, while its 30-day MVRV had fallen back into negative territory at roughly negative 3%.

    Quinlivan argued that this combination places XRP in a statistically less overheated position compared to periods when recent and longer-term holders hold substantial unrealized gains. “Again, that golden rule, they’re both below zero, meaning you’d be buying whether you’re doing short or long-term trading at a less risky point than the average moment in XRP’s 11, 12 year history now,” he said.

    He further emphasized the significance of the long-term figure, noting that readings below negative 30% often indicate a point where the average active holder has already absorbed significant losses. “Anything below 30, no matter what asset you’re looking at, that’s something that should provide confidence in your investment because you have something that quantifies how much blood in the streets there is,” he stated. “You can buy knowing that your fellow peers that you’re trading against, you’re not on the same team just because they’re investing in the same asset. You’re buying when those fellow peers have already experienced immense losses that you haven’t because you’d be opening a fresh new entry into XRP.”

    Sentiment Analysis

    Sentiment data further supported this assessment. Quinlivan noted that XRP’s social tone had been “pretty up and down lately,” but was leaning more negative than usual, which Santiment typically views as constructive from a contrarian perspective. The asset was showing about 1.7 bullish comments for every bearish comment, a level that, while seemingly elevated, is below XRP’s typical social baseline, which tends to be closer to a 2-to-1 bullish ratio.

    He added that, excluding an outlier around May 14, XRP sentiment had remained below its typical average for approximately the preceding 10 days. This is significant because, according to Santiment’s framework, excessive bullishness often appears near local tops, while apathy or frustration can emerge near more attractive entry points.

    The livestream also contextualized XRP within a broader altcoin environment. Quinlivan observed that many assets have faced negative sentiment due to their failure to follow Bitcoin into a more convincing rally. He cited the rapid fading of market attention around specific integrations or partnerships if price doesn’t respond, using the XRP-related hype surrounding a Rakuten partnership approximately a month prior as an example of how narratives can lose traction without market confirmation.

    At the time of this report, XRP was trading at $1.36.

  • Ripple Sees Surge in XRP Wallets

    Ripple Sees Surge in XRP Wallets

    XRP Sees Surge in New Wallet Creations, Signaling Potential Market Shift

    XRP experienced a significant increase in new wallet creations, with 4,300 wallets added in the past 24 hours, according to data released by Santiment on May 22. This marks the fourth-largest spike in network growth this year.

    Market Activity and Derivatives

    The surge in wallet creation coincided with XRP trading near $1.37. Simultaneously, derivatives activity on platforms like Binance and CME increased, despite the token’s recent underperformance. This spike in new wallets is noteworthy because network growth often precedes significant price movements, indicating shifts in trader interest.

    Santiment highlighted that the recent wave of wallet creations was one of the largest for XRP in 2026, noting that network growth is a strong indicator of potential market reversals. This data also emerged during a period of heightened activity in the token’s derivatives markets. Open interest (OI) for XRP futures on Binance reached $488 million this month, according to Arab Chain.

    This OI figure is among the highest since March, following a steady increase throughout May. Analysts often interpret rising OI as a sign of traders adding leveraged positions, although it doesn’t necessarily predict market direction.

    Exchange Flows and Price Performance

    Additionally, exchange-flow data from analyst Amr Taha revealed that Binance XRP withdrawals accounted for 53% of transaction share, compared to 47% for deposits. The last time withdrawals reached a similar level was April 10, when XRP was trading around $1.34.

    A higher withdrawal share can suggest that traders are moving tokens off exchanges, potentially to hold them. However, this activity doesn’t automatically signal an upcoming rally; it could simply indicate reduced selling pressure in the short term.

    Despite the increased trading activity, XRP’s price has remained relatively stable. At the time of writing, CoinGecko data showed the asset down 0.3% in the past 24 hours, trading between $1.35 and $1.38. The token is also down 8% over the past week and nearly 5% for the month. Year-to-date losses exceed 43%, leaving the Ripple token more than 62% below its July 2025 all-time high of $3.65.

    Institutional Engagement

    Institutional engagement remains strong. As previously reported by CryptoPotato, CME’s XRP futures products processed approximately $63 billion in notional trading volume during their first year.

    CME launched the contracts in May 2025, offering standard and micro-sized futures tied to the XRP-Dollar Reference Rate. Since then, traders have exchanged roughly 1.32 million contracts, equivalent to 28.6 billion XRP.

  • XRP Dips 8% as Whales Buy 71 Million Tokens

    XRP Dips 8% as Whales Buy 71 Million Tokens

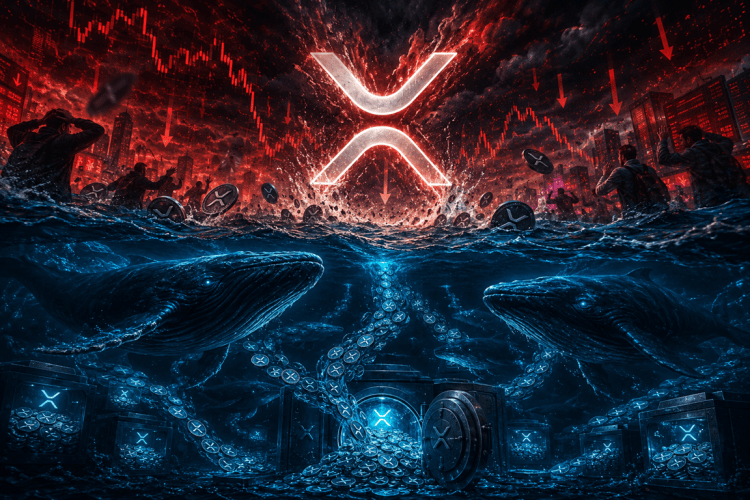
    On-chain data indicates that XRP whales have significantly increased their holdings over the past week, accumulating 71 million coins even as the asset’s price declined.

    Whale Activity and Market Sentiment

    Analyst Ali Martinez recently highlighted this trend in a post on X, focusing on the supply held by large XRP holders, often referred to as “whales.” These entities, possessing substantial XRP holdings, can exert considerable influence on the market. Their actions, while not always directly impacting the asset’s price, often reflect the prevailing sentiment among these major investors.

    The behavior of these whales is tracked through various metrics, including their holdings. A chart shared by Martinez illustrates the recent expansion of XRP whale holdings. Over the past week, these large investors have added over 71 million XRP tokens, currently valued at approximately $97.8 million, to their portfolios. This accumulation occurred while the asset’s price decreased by over 8% during the same period. This timing suggests that these major players may view the price dip as a buying opportunity. Whether this strategy will prove successful remains to be seen.

    Potential for Price Volatility

    In a separate X post, Martinez suggested that XRP may be poised for a volatile move. He pointed to the Bollinger Bands indicator, a tool used to gauge an asset’s volatility. The indicator comprises a 20-day moving average (MA) central line and two bands representing standard deviations above and below it.

    The chart shows that the Bollinger Bands have recently tightened around the 3-day XRP price, indicating a period of stagnant price action. Martinez noted that the current squeeze is the tightest in over a year. He stated, “When volatility compresses this tightly, it’s a signal that a violent price expansion is approaching.”

    XRP Price Overview

    XRP briefly surpassed the $0.54 mark a week ago, but the price has since retreated, currently trading around $1.37.

  • XRP Price Faces Mounting Breakout Pressure

    XRP Price Faces Mounting Breakout Pressure

    XRP Price Consolidates, Eyes Further Gains

    XRP’s price has begun a recovery, trading above $1.3620 and $1.3650. The cryptocurrency is currently consolidating and could attempt another upward move if it surpasses $1.3840.

    Technical Analysis

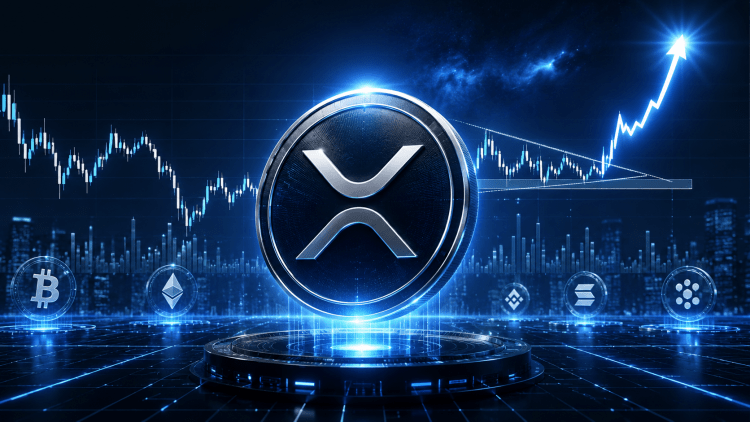
    XRP has initiated a recovery wave, trading above the $1.3640 zone. The price is currently below $1.3820 and the 100-hourly Simple Moving Average. A contracting triangle is forming, with resistance at $1.380 on the hourly chart for the XRP/USD pair, according to data from Kraken. The pair could continue its upward trajectory if it settles above $1.3840.

    Potential Gains

    Supported above $1.350, XRP has initiated a recovery wave, mirroring trends seen in Bitcoin and Ethereum. The price has climbed above $1.3580 and $1.3620, entering a short-term positive zone. However, it remains below $1.3850 and the 23.6% Fibonacci retracement level of the downward movement from the $1.5495 swing high to the $1.3465 swing low.

    A contracting triangle is also forming, with resistance at $1.380 on the hourly chart of the XRP/USD pair. The price is currently trading below $1.3750 and the 100-hourly Simple Moving Average.

    If the price moves upward, it may encounter resistance near $1.3780. The primary resistance level is near $1.380. A close above $1.380 could push the price to $1.3840, with the next hurdle at $1.3940. A clear break above the $1.3940 resistance could send the price towards the $1.420 resistance. Further gains could see the price targeting the $1.4480 resistance or the 50% Fibonacci retracement level of the downward move from the $1.5495 swing high to the $1.3465 swing low.

    Potential Decline

    If XRP fails to break above the $1.3840 resistance zone, a fresh decline could ensue. Initial support on the downside is near the $1.360 level. The next major support is near $1.3580. A break below $1.3580 could lead to a further decline towards $1.340. The subsequent major support is near the $1.3380 zone, below which the price could continue to fall towards $1.3250.

    Technical Indicators

    • Hourly MACD: The MACD for XRP/USD is losing momentum in the bullish zone.
    • Hourly RSI: The RSI for XRP/USD is above the 50 level.

    Key Levels

    • Major Support Levels: $1.3600 and $1.3580.
    • Major Resistance Levels: $1.3840 and $1.3940.
  • Zcash Surges to Six-Month High, Eyes $700 Mark

    Zcash Surges to Six-Month High, Eyes $700 Mark

    Zcash (ZEC) has reached its highest level since 2025, but the recent surge is now approaching a significant technical hurdle. While some analysts are observing the first “constructive signs” in months, others are cautioning about potential signs of market exhaustion.

    ZEC Rally Faces Key Barrier

    Zcash has been a leader in the cryptocurrency market amidst recent volatility, gaining over 21% in the past week and 110% over the last 30 days. Throughout May, the cryptocurrency has risen from the $350 level to reclaim the $670 area, reaching a six-month high of $690 on Wednesday.

    Market analyst Ali Martinez highlighted a multi-month horizontal channel that has been forming since October between the $192 and $698 levels. After retesting the channel’s bottom in March, ZEC has jumped approximately 250% towards the upper zone of the channel, nearing a retest of the macro resistance. Martinez stated that the next step “is seeing whether buyers step in hard enough to force a breakout” from the crucial resistance zone.

    However, he noted that Zcash may be showing signs of exhaustion as it approaches the “same resistance zone that triggered a major rejection back in November,” between $700 and $730. According to the analysis, ZEC’s TD Sequential indicator is currently flashing a sell signal on the weekly chart, while momentum indicators “are starting to look stretched again,” making it an important setup to watch.

    Martinez noted that the 250% move from the bottom to the top of the channel was anticipated by a TD Sequential buy signal on the weekly chart, asserting that the correction could be more significant since the sell signal has appeared in the weekly timeframe. He suggested that Zcash could see a 25% correction towards the $500 area as the initial target, adding that a 45% drop towards the $380 support may follow if a deeper retracement occurs. “So, while both HYPE and Zcash remain in strong uptrends, they are also entering zones where risk increases significantly,” he warned.

    Zcash Shows ‘Constructive Signs’

    While the price holds the December highs as support in the weekly timeframe, analyst Rekt Capital pointed out that Zcash is “showing initial Bull Flag tendencies similar to what developed a few weeks prior, with positive pressure building at $528.951.” The market observer affirmed that the recent performance is “the first opportunity to see whether ZEC can hold these levels in a durable way,” adding that “so far the early signs are constructive.”

    Continuing to hold this area would contradict the prior failed retest and suggest a real shift in market dynamics, with buyers willing to accumulate here. He explained that if Zcash continues to retest the $698 resistance and produces shallower rejections, it would signal that the $700 psychological barrier is weakening, which could, over time, open the path for price discovery.

    Nonetheless, he noted that price stability at current levels is crucial, and continued weekly closes above the $530 area would confirm the shift in market dynamics from last year’s attempt. On the monthly timeframe, Rekt Capital affirmed that a close above $514 is also critical, as it marks the three-month resistance zone that capped its breakout attempts between late 2025 and early 2026. “A Monthly Close above it, followed by a successful retest as new support, would be a compelling setup,” he concluded.

  • Nexpace Launches NXPC Buyback to Boost MapleStory Ecosystem

    Nexpace Launches NXPC Buyback to Boost MapleStory Ecosystem

    Nexpace Launches $10 Million NXPC Buyback Program

    Abu Dhabi, UAE – May 22nd, 2026 – Nexpace, the Abu Dhabi-based blockchain company behind MapleStory Universe (MSU), today announced a buyback program for its native token, NXPC, valued at up to $10 million. The initiative aims to strengthen the token’s circulation structure and support the long-term sustainability of the MSU ecosystem.

    NXPC is the utility token within MSU, the blockchain-integrated expansion of Nexon’s popular MapleStory intellectual property. It facilitates user engagement through rewards and item unlocks.

    Program Details

    Nexpace will purchase up to $10 million worth of NXPC on global digital asset exchanges through open market operations. To mitigate potential market impact, the purchases will be executed in multiple tranches over a three-month period and managed by an external execution partner.

    Rationale and Performance

    The buyback program is informed by insights gathered during MSU’s first year of operation. Over the past year, more than 850,000 wallets have engaged with the platform, with approximately two-thirds utilizing NXPC monthly. This activity has generated 49.1 million NXPC in ecosystem revenue, equivalent to $31 million. By the first quarter of 2026, player spending surpassed distributed rewards, indicating robust organic engagement within the ecosystem.

    Combined with the 8.32 million NXPC already burned, the buyback program is designed to support healthy token circulation as MSU evolves into a broader IP-driven ecosystem. It also reinforces the long-term alignment of NXPC for active participants and contributors.

    Executive Commentary

    Sun Young Hwang, Chief Executive Officer at Nexpace, stated, “As MapleStory Universe continues to evolve, our focus remains on building an ecosystem where participation and utility remain closely connected. This program reflects our ongoing commitment to supporting healthier long-term ecosystem dynamics as engagement continues to grow. Year one gave us confidence that we are on the right path, and we want to ensure long-term users, builders, and contributors are meaningfully rewarded for what they help build.”

    NXPC acquired through the program will be retained within the treasury to support the long-term sustainability of the ecosystem.

    About Nexpace

    Nexpace is a blockchain company based in Abu Dhabi that is pioneering an IP-expansion initiative powered by blockchain technology and NFTs to build a community-driven ecosystem. Nexpace aims to redefine interactive entertainment by creating a space for exploring, sharing, and engaging with diverse content and gameplay crafted by community members. The company emphasizes transparency, security, and trust to empower builders and provide immersive experiences for users.

    Disclaimer

    This press release contains forward-looking statements regarding MapleStory Universe, MSU 2.0, and related plans. It does not constitute an offer, solicitation, or recommendation to buy or sell NXPC or any digital asset; availability may be restricted in certain jurisdictions. All metrics are based on internal data or third-party sources as indicated and measured under the definitions and periods specified.

  • Analyst Predicts XRP to Capture 31% of Crypto Market.

    Analyst Predicts XRP to Capture 31% of Crypto Market.

    XRP’s Market Dominance Shows Bullish Structure, Analyst Says

    Crypto analyst Will Taylor, known as Cryptoinsightuk on X, believes XRP’s market capitalization dominance still indicates a bullish structure, despite its recent pullback from a key range high. His latest chart of XRP.D suggests a potential long-term move toward 31.26% dominance, significantly above the current level near 3.315%.

    Taylor’s analysis focuses on market structure rather than short-term sentiment. The chart shows XRP dominance holding above a major horizontal level around 3.315% after breaking out from a multi-year range and failing to fully clear the 6.127% area. The weekly setup then compresses into a descending wedge, with Taylor suggesting the retracement has not invalidated the broader breakout.

    “As I look at $XRP.D, I still struggle to feel bearish here,” Taylor wrote. “What I think we’re seeing is: a completed Wyckoff accumulation, a breakout above the major 3.315% resistance, a failed attempt to fully break through the 6.127% range high, then a pullback into a compressed descending wedge.”

    The Path to 31% Market Dominance for XRP

    The chart identifies 6.127% as the next major range high, while 31.26% is marked as a possible upside objective. This implies a significant expansion in XRP’s share of the total crypto market if the analyst’s continuation thesis plays out. This doesn’t necessarily require XRP to rise in isolation; dominance can also increase if XRP outperforms other major crypto assets during a broader rotation.

    Taylor’s analysis centers on the behavior after the failed push through 6.127%. Rather than viewing the rejection as evidence of distribution, he describes the current structure as compression. He believes a decisive bearish breakdown would likely exhibit stronger downside momentum and heavier sell pressure.

    “To me, that matters,” he said. “Because descending wedges are often reversal / continuation structures, especially when they’re paired with diminishing volume. If sellers were truly in control, I’d expect to see expanding downside volatility and aggressive sell volume, not compression.”

    The chart also includes the Relative Strength Index (RSI), which has been trending lower alongside price compression. Taylor argues this does not represent a full structural breakdown. Instead, the indicator appears to be compressing in its own downtrend while XRP dominance holds above the breakout zone. This distinction is central to his thesis. A market that breaks out, rejects at a higher resistance, then consolidates above former resistance can still be considered constructive, provided the former breakout level is defended. In this case, the 3.315% zone is the key reference point. A sustained loss of that area would weaken the continuation argument, while a breakout from the wedge could bring the 6.127% range high back into focus.

    The Wyckoff Thesis

    The Wyckoff labels on Taylor’s chart are central to the bullish reading. The structure marks a long accumulation sequence beginning with preliminary support, or PS, followed by a selling climax and secondary test around the 2020–2021 lows. The subsequent automatic rally, secondary test, and “spring” are presented as the base-building phase before XRP dominance reclaimed higher ground.

    From there, the chart identifies a move over the “creek,” a Wyckoff term often used to describe the transition out of an accumulation range, followed by a sign of strength near the 6.127% range high. The latest pullback is labeled as an LPS, or last point of support, which in Wyckoff analysis is typically watched as a potential higher-low area before continuation. That makes the 31.26% marker more than a loose upside arrow in Taylor’s framing. The chart is effectively arguing that XRP dominance has moved from accumulation into markup, with the current descending wedge serving as a possible consolidation above the breakout zone rather than evidence of failed demand. The bullish case depends on that LPS interpretation holding; if the structure breaks back below the reclaimed 3.315% level, the Wyckoff continuation thesis would become harder to defend.

    Taylor also framed the setup as one that may need a catalyst. “It honestly feels like XRP dominance is waiting for a catalyst before attempting another move higher,” he wrote. “I know this goes against a lot of current sentiment and market interpretation, but I’d genuinely love to hear the bearish argument from here structurally, because right now I still see more signs pointing toward bullish continuation than full distribution.”

    The 31.26% marker gives the chart its most striking implication, but the nearer technical question is whether XRP dominance can continue to hold the reclaimed 3.315% level and resolve the wedge to the upside. For now, Taylor’s read is clear: the structure has pulled back, but in his view, it has not yet broken.