Blog

  • Lisk (LSK) Surges 325% Daily Amidst Bitcoin’s Range-Bound Trading Near $77,000

    Lisk (LSK) Surges 325% Daily Amidst Bitcoin’s Range-Bound Trading Near $77,000

    The cryptocurrency market is currently characterized by a significant divergence in performance, with Lisk (LSK) experiencing a notable 325% surge in a single day, while Bitcoin (BTC) has maintained a consolidated trading range between $77,000 and $77,400 over the weekend. This contrast underscores shifting investor focus and evolving market dynamics, particularly in the wake of recent macroeconomic data releases.

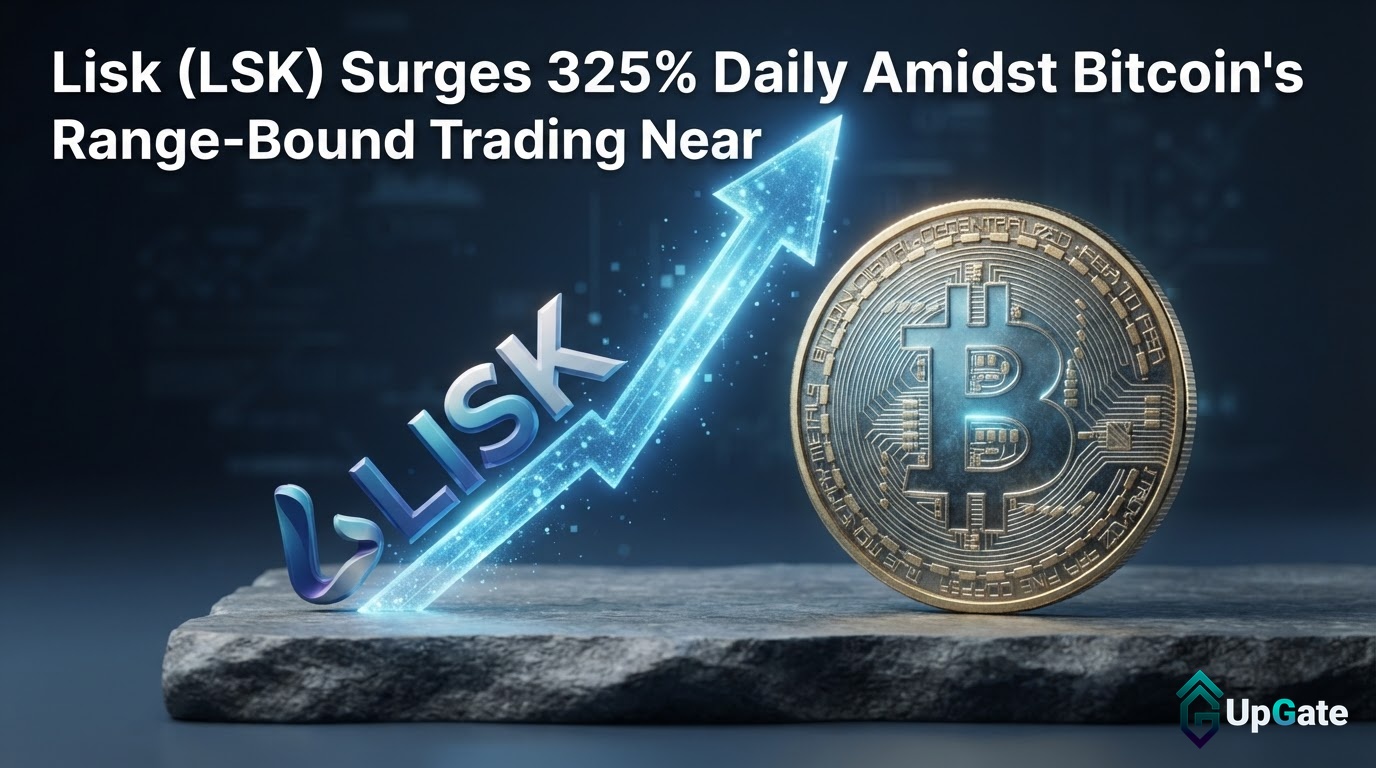
    Lisk (LSK) has posted an extraordinary daily gain of 325%, reaching $0.82, and an even more striking 800% surge over the past week. This performance sharply contrasts with Bitcoin’s consolidation. According to CryptoPotato, Bitcoin’s market capitalization has dipped below $1.550 trillion on CoinMarketCap, with its dominance over altcoins standing at 58.7%.

    Bitcoin’s price action over the past week has been notably volatile, influenced by economic indicators. In the first week of September, Bitcoin reached a high of $82,400 before a Friday drop below $79,000, following the US jobs report. The subsequent week saw Bitcoin trading between $80,000 and $77,600. A further dip occurred on a Thursday, with Bitcoin slipping to $77,000. The release of August’s CPI numbers initially drove Bitcoin down to $76,000, a multi-week low. However, it recovered to $79,800 within an hour, only to face another rejection and return to the $77,000 level. Since then, Bitcoin has traded sideways between $77,000 and $77,500.

    Other major altcoins have shown mixed results. Ethereum, after reaching nearly $2,700 on Friday, is now contending to remain above $2,500. BNB has experienced a 1.3% daily decline, trading at $722, while XRP remains significantly below the $1.40 level. SOL, TRX, DOGE, XMR, and LINK are also reported to be slightly down. Conversely, smaller gains were noted in RAIN (over 2%), CRO (3%), PUMP (6%), and BTW (11% to over $0.55).

    The total cryptocurrency market cap is approximately $2.640 trillion on CoinMarketCap, showing minimal change from the previous day. The substantial gains in Lisk (LSK) against Bitcoin’s consolidation and the broader market’s reaction to economic data suggest a complex and segmented crypto landscape. The specific drivers behind Lisk’s significant surge and the sustainability of its performance are points of ongoing observation, as is the market’s continued response to macroeconomic factors.

    Why This Matters

    The materials describe a narrow update: Lisk (LSK) surged by 325% daily and 800% weekly. The exact timing of the CPI numbers release relative to the Thursday drop.

    Broader Context

    Source materials place the factual news in this context: Similar to the previous weekends, this one is quite sluggish for bitcoin.

  • رشد ۳۲۵ درصدی آلت‌کوین و رکود بیت‌کوین در ۷۷ هزار دلار

    رشد ۳۲۵ درصدی آلت‌کوین و رکود بیت‌کوین در ۷۷ هزار دلار

    بیت‌کوین در محدوده ۷۷ هزار دلاری؛ آلت‌کوین‌ها نوسان دارند

    تهران، ایران – بازار ارزهای دیجیتال در آخر هفته جاری شاهد رکود نسبی بود و قیمت بیت‌کوین در محدوده‌ای بسیار تنگ بین ۷۷ تا ۷۷.۴ هزار دلار در نوسان است. اکثر آلت‌کوین‌های بزرگ نیز وضعیت مشابهی دارند و در مقایسه با روز گذشته، افت جزئی را تجربه کرده‌اند. در این میان، توکن‌های CRO، PUMP و BTW رشد قابل توجهی را ثبت کرده‌اند، اما یک آلت‌کوین خاص، عنوان پربازده‌ترین را به خود اختصاص داده است.

    هفته اول سپتامبر برای بیت‌کوین با نوسانات شدیدی همراه بود. این ارز دیجیتال پس از صعود بی‌سابقه به ۸۲.۴ هزار دلار، که بالاترین سطح از اواسط ماه می بود، با مقاومت روبرو شد و در روز جمعه پس از انتشار گزارش مشاغل آمریکا، به زیر ۷۹ هزار دلار سقوط کرد. هفته پس از آن نسبتاً آرام‌تر بود و بیت‌کوین بین ۸۰ تا ۷۷.۶ هزار دلار در نوسان بود.

    مرز بالایی مانع از تلاش‌ها برای شکست مقاومت شد و در مقابل، سطح حمایتی نیز مانع از سقوط بیشتر قیمت شد. اما این وضعیت در روز پنجشنبه و به ویژه جمعه تغییر کرد. ابتدا، مرز حمایتی شکسته شد و بیت‌کوین به ۷۷ هزار دلار سقوط کرد. سپس، انتشار داده‌های شاخص قیمت مصرف‌کننده (CPI) برای ماه اوت، شوک بزرگی به بازار وارد کرد.

    واکنش اولیه به این داده‌ها، بیت‌کوین را به ۷۶ هزار دلار رساند که پایین‌ترین سطح در چندین هفته اخیر محسوب می‌شد. با این حال، خریداران با غافلگیری بازار، قیمت را در عرض یک ساعت به ۷۹.۸ هزار دلار رساندند. اما این صعود نیز پایدار نبود و بیت‌کوین مجدداً با مقاومت روبرو شد و به نقطه اولیه خود یعنی ۷۷ هزار دلار بازگشت. از آن زمان، قیمت در محدوده‌ای بین ۷۷ تا ۷۷.۵ هزار دلار به صورت جانبی در حرکت بوده و در حال حاضر بالای ۷۷ هزار دلار معامله می‌شود.

    ارزش بازار کل ارزهای دیجیتال به زیر ۱.۵۵۰ تریلیون دلار در CoinMarketCap کاهش یافته است، در حالی که سلطه بیت‌کوین بر آلت‌کوین‌ها نیز در سطح ۵۸.۷ درصد و بدون تغییر قابل توجهی باقی مانده است.

    وضعیت سایر ارزهای دیجیتال:

    • اتریوم (ETH): پس از صعود به نزدیک ۲۷۰۰ دلار در روز جمعه، با مقاومت روبرو شد و اکنون برای حفظ خود بالای ۲۵۰۰ دلار تلاش می‌کند.
    • بایننس کوین (BNB): با افت ۱.۳ درصدی در روز گذشته، به ۷۲۲ دلار رسیده است.
    • ریپل (XRP): همچنان به طور قابل توجهی زیر سطح کلیدی ۱.۴۰ دلار قرار دارد.
    • سولانا (SOL)، ترون (TRX)، دوج‌کوین (DOGE)، مونرو (XMR) و چین‌لینک (LINK): نیز اندکی در محدوده قرمز قرار دارند.

    در مقابل، توکن RAIN بیش از ۲ درصد رشد داشته، CRO با ۳ درصد افزایش همراه بوده و PUMP نیز با ۶ درصد رشد، همانطور که از نامش پیداست، پامپ شده است. BTW با رشد ۱۱ درصدی و عبور از مرز ۰.۵۵ دلار، توجه‌ها را از آلت‌کوین‌های بزرگتر به خود جلب کرده است.

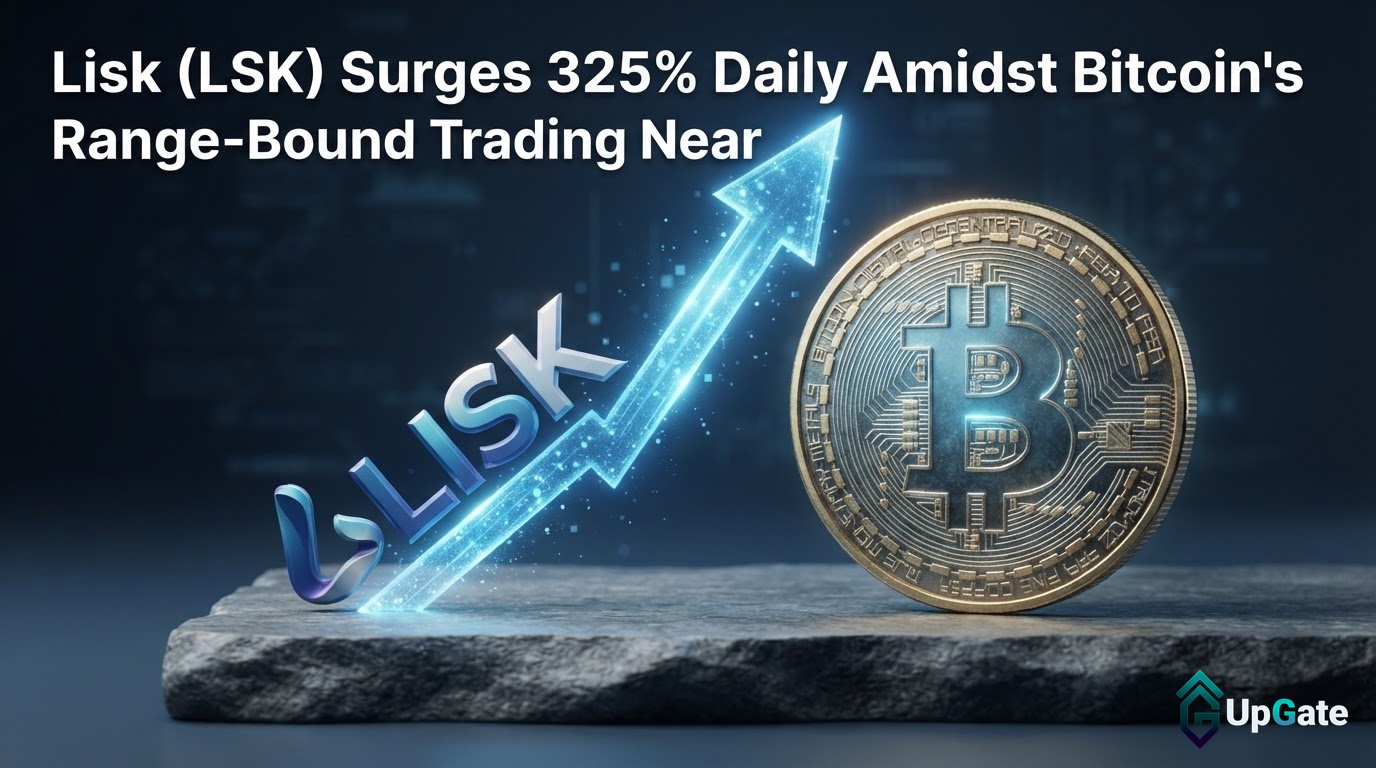
    اما آلت‌کوین مورد بحث که بیشترین رشد را ثبت کرده، Lisk (LSK) است. این دارایی با رشد چشمگیر ۳۲۵ درصدی در یک روز به ۰.۸۲ دلار رسیده است. رشد هفتگی آن نیز قابل توجه‌تر بوده و با ۸۰۰ درصد افزایش همراه شده است.

    ارزش کل بازار ارزهای دیجیتال در CoinMarketCap، در حدود ۲.۶۴۰ تریلیون دلار، تقریباً مشابه روز گذشته باقی مانده است.

  • XRP Consolidates Within Descending Channel; Key Support and Resistance Levels Under Scrutiny

    XRP Consolidates Within Descending Channel; Key Support and Resistance Levels Under Scrutiny

    XRP’s price is currently navigating a descending channel, a pattern indicating consolidation rather than a clear directional trend, leaving its immediate future uncertain. This pattern follows a significant surge in August, which saw XRP’s price climb from around $0.99 to over $1.50. Since then, XRP has formed a series of lower highs, suggesting a corrective price action.

    According to the analysis, XRP is presently trading around $1.37, testing a near-term support zone identified between $1.33 and $1.34. While buyers have shown some defense of this area, leading to modest rebounds, the momentum has not been sufficient to break the sequence of declining highs. The data suggests this consolidation places the market at an important juncture.

    Key Technical Levels Dictate Trajectory

    Technical indicators point to several key levels that may likely dictate XRP’s short-to-medium term trajectory. On the downside, if the $1.33-$1.34 support zone fails, the next significant area of interest is around $1.26. This level aligns with the 0.618 Fibonacci retracement and a moving average, forming part of a broader support zone between $1.22 and $1.27. As per the report, losing this $1.22-$1.27 area would represent a more significant deterioration in market structure, potentially exposing deeper support around the $1.09-$1.13 zone.

    On the upside, XRP faces resistance. The upper trendline of the descending channel is approaching the $1.40-$1.42 region, acting as dynamic resistance. To amid reported market activity in the corrective trend, XRP would need to break above this descending trendline and achieve acceptance above the $1.40-$1.42 zone. Further recovery would then require navigating the $1.45-$1.50 resistance area before challenging the major resistance zone located between $1.61 and $1.70.

    Current Price Action Remains Corrective

    The current price action remains corrective rather than decisively bullish, according to the analysis. Buyers have yet to generate enough momentum to overcome the pattern of lower highs established since the August peak. A rejection from the current trendline would likely keep the descending structure intact, potentially leading to revisits of the channel’s lower boundary, which converges with the $1.22-$1.27 support zone.

    The analysis suggests that while XRP is consolidating, its price action is dependent on holding key support levels and breaking through resistance zones. The immediate outlook remains uncertain, with no definitive bullish or bearish signal yet established. The market is at a critical juncture, and the defense of the $1.33-$1.34 support will be a key indicator of near-term sentiment. A notable move above the descending trendline and subsequent acceptance above the $1.40-$1.42 zone would be the first meaningful indication that the correction is losing strength, according to the analysis.

    Why This Matters

    The materials describe a narrow update: XRP experienced a surge in August, reaching above $1.50 from around $0.99. Whether buyers can regain control and establish a clear direction remains uncertain.

    Broader Context

    Source materials place the market analysis in this context: Ripple’s XRP has yet to establish a clear direction after its August surge, with repeated rebounds being capped before buyers can regain control.

  • ETH Surges Past $2.5K, $3K Target in Sight

    ETH Surges Past $2.5K, $3K Target in Sight

    Ethereum is attempting to convert its post-rally consolidation into a continuation setup. The cryptocurrency remains compressed near the upper end of its trading range, and a sustained breakout could pave the way for another bullish leg. However, a recent Consumer Price Index-driven false breakout underscores the need for confirmation.

    Daily Timeframe Analysis

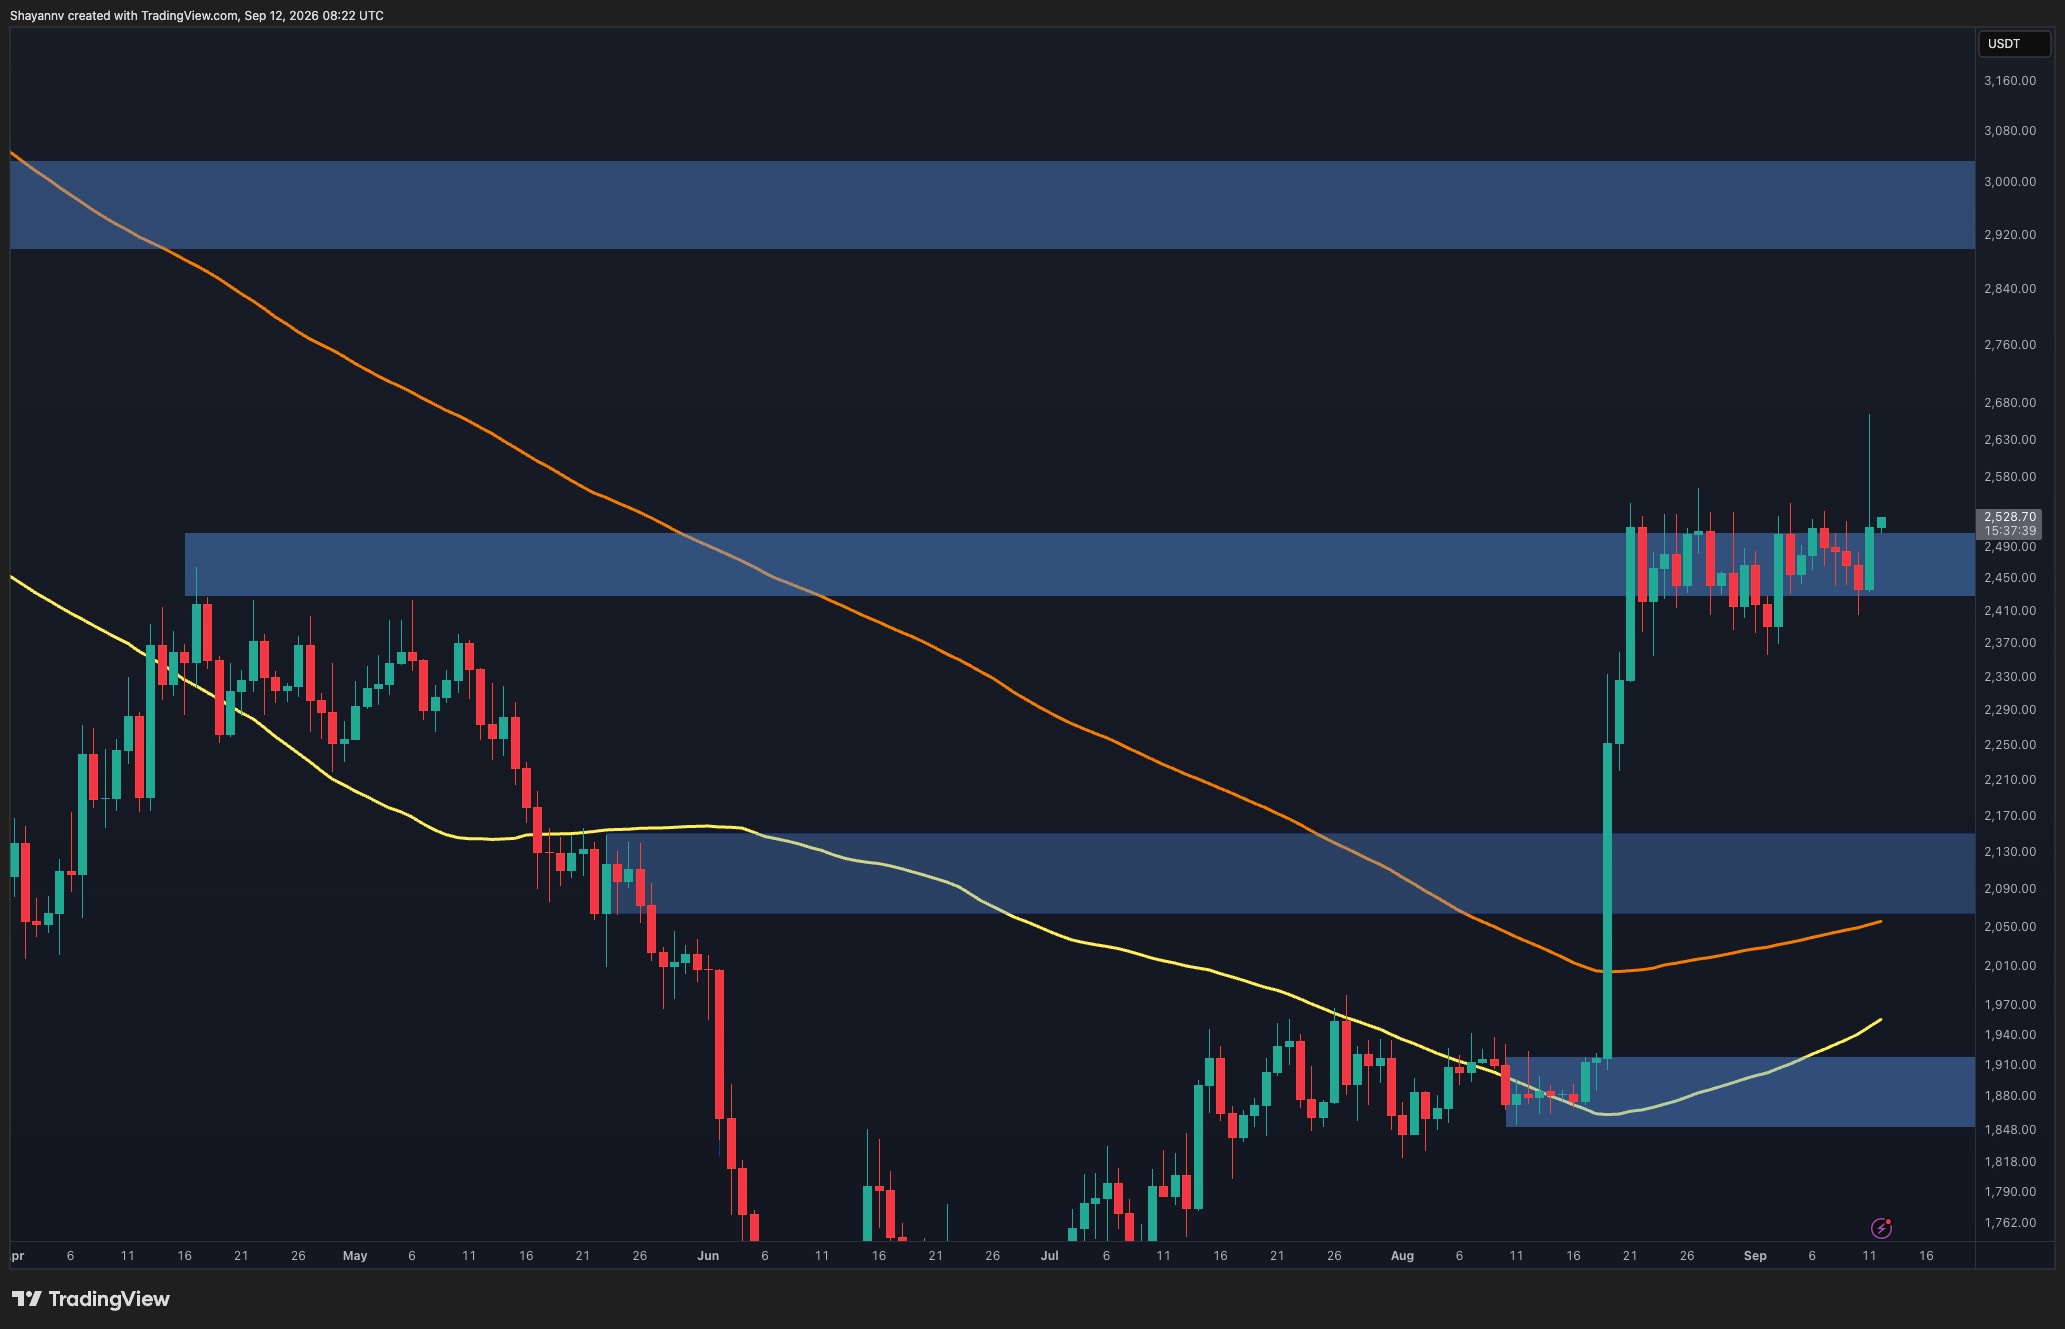
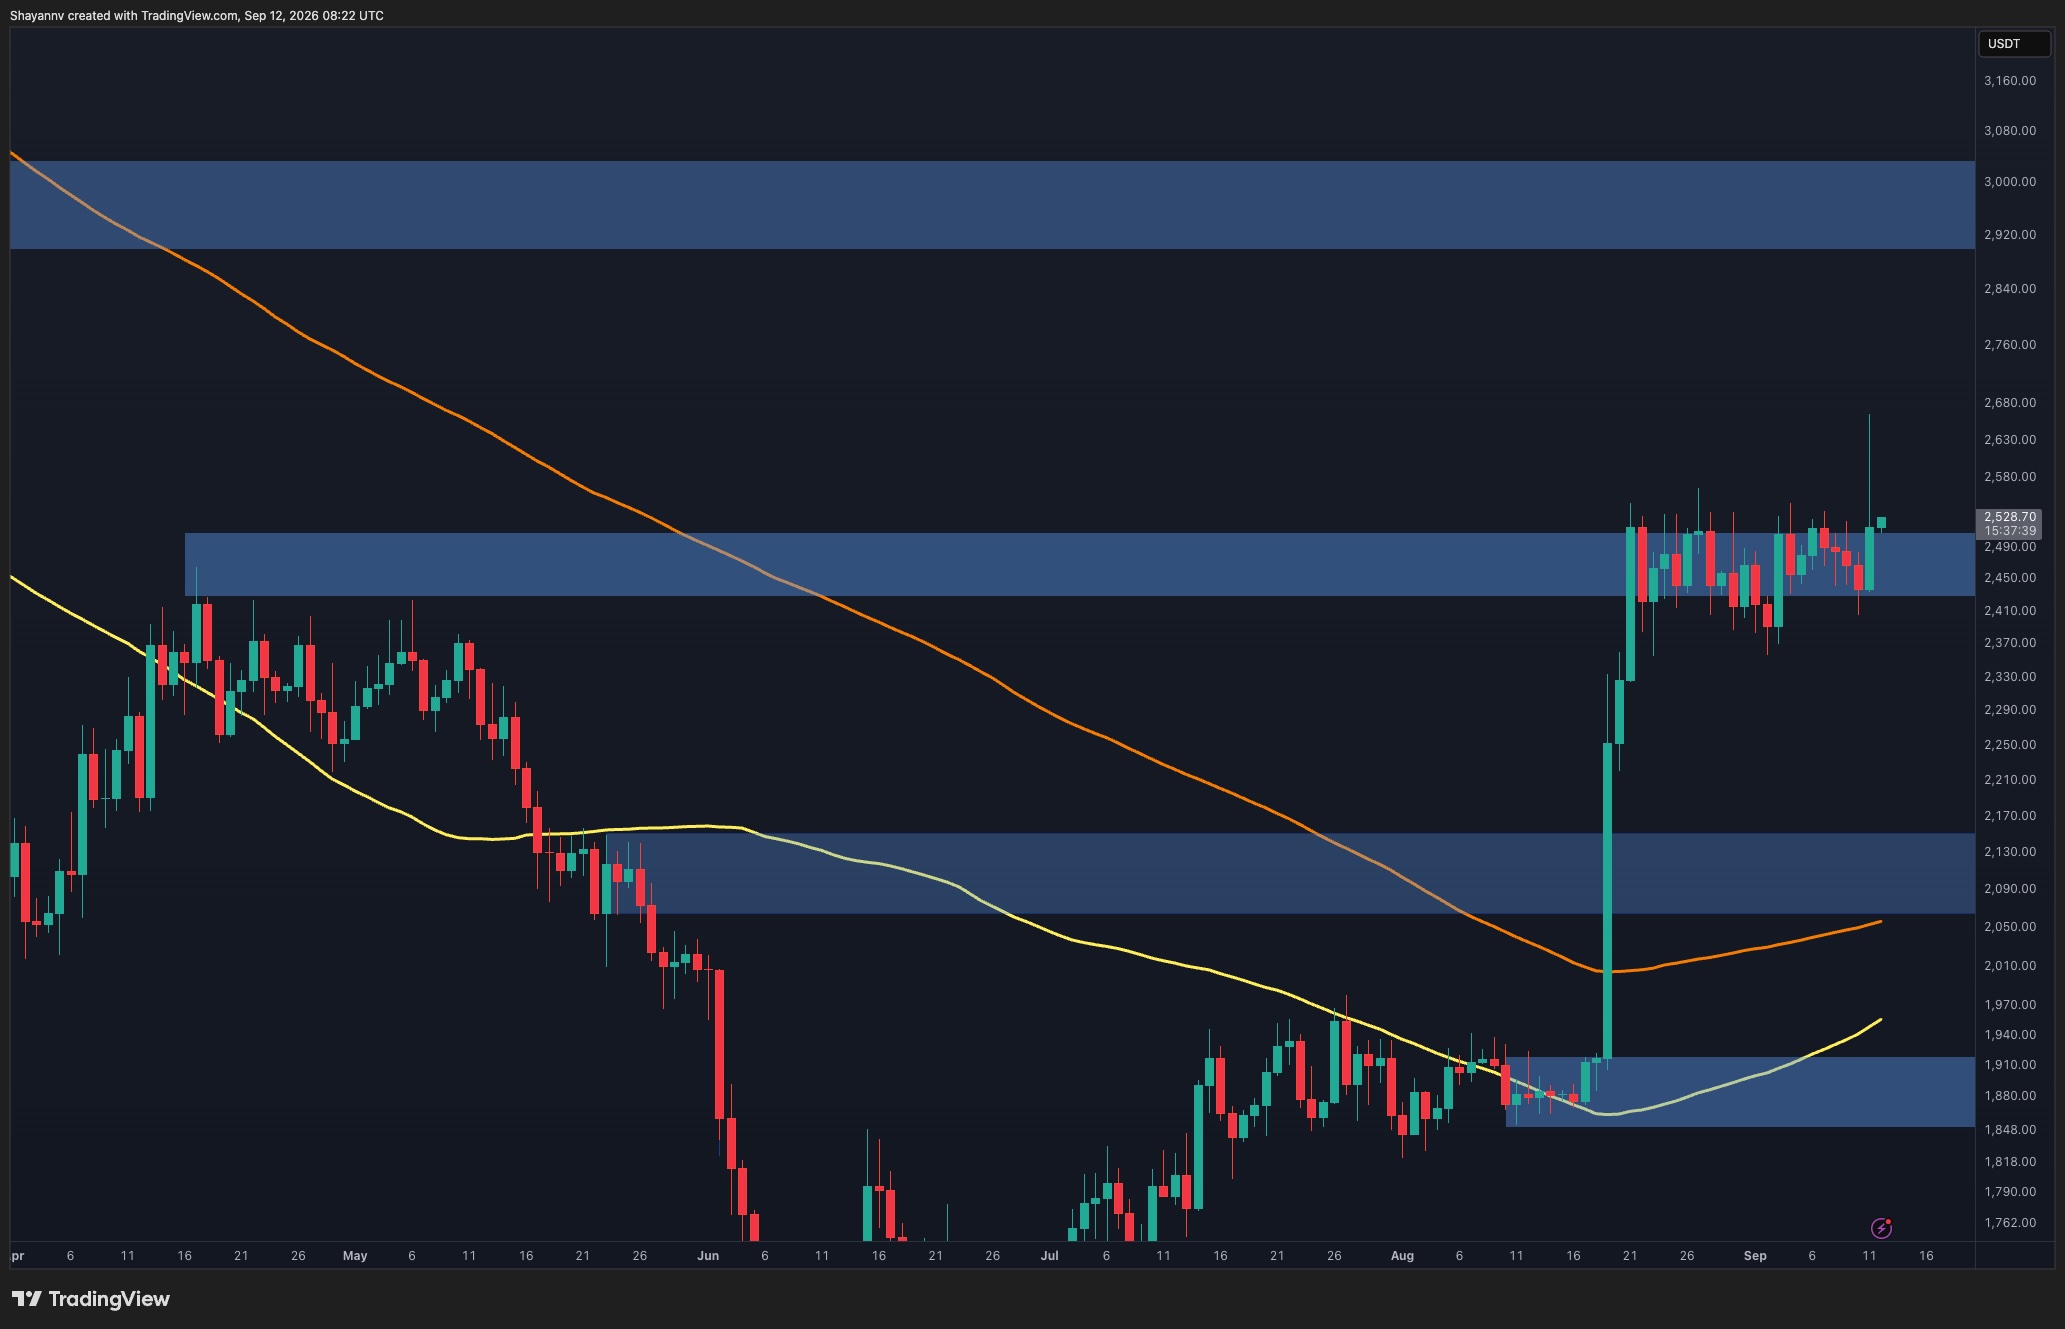
    On the daily chart, Ether (ETH) continues to hold the substantial gains achieved during its explosive August breakout. Crucially, the market has avoided a significant retracement despite repeated tests of the $2.43K-$2.52K area. This suggests that sellers have so far been unable to force prices back toward lower support zones.

    The current consolidation is occurring around the $2.45K-$2.52K resistance zone, with ETH trading near $2.52K. A convincing daily breakout and close above this region would bolster the bullish structure and could open the door to higher prices. In such a scenario, the next major resistance level visible on the chart is situated around the $2.92K-$3.03K zone.

    However, the market must first establish acceptance above the current resistance. Failure to do so would leave ETH vulnerable to further rotation within the existing range. The $2.05K-$2.14K region represents the next significant daily support area below, with moving averages also gradually trending upward beneath the price.

    Four-Hour Chart Insights

    The four-hour chart offers a clearer perspective on the immediate breakout attempt. ETH has spent several weeks trading within a range of roughly $2.35K to $2.56K, repeatedly encountering rejections at both ends without establishing a sustained directional move.

    The most recent CPI-driven volatility briefly pushed the price above the $2.56K range high, with a wick extending toward $2.66K. However, buyers were unable to sustain the breakout, and ETH quickly retreated back within its established structure. This false breakout is significant, as it demonstrates that simply trading above the range is insufficient. The market needs to hold above the $2.56K resistance level to confirm a genuine structural breakout.

    Nevertheless, ETH has recovered toward the upper boundary once more, rather than experiencing a sharp rejection. If buyers can secure acceptance above $2.56K, the consolidation could resolve into another bullish leg.

    Conversely, another rejection would keep the range intact and initially expose the $2.43K-$2.45K support zone. A more decisive breakdown below the range floor around $2.35K would weaken the continuation scenario and could shift attention toward the $2.22K-$2.27K support zone.

    Spot Taker CVD Analysis

    The 90-day Spot Taker CVD (Cumulative Volume Difference) tracks the cumulative difference between market buy and market sell volume. An increasing positive CVD indicates dominance by taker buyers, while a declining negative reading reflects stronger aggressive selling.

    The latest data reveals a notable shift toward positive readings, indicating that taker buyers have regained dominance after more neutral conditions were observed during July and early August. This transition has coincided with ETH’s recovery toward the $2.5K region and serves as a constructive signal for the current consolidation.

    If taker-buy dominance persists while ETH establishes itself above the range resistance, the combination would provide stronger confirmation that demand is supporting another bullish leg. A loss of this buy-side dominance, particularly alongside another failed breakout, would instead suggest that aggressive demand is not yet robust enough to sustain the upward move.

  • تحلیل قیمت اتریوم: بازگشت ۳ هزار دلار پس از بازپس‌گیری ۲.۵ هزار دلار توسط ETH

    تحلیل قیمت اتریوم: بازگشت ۳ هزار دلار پس از بازپس‌گیری ۲.۵ هزار دلار توسط ETH

    تحلیل قیمت اتریوم: بازگشت به محدوده ۳ هزار دلاری پس از عبور ETH از ۲.۵ هزار دلار

    اتریوم در تلاش است تا تثبیت پس از رالی خود را به یک وضعیت ادامه‌دار تبدیل کند. این ارز دیجیتال همچنان در نزدیکی سقف محدوده خود فشرده شده است و یک شکست پایدار می‌تواند پایه‌ای برای یک موج صعودی دیگر فراهم کند، هرچند که نوسان اخیر ناشی از شاخص قیمت مصرف‌کننده (CPI) نیاز به تأیید را برجسته می‌کند.

    در تایم فریم روزانه، ETH همچنان سود قابل توجهی را که از شکست انفجاری ماه اوت به دست آورده، حفظ کرده است. مهم‌تر از آن، بازار با وجود تست مکرر منطقه ۲.۴۳ هزار تا ۲.۵۲ هزار دلاری، از اصلاح قابل توجهی اجتناب کرده است، که نشان می‌دهد فروشندگان تاکنون نتوانسته‌اند قیمت را به سمت مناطق حمایتی پایین‌تر بازگردانند.

    تثبیت فعلی در حدود منطقه مقاومت ۲.۴۵ هزار تا ۲.۵۲ هزار دلاری در حال وقوع است و ETH اکنون در نزدیکی ۲.۵۲ هزار دلار معامله می‌شود. یک شکست روزانه قانع‌کننده و بسته شدن قیمت بالای این منطقه، ساختار صعودی را تقویت کرده و می‌تواند راه را به سوی قیمت‌های بالاتر باز کند. در این صورت، مقاومت عمده بعدی که در نمودار قابل مشاهده است، در حدود منطقه ۲.۹۲ هزار تا ۳.۰۳ هزار دلاری قرار دارد.

    با این حال، بازار هنوز نیاز دارد تا پذیرش بالای مقاومت فعلی را تثبیت کند. عدم انجام این کار، ETH را در برابر چرخش مجدد در داخل محدوده آسیب‌پذیر می‌سازد. منطقه ۲.۰۵ هزار تا ۲.۱۴ هزار دلاری، منطقه حمایتی روزانه قابل توجه بعدی در پایین است، در حالی که میانگین‌های متحرک نیز به تدریج در زیر قیمت به سمت بالا در حال چرخش هستند.

    نمودار ۴ ساعته

    نمودار ۴ ساعته دید واضح‌تری از تلاش فوری برای شکست ارائه می‌دهد. ETH چندین هفته را در محدوده‌ای تقریباً بین ۲.۳۵ هزار تا ۲.۵۶ هزار دلار سپری کرده و به طور مکرر هر دو انتها را رد کرده بدون اینکه یک حرکت جهت‌دار پایدار ایجاد کند.

    آخرین نوسان ناشی از CPI به طور خلاصه قیمت را به بالای سقف محدوده ۲.۵۶ هزار دلاری رساند و سایه آن تا ۲.۶۶ هزار دلار کشیده شد، اما خریداران نتوانستند شکست را حفظ کنند و ETH به سرعت به داخل ساختار بازگشت. این فیک‌اوت (fakeout) مهم است زیرا نشان می‌دهد صرفاً معامله در بالای محدوده کافی نیست. بازار برای تأیید یک شکست ساختاری واقعی باید بالای سطح مقاومت ۲.۵۶ هزار دلاری باقی بماند.

    با این حال، ETH به جای تجربه یک رد شدید، دوباره به سمت مرز بالایی بهبود یافته است. اگر خریداران بتوانند پذیرش بالای ۲.۵۶ هزار دلار را تضمین کنند، تثبیت می‌تواند به یک موج صعودی دیگر منجر شود.

    برعکس، یک رد دیگر، محدوده را دست نخورده نگه می‌دارد و ابتدا منطقه حمایتی ۲.۴۳ هزار تا ۲.۴۵ هزار دلاری را در معرض خطر قرار می‌دهد. یک شکست قاطع‌تر زیر کف محدوده در حدود ۲.۳۵ هزار دلار، سناریوی ادامه را تضعیف کرده و می‌تواند توجه را به منطقه حمایتی ۲.۲۲ هزار تا ۲.۲۷ هزار دلاری معطوف کند.

    تحلیل CVD اسپات ۹۰ روزه

    شاخص ۹۰ روزه Spot Taker CVD (تفاوت تجمعی بین حجم خرید بازار و حجم فروش بازار) را ردیابی می‌کند. افزایش مثبت CVD نشان‌دهنده تسلط خریداران است، در حالی که کاهش خوانش منفی نشان‌دهنده فروش تهاجمی قوی‌تر است.

    آخرین داده‌ها نشان‌دهنده تغییر قابل توجهی به سمت رنگ سبز است که نشان می‌دهد خریداران پس از شرایط خنثی‌تر مشاهده شده در طول ماه‌های ژوئیه و اوایل اوت، دوباره غالب شده‌اند. این انتقال با بازیابی ETH به سمت منطقه ۲.۵ هزار دلاری همزمان شده و بنابراین یک سیگنال سازنده برای تثبیت فعلی است.

    اگر تسلط خریداران ادامه یابد در حالی که ETH خود را بالای مقاومت محدوده تثبیت می‌کند، این ترکیب تأیید قوی‌تری مبنی بر اینکه تقاضا از یک موج صعودی دیگر حمایت می‌کند، ارائه خواهد داد. از دست دادن این تسلط سمت خرید، به ویژه در کنار یک شکست ناموفق دیگر، در عوض نشان می‌دهد که تقاضای تهاجمی هنوز به اندازه کافی قوی نیست که بتواند حرکت را حفظ کند.

  • تحلیل قیمت ریپل: سقف‌های پایین‌تر متوالی، دردسر برای XRP پیش از هفته‌ای حساس

    تحلیل قیمت ریپل: سقف‌های پایین‌تر متوالی، دردسر برای XRP پیش از هفته‌ای حساس

    تحلیل قیمت ریپل: سقف‌های پایین‌تر متوالی، دردسر را برای XRP در آستانه هفته‌ای حساس پیش‌بینی می‌کنند

    ارز دیجیتال XRP ریپل همچنان در مسیری نامشخص پس از جهش ماه اوت خود قرار دارد و تلاش‌های مکرر خریداران برای بازپس‌گیری کنترل، پیش از رسیدن به سطوح بالاتر، با مقاومت مواجه شده است. فشردگی فعلی بازار را در نقطه‌ای حیاتی قرار داده است؛ حفظ سطوح حمایتی نزدیک می‌تواند در نهایت زمینه‌ساز تلاش مجدد برای بازیابی قیمت باشد.

    در نمودار روزانه، XRP پس از رشد شدید از حدود ۰.۹۹ دلار به بالای ۱.۵۰ دلار، در حال تثبیت است. از زمان این جهش اولیه، قیمت شاهد شکل‌گیری دنباله‌ای از سقف‌های پایین‌تر بوده، در حالی که همچنان بالای ساختار حمایتی گسترده‌تر باقی مانده و یک کانال نزولی را تشکیل داده است.

    این دارایی در حال حاضر حدود ۱.۳۷ دلار معامله می‌شود که نزدیک به سطح ۰.۵ فیبوناچی اصلاحی در ۱.۳۴ دلار است. این امر منطقه ۱.۳۳ تا ۱.۳۴ دلار را به یک ناحیه حمایتی مهم در کوتاه‌مدت تبدیل می‌کند. تاکنون، خریداران به نظر می‌رسد از این سطح دفاع می‌کنند، اما بازگشت قیمت همچنان محدود است.

    در صورت از دست رفتن این سطح، هدف نزولی مهم بعدی در حدود سطح ۰.۶۱۸ فیبوناچی در ۱.۲۶ دلار قرار دارد. این منطقه همچنین با میانگین متحرک و منطقه حمایتی گسترده‌تر ۱.۲۲ تا ۱.۲۷ دلار هم‌راستا است و آن را به یک ناحیه به‌ویژه مهم برای ساختار میان‌مدت تبدیل می‌کند.

    در سمت صعودی، XRP برای به چالش کشیدن منطقه مقاومت اصلی ۱.۶۱ تا ۱.۷۰ دلار، نیاز به بازیابی و عبور از منطقه ۱.۴۵ تا ۱.۵۰ دلار دارد. تا آن زمان، روند قیمت به جای روند صعودی قاطع، اصلاحی باقی خواهد ماند.

    نمودار ۴ ساعته، فشردگی تدریجی را که از اوج ماه اوت توسعه یافته است، برجسته می‌کند. XRP همچنان در داخل یک کانال نزولی معامله می‌شود و خط روند بالایی اکنون به منطقه ۱.۴۰ تا ۱.۴۲ دلار نزدیک شده و به عنوان مقاومت پویا عمل می‌کند.

    آخرین بازگشت قیمت از حدود ۱.۳۳ دلار، قیمت را به سمت ۱.۳۷ دلار بازگردانده است، اما خریداران هنوز نتوانسته‌اند شتاب کافی برای شکستن دنباله سقف‌های نزولی ایجاد کنند. شکستن خط روند نزولی و پذیرش متعاقب آن بالای منطقه ۱.۴۰ تا ۱.۴۲ دلار، اولین نشانه معنادار از کاهش قدرت اصلاح خواهد بود. چنین حرکتی می‌تواند توجه را دوباره به سمت ۱.۴۵ دلار و در نهایت منطقه مقاومت بالاتر جلب کند.

    در مقابل، رد شدن مجدد از خط روند، ساختار نزولی را حفظ خواهد کرد. در این صورت، XRP می‌تواند مرز پایینی کانال را مجدداً لمس کند که به سمت منطقه حمایتی ۱.۲۲ تا ۱.۲۷ دلار همگرا می‌شود. از دست دادن این منطقه نشان‌دهنده وخامت قابل توجه‌تری در ساختار بازار خواهد بود و می‌تواند منطقه حمایتی عمیق‌تر ۱.۰۹ تا ۱.۱۳ دلار را آشکار کند.

  • UniCredit Explores Crypto Custody, Seeks Tech Partner

    UniCredit Explores Crypto Custody, Seeks Tech Partner

    UniCredit Explores Digital Asset Expansion, Seeking Technology Partner

    UniCredit is reportedly exploring a significant expansion into digital assets, which would include offering cryptocurrency custody and brokerage services. The Italian banking giant has begun the process of selecting a technology provider to manage these assets and facilitate client transactions, according to sources familiar with the matter cited by Bloomberg.

    The discussions are in their nascent stages, and no definitive decisions have been made. Potential areas under consideration for the bank’s digital asset strategy encompass custody and brokerage, the development of tokenized investment products and fixed-income securities, and the implementation of stablecoin applications for its clientele. UniCredit has not yet disclosed the specific providers it is evaluating, the potential investment amount, or a timeline for selecting a partner.

    Any cryptocurrency services launched by UniCredit would operate under the European Union’s Markets in Crypto-Assets (MiCA) regulation, which became fully effective on July 1. MiCA mandates that crypto-asset service providers obtain a license and permits authorized firms to offer custody and trading services across the 30-country European Economic Area.

    The strategy of enlisting an external technology provider for digital asset custody is a path already adopted by other major financial institutions. Deutsche Bank, for instance, partnered with the Swiss firm Taurus for its digital asset custody and tokenization initiatives, following an extensive selection and due diligence process.

    UniCredit has not shied away from introducing crypto-related products to its clients. In July 2025, the bank launched a five-year, dollar-denominated certificate linked to BlackRock’s iShares Bitcoin Trust (IBIT). This product, available to professional clients, offers full capital protection at maturity, a cap of 85% on returns, and requires a minimum investment of $25,000. It marked the first offering of its kind in Italy.

    Further demonstrating its engagement with tokenization, UniCredit, in collaboration with state lender Cassa Depositi e Prestiti, structured Italy’s first tokenized minibond on a public blockchain in December 2025. This involved a €5 million issuance for E4 Computer Engineering, recorded on the Polygon network.

    Additionally, UniCredit is a member of Qivalis, an Amsterdam-based consortium comprising 37 European banks across 15 countries. This consortium plans to launch a MiCA-compliant euro stablecoin on the Ethereum blockchain in the latter half of 2026. The stablecoin would be backed one-to-one by euro deposits, pending approval from the Dutch central bank.

    Other prominent lenders have already begun offering cryptocurrency services to their customers. BBVA has introduced Bitcoin (BTC) trading and custody for its private banking clients in Switzerland. Similarly, Israel’s Bank Leumi has partnered with Galaxy to manage trading and custody services, with a planned launch in 2027 that will include Bitcoin, Ethereum (ETH), and Solana (SOL).

    UniCredit’s digital market expansion extends beyond cryptocurrencies. On September 8, the bank acquired a minority stake in VC Trade, a Frankfurt-based platform focused on digitizing bond and loan transactions. This platform operates within the debt markets, separate from the bank’s cryptocurrency initiatives, and has facilitated over €90 billion in transactions across more than 600 deals.

  • یونی‌کردیت در پی ارائه خدمات رمزارز و جستجو برای شریک فناوری

    یونی‌کردیت در پی ارائه خدمات رمزارز و جستجو برای شریک فناوری

    یونی‌کردیت در حال بررسی ورود به حوزه دارایی‌های دیجیتال و خدمات رمزارزی

    به گزارش بلومبرگ، بانک ایتالیایی یونی‌کردیت (UniCredit) در حال بررسی گسترش فعالیت‌های خود در حوزه دارایی‌های دیجیتال است که شامل خدمات نگهداری و کارگزاری رمزارزها خواهد شد. این بانک همچنین فرآیند انتخاب یک ارائه‌دهنده فناوری برای نگهداری دارایی‌ها و مدیریت تراکنش‌های مشتریان را آغاز کرده است.

    مراحل اولیه و حوزه‌های مورد بررسی

    بر اساس این گزارش، مذاکرات در مراحل اولیه قرار دارد و هنوز هیچ تصمیم نهایی اتخاذ نشده است. حوزه‌هایی که در حال حاضر مورد بررسی قرار گرفته‌اند شامل نگهداری و کارگزاری دارایی‌های دیجیتال، محصولات سرمایه‌گذاری توکنیزه شده، اوراق قرضه با درآمد ثابت و کاربردهای استیبل‌کوین برای مشتریان است. یونی‌کردیت هنوز نام ارائه‌دهندگان فناوری مورد نظر خود، میزان سرمایه‌گذاری احتمالی یا زمان انتخاب نهایی را اعلام نکرده است.

    چارچوب نظارتی MiCA

    هرگونه خدمات رمزارزی ارائه شده توسط یونی‌کردیت تحت مقررات بازارهای دارایی‌های رمزارزی اتحادیه اروپا (MiCA) قرار خواهد گرفت که دوره مهلت آن در تاریخ ۱ ژوئیه به پایان رسید. MiCA ارائه‌دهندگان خدمات دارایی رمزارزی را ملزم به دریافت مجوز می‌کند و به شرکت‌های مجاز اجازه می‌دهد تا خدمات نگهداری و معاملاتی را در سراسر منطقه اقتصادی اروپا که شامل ۳۰ کشور است، ارائه دهند.

    مسیر سایر بانک‌های بزرگ

    انتخاب یک ارائه‌دهنده فناوری خارجی، مسیری است که سایر بانک‌های بزرگ نیز برای ورود به حوزه نگهداری رمزارزها در پیش گرفته‌اند. به عنوان مثال، دویچه بانک (Deutsche Bank) پس از یک فرآیند دقیق انتخاب و بررسی، شرکت سوئیسی Taurus را برای نگهداری دارایی‌های دیجیتال و توکنیزاسیون انتخاب کرد.

    سابقه یونی‌کردیت در محصولات مرتبط با رمزارز

    یونی‌کردیت پیش از این نیز محصولات مرتبط با رمزارز را به مشتریان خود ارائه کرده است. این بانک در ژوئیه ۲۰۲۵، یک گواهی پنج ساله با پشتوانه دلار که به صندوق قابل معامله در بورس (ETF) بیت‌کوین BlackRock (iShares Bitcoin Trust – IBIT) مرتبط بود را به مشتریان حرفه‌ای خود عرضه کرد. این محصول با تضمین کامل سرمایه در سررسید، سقف بازدهی ۸۵ درصد و حداقل سرمایه‌گذاری ۲۵ هزار دلار همراه بود و اولین محصول از این نوع در ایتالیا محسوب می‌شد.

    در دسامبر ۲۰۲۵، یونی‌کردیت و بانک دولتی Cassa Depositi e Prestiti، اولین اوراق قرضه کوچک (minibond) توکنیزه شده ایتالیا را بر روی یک بلاک‌چین عمومی ساختاردهی کردند. این اوراق به ارزش ۵ میلیون یورو برای شرکت E4 Computer Engineering صادر و بر روی شبکه Polygon ثبت شد.

    یونی‌کردیت همچنین عضو کنسرسیوم Qivalis در آمستردام است که اکنون ۳۷ بانک اروپایی از ۱۵ کشور را شامل می‌شود. این کنسرسیوم قصد دارد در نیمه دوم سال ۲۰۲۶ یک استیبل‌کوین یورو منطبق با MiCA را بر روی شبکه اتریوم راه‌اندازی کند. این توکن با نسبت یک به یک توسط سپرده‌های یورو پشتیبانی خواهد شد و نیازمند تأیید بانک مرکزی هلند است.

    اقدامات سایر بانک‌ها در حوزه رمزارز

    بانک‌های بزرگ دیگر نیز پیش از این فروش رمزارز به مشتریان را آغاز کرده‌اند. BBVA معاملات و نگهداری بیت‌کوین (BTC) را برای مشتریان بانکداری خصوصی خود در سوئیس آغاز کرده است و بانک Leumi اسرائیل نیز با همکاری Galaxy، خدمات معاملاتی و نگهداری را برای راه‌اندازی در سال ۲۰۲۷ برای بیت‌کوین، اتریوم (ETH) و سولانا (SOL) آماده کرده است.

    گسترش در بازارهای دیجیتال فراتر از رمزارز

    یونی‌کردیت همچنین در بازارهای دیجیتال فراتر از حوزه رمزارز نیز در حال گسترش است. در تاریخ ۸ سپتامبر، این بانک بخشی از سهام پلتفرم VC Trade در فرانکفورت را خریداری کرد. این پلتفرم که در حوزه بازارهای بدهی فعالیت می‌کند و از برنامه‌های رمزارزی مجزا است، معاملات اوراق قرضه و وام را دیجیتالی می‌کند و تاکنون بیش از ۹۰ میلیارد یورو را در بیش از ۶۰۰ تراکنش مدیریت کرده است.

  • India’s Demat 2.0 Pilot Integrates Tokenized Bonds into Regulated Market

    India’s Demat 2.0 Pilot Integrates Tokenized Bonds into Regulated Market

    India has launched Demat 2.0, a pilot infrastructure for issuing, holding, trading, and settling corporate bonds as digital tokens. This initiative integrates directly into the nation’s existing regulated securities market and connects with the Reserve Bank of India’s (RBI) wholesale digital rupee via the Unified Market Interface (UMI) to enable atomic delivery-versus-payment.

    The Demat 2.0 system allows corporate bonds to be created natively on a distributed ledger, with ownership records managed by statutory depositories. This integration aims to streamline the bond issuance and trading process by enabling simultaneous transfer of securities and cash, thereby eliminating the settlement risk inherent in traditional, multi-day processes.

    Early transactions under the pilot have seen significant activity. On September 7, REC Limited issued the first tokenized bonds, raising ₹500 crore from 18 investors. Larsen & Toubro also issued tokenized bonds worth ₹500 crore. On September 9, IIFL raised ₹25 crore from a single investor. Collectively, these initial issuances total ₹1,025 crore (approximately $116 million).

    According to SEBI, issuers can now receive funds on the same day as bidding, a marked improvement over the traditional two-to-three-day settlement period. Secondary-market investors can also receive their proceeds immediately. Furthermore, the infrastructure supports smart contracts for automating coupon and redemption payments directly to investors’ central bank digital currency (CBDC) wallets.

    Crucially, tokenized bonds issued under Demat 2.0 remain legally identical to conventional bonds. Existing regulations concerning credit ratings, disclosures, debenture trustees, and investor protection continue to apply. The infrastructure is private and permissioned, with nodes operated by depositories and stock exchanges, ensuring it operates within the established financial system.

    The rollout of Demat 2.0 is planned in three stages. The current phase focuses on institutional corporate bond issuance. The second stage will introduce secondary-market trading and expand access to retail investors. The final stage may involve bringing additional regulated entities onto the network and exploring the tokenization of other financial instruments.

    While the pilot demonstrates a clear path for integrating distributed ledger technology into India’s financial markets, specific details regarding the timeline for the second and third stages, as well as the exact nature of additional entities and instruments to be included, remain to be clarified.

    Why This Matters

    The materials describe a narrow update: SEBI and RBI have introduced Demat 2. The exact date for the second and third stages of the Demat 2.0 rollout.

    Broader Context

    Source materials place the factual news in this context: Unlike many tokenization experiments built on standalone blockchain platforms, India’s Demat 2.0 model is being integrated directly into the nation’s existing regulated securities market.

  • XRP Price Consolidation: Key Catalysts and Technicals Shape Uncertain September Outlook

    XRP Price Consolidation: Key Catalysts and Technicals Shape Uncertain September Outlook

    XRP is currently consolidating in the low-$1.30s, a period characterized by market indecision as participants await crucial catalysts. These include a significant regulatory decision, potential shifts in whale investor behavior, and the defense of key technical support levels. According to price analysis, the current trading range reflects a sideways-to-mildly bearish structure heading into the final stretch of September.

    Key Support and Resistance Levels
    The mid-to-high-$1.30s represent a critical demand zone where substantial XRP volume has previously traded. This area, along with support near the low-$1.30s (close to the 20-day EMA) and a more significant zone around $1.25–$1.30 (near the 50-day EMA), is being closely watched. Resistance is building above the current range, with initial hurdles identified in the mid-$1.30s to low-$1.40s, followed by heavier supply noted between $1.45–$1.55. The $1.55–$1.70 region stands as the next major test for any potential upward movement.

    Factors Driving Uncertainty
    Several factors are contributing to the current uncertainty surrounding XRP’s trajectory. A looming regulatory decision is considered a potential swing factor for the next major price move, with traders monitoring the CLARITY Act vote timeline. Additionally, shifts in whale behavior, such as the movement of dormant coins, are being observed as potential catalysts, though not necessarily indicative of a sale. The broader macroeconomic environment, particularly signals from Federal Reserve policy, is also impacting the cryptocurrency market as a whole, influencing XRP’s price action.

    Technical Indicators and Market Context
    Technical indicators suggest a neutral Relative Strength Index (RSI), while expanding Bollinger Bands hint at potentially building volatility rather than fading momentum. CoinMarketCap’s tracking shows that XRP has underperformed against the wider crypto market during recent risk-off movements. This follows an August rally that saw XRP climb from approximately $1 to the high-$1.60 range. The current consolidation is occurring within what appears to be a descending triangle pattern.

    Potential Scenarios
    The market’s immediate focus is on whether buyers will defend the low-to-mid-$1.30s support. A break below this level would weaken the current recovery thesis and could lead to a retest of the mid-$1.20s. Conversely, a bullish scenario would involve XRP reclaiming the low-$1.40s, potentially paving the way toward the $1.60 area and possibly the high-$1.80s if a triangle pattern breaks higher. However, the base case, according to analysis, is continued price action between roughly $1.30 and $1.40 as traders await a fresh catalyst.

    Related Market News
    In related market news, Bitcoin Hyper ($HYPER), a Bitcoin Layer 2 project integrating the Solana Virtual Machine, is noted for its positioning as a fast SVM-based execution layer. Currently priced at $0.013686, its presale has raised over $33 million, offering early participants a 35% APY for staking rewards. Research indicates that some traders are exploring earlier-stage infrastructure plays with more room for growth.

    Ultimately, XRP’s next significant move hinges on the interplay of these technical levels, regulatory clarity, and investor sentiment. The current phase is characterized by ambiguity, with the outcome of these converging factors expected to shape XRP’s trajectory into Q4.

    Why This Matters

    The materials describe a narrow update: XRP is trading in the low-$1. Whether buyers will defend the low-to-mid-$1.30s support or allow it to crack.