Tag: Market Trends

  • Ripple’s 9-Year Clock Splits XRP Community

    Ripple’s 9-Year Clock Splits XRP Community

    Legal Expert Urges Ripple to Accelerate XRP Escrow Releases

    Australian lawyer and prominent XRP community commentator Bill Morgan has called on Ripple to reduce the amount of XRP it relocks from its monthly 1 billion XRP escrow release. Morgan argues that accelerating the path to a fully circulating supply would establish XRP as a credible hard money asset and alleviate the persistent supply overhang that weighs on market sentiment.

    While the core argument is not new, Morgan’s specific framing has brought the issue into sharper focus. Ripple’s CTO Emeritus has already signaled the company’s stance on how far it is willing to deviate from its current approach.

    With 32.74 billion XRP still held in escrow, and the current release pace projecting a full circulation timeline of approximately nine years, the structural mathematics lend significant weight to Morgan’s argument. The XRP community is now openly debating whether Ripple possesses both the incentive and the flexibility to shorten this timeline.

    Ripple established its escrow system in 2017, placing 55 billion XRP into 55 separate on-ledger contracts, each designed to release 1 billion XRP on the first of every month. This mechanism was intended to ensure a predictable and auditable supply, preventing sudden dumps from a centralized treasury. However, the system also created an indefinitely extendable schedule: Ripple utilizes the XRP it needs for operations and institutional distribution, then relocks the remainder into new contracts, effectively pushing the release timeline forward month after month.

    Morgan’s publicly stated position on X is direct: “Ripple should release more of the 1 billion each month and not lock so much back in escrow. The sooner it is all released from escrow and the circulating supply is 100% the quicker XRP will become the best hard money.”

    His reasoning is threefold. Firstly, relocking less XRP would shorten the nine-year horizon. Secondly, full circulation would eliminate the psychological impact of a shadow supply that suppresses valuation. Thirdly, a fixed and fully circulating crypto supply is structurally more credible for institutional investors who assess assets based on known fundamentals rather than unpredictable future release schedules.

    It is important to note that Morgan’s current stance is not a complete repudiation of the escrow mechanism. He has previously defended it against claims of being a deliberate price-suppression tool, pointing out that XRP experienced significant price appreciation between November 2024 and January 2025 while monthly releases continued uninterrupted. His current call is for a faster completion of a process he considers legitimate.

    Ripple CTO Emeritus David Schwartz has not supported accelerating the releases and has explicitly rejected more radical proposals, such as burning the escrowed XRP. Schwartz cited Stellar’s token burn as a cautionary example, arguing that it resulted in a short-lived market reaction rather than a sustained increase in valuation. He maintains that Ripple voluntarily relocks any XRP it does not immediately require.

    “If you’re thinking that will have some positive impact on the price, I don’t think there’s any reason to believe that,” Schwartz stated. “Stellar’s burn had no real effect and XRP’s price tracked XLM’s through their burn. So what would the benefit of doing that be?”

    Regarding the timeline, Schwartz acknowledged the inherent uncertainty. “It’s hard to predict because you have to make assumptions about how much XRP Ripple uses and how much gets put back into subsequent escrow months,” he said.

    Schwartz’s position aligns with Ripple’s consistent management of the escrow since its inception. The company has framed its measured and predictable distribution as a feature, not a limitation. Altering this approach would require Ripple to determine that the reputational and institutional benefits of acceleration outweigh the risks of increased near-term sell pressure – a trade-off the company has not yet indicated it is willing to make. Ripple’s recent MiCA regulatory approvals in Europe further underscore this pattern, as the company focuses on building compliant infrastructure where supply stability is a key component of its institutional pitch.

    Beyond the immediate news, the division within the XRP community reflects two distinct theories about XRP’s ultimate purpose. The pro-acceleration camp, aligned with Morgan, views the hard money narrative as the primary long-term value proposition, emphasizing a fixed, fully circulating supply that can be evaluated solely on its fundamentals. Conversely, the pro-current-pace camp sees Ripple’s controlled distribution as an asset that bolsters institutional credibility, rather than a liability.

    A third concern underlies both perspectives: if Ripple releases more net XRP per month without a corresponding increase in demand, the additional supply could exert downward pressure on the market. XRP’s current price action does not strongly suggest that demand is at a capacity that could smoothly absorb larger monthly net releases.

    The option of a token burn, meanwhile, appears to be effectively off the table. Schwartz’s reference to Stellar reflects a settled internal view that destroying escrow reserves would create market noise and permanently eliminate the optionality currently held by Ripple.

  • CBOE Debuts S&P 500 Prediction Markets

    CBOE Debuts S&P 500 Prediction Markets

    Cboe Global Markets has officially entered the prediction trading arena with the launch of its new platform, Cboe Predicts, featuring a suite of securities-based products.

    New Binary Options Tied to Mini-S&P 500

    The initial offering includes binary option contracts linked to the Mini-S&P 500 Index, trading under the symbols XSPBW and XSPBX. These contracts are currently accessible through Interactive Brokers, with plans for Charles Schwab to offer them in the coming months. Cboe anticipates that additional brokerage firms will integrate support for these new contracts over time, thereby expanding market access.

    How Cboe Predicts Works

    According to an official press release, the new products enable traders to speculate on the settlement price of the Mini-S&P 500 Index (XSP) at expiration. Traders can opt for a “yes” position if they anticipate the index will close at or above a predetermined level, or a “no” position if they expect it to finish below that threshold. The XSP index mirrors the performance of the S&P 500 Index but is scaled to one-tenth the size of the larger SPX contract, presenting a more accessible alternative for retail investors.

    Expanding S&P 500 Offerings

    These new products also represent an expansion of Cboe’s existing S&P 500-related offerings. The company has indicated plans to introduce XSP vertical spreads in the future via its Quoted Spread Book system. This system is designed to simplify complex options strategies, aiming to guide traders familiar with straightforward binary contracts toward more advanced trading approaches with defined risk parameters.

    The contracts will be cleared through the Options Clearing Corporation, which oversees the settlement process. Cboe stated that these contracts will operate under the same regulatory framework governing other options listed in the United States.

    Charles Schwab’s Perspective

    James Kostulias, Head of Trading Services at Charles Schwab, commented on the development, stating, “We support approaches that bring transparency, defined risk, and investor education to financial-related prediction markets. We plan to offer clients access to these binary options contracts in the coming months, building on our existing platform and demand from active traders.”

    This announcement follows remarks from Charles Schwab CEO Rick Wurster in December, who expressed skepticism regarding prediction markets. At the time, Wurster suggested that event contracts tied to sports or entertainment could blur the lines between investing and gambling, adding that such markets were “not high on our list at the moment.”

    Charles Schwab has been actively diversifying its offerings. Earlier this year, the brokerage launched Schwab Crypto, enabling retail clients in most U.S. states to trade Bitcoin and Ethereum directly on the same platform alongside traditional investments.

  • Bitcoin Defends Support Amidst Faltering Bullish Momentum: Bitfinex Alpha

    Bitcoin Defends Support Amidst Faltering Bullish Momentum: Bitfinex Alpha

    Bitcoin Holds Key Price Floor Despite Weak Bullish Signals

    Over the past week, Bitcoin (BTC) has navigated a trading range between $62,000 and $72,000. Despite the absence of definitive bullish conditions, the leading digital asset has managed to maintain its price floor.

    Analysts at the cryptocurrency exchange Bitfinex, in their latest Bitfinex Alpha report, highlighted that the current crypto market environment is undergoing a significant shift, influenced by evolving expectations of the Federal Reserve and persistent inflation risks. These factors have collectively exerted near-term pressure on risk assets such as gold and Bitcoin; however, Bitcoin’s support level has remained steadfast.

    On-chain data suggests a stalemate between bullish and bearish forces, with neither side firmly in control. As BTC trades within the $62,500 to $72,000 consolidation zone, the market appears to be in a state of indecision rather than a sustained downturn.

    Bitfinex analysts identified two potential bullish tests that could have signaled a sustained uptrend on lower timeframes, but both ultimately failed. These tests included a consistent bid from the spot exchange-traded fund (ETF) market and a stabilization in the derivatives market, with funding rates moving from neutral to negative.

    In light of these failed tests, two opposing forces are currently influencing market sentiment regarding inflation. One is the potential for easing energy risks, possibly stemming from a peace agreement between the U.S. and Iran. The other is the Federal Reserve’s continued focus on inflationary pressures, rather than the immediate relief seen in crude oil prices.

    For Bitcoin to continue holding its current price floor, experts suggest the Federal Reserve must demonstrate restraint. The market’s trajectory remains uncertain until such clarity emerges.

    The analysts further elaborated that Bitcoin ETFs currently serve as the primary indicator of the market’s indecisiveness. These products have been unable to establish a bullish trend and have instead seen a reversion to net redemptions. While the total trading volume across ETFs has decreased significantly, it has not yet fallen to levels that would strongly support a bearish outlook. Consequently, ETFs are also in a state of limbo, not indicative of a bear market.

    From a structural perspective, Bitcoin is currently trading below the cost basis of active investors. The $68,500 to $72,000 zone is identified as the primary overhead supply band. Analysts anticipate further price compression within the $62,000 to $64,000 range, or potentially broader fluctuations between $60,000 and $70,000 in the coming days.

    As the market eventually leans towards either bullish or bearish sentiment, the $68,500 to $72,000 range is expected to act as significant resistance. Many investors within this range are currently at a loss and are likely to sell to break even. Therefore, Bitcoin now faces three key price levels: the foundational floor at $54,000, the $72,000 break-even point for recent buyers, and the $77,200 hurdle for short-term holders.

  • XRP: Quiet Price, Loud Growth

    XRP: Quiet Price, Loud Growth

    XRP Price Consolidates Amidst Market Headwinds, Analysts Eye Key Support Levels

    XRP is currently navigating a challenging period, trading around the $1.10 mark and experiencing a roughly 3% decline today. Despite the price dip, the digital asset is maintaining a significant daily trading volume of $1.5 billion, a figure that suggests underlying activity remains robust even as the price falters.

    Sustained Volume Hints at Enduring Interest

    Data from Coinglass, highlighted by analysts this week, counters concerns about XRP’s diminishing relevance. Over the past seven days, XRP has seen nearly $17 billion in trading volume, even as its price fell by more than 11%. This sustained high volume is a notable indicator, as assets that are genuinely losing traction typically do not maintain such participation levels. The attention appears to be present, but current market conditions are preventing buyers from aggressively pursuing it.

    Macroeconomic Factors Contribute to Cautious Sentiment

    Broader macroeconomic pressures are also impacting XRP’s performance. Nasdaq futures saw a decline of approximately 2.5% amid a global selloff in chip stocks, contributing to a general sense of caution in risk appetite. This wider market context suggests that XRP’s current consolidation phase may be less a sign of fundamental weakness and more a reflection of a market-wide pause.

    Technical Outlook: Key Levels to Watch

    XRP’s price is currently fluctuating within the $1.10 to $1.15 range, a zone that traders are observing as a short-term pivot point. The weekly chart indicates a near-term downside bias in XRP’s momentum. While the consistent daily volume, averaging around $3 billion, suggests the absence of a liquidity vacuum, volume alone is insufficient to reverse an established trend.

    The critical level to monitor is the psychological support at $1.00. This represents a significant line in the sand below the current price. Should this level break, a deeper structural floor exists in the $0.90 to $0.95 region. On the upside, the $1.20 to $1.25 range presents the first meaningful resistance cluster. A reclaim of this zone on increased volume would serve as the clearest short-term bullish signal.

    Potential Catalysts and Future Scenarios

    An XRP ETF, if it maintains its inflows, could potentially trigger a volume-backed breakout above $1.25, paving the way toward the $1.50 to $2.00 range. Conversely, a sustained close below $1.00 accompanied by elevated selling volume would significantly shift the technical structure to a more bearish outlook, bringing $0.90 into play and invalidating the “quiet accumulation” thesis.

    The narrative surrounding an XRP ETF and ongoing regulatory developments concerning Ripple remain the primary catalysts influencing price action. The pattern of price cooling while underlying infrastructure continues to build is a recognizable phenomenon in the market.

    Market Cap and Shifting Investor Focus

    XRP’s ability to maintain a $69 billion market cap during an 11% weekly drawdown points to genuine staying power. However, this substantial market capitalization also means that the window for asymmetric upside potential is narrower compared to two years ago. Investors seeking outsized early-stage exposure are increasingly directing their attention to assets with lower market caps.

    LiquidChain Emerges as a Layer 3 Infrastructure Solution

    LiquidChain ($LIQUID), a Layer 3 infrastructure project, is addressing the structural problem of liquidity fragmentation across major blockchain networks such as Bitcoin, Ethereum, and Solana.

    The project’s Unified Liquidity Layer aims to integrate the BTC, ETH, and SOL ecosystems into a single execution environment, allowing developers to deploy applications once and access all three networks. Core architectural features include Single-Step Execution and Verifiable Settlement, presented as established functionalities rather than future roadmap promises.

    The LiquidChain presale is currently priced at $0.01472, having raised $860,000 to date.

  • DeXe Surges 50% Amid Crypto Slump: What’s Next?

    DeXe Surges 50% Amid Crypto Slump: What’s Next?

    The cryptocurrency market has experienced significant volatility recently, with the past 24 hours marked by another substantial correction. Bitcoin (BTC) briefly dipped below $62,000, and many altcoins also saw their values decline.

    However, DeXe (DEXE) bucked the bearish trend, surging by double digits over the last day. While some analysts foresee continued short-term gains, a key technical indicator suggests a pullback may be imminent.

    The lesser-known altcoin is currently trading around $23, according to CoinGecko, representing a remarkable 50% increase from its value yesterday. Its market capitalization has now surpassed the $1 billion mark, positioning DEXE as the 65th-largest cryptocurrency.

    Potential Catalysts for the Rally

    A significant factor contributing to DeXe’s surge appears to be the support from MEXC. The prominent cryptocurrency exchange has integrated DEXE into its futures trading platform, offering leverage of up to 50x.

    Analyst Perspectives on DEXE’s Trajectory

    One analyst, known as “The Boss” on X, commented that DEXE “is showing one of the strongest structures” among altcoins, highlighting buyers’ swift response to any pullbacks. This observer noted the $24 resistance level, suggesting that if bulls can convert this into support, the uptrend could extend to $39. DeXe has been available since late 2020 and reached an all-time high of nearly $30 the following year, meaning such an increase would set a new historic record.

    Another analyst, OxNeena, also weighed in, stating that DEXE is breaking out of a bullish Cup & Handle formation, which could propel its price above $27 in the near future.

    Counterarguments and Warning Signs

    In contrast to the prevailing optimism, some market participants anticipate an upcoming correction. Crypto with Haris ₿, for example, has initiated a $40,000 short position on DEXE, identifying the $22.80-$23.30 range as “very important.”

    “If buyers were still fully in control, price should have already reclaimed the recent highs. Instead, DEXE is struggling below resistance while volume is cooling down. That usually happens when a trend starts losing strength,” the analyst explained. They further predicted that a drop below $22 could send the price as low as $18.

    DeXe’s Relative Strength Index (RSI) also presents a potential warning. Its ratio has climbed to 87, indicating that the coin has entered extremely overbought territory and may be due for a correction. The RSI scale ranges from 0 to 100, with readings below 30 typically considered a buying opportunity.

  • XRP Price Poised for Surge Past $8, But Key Zone Remains Resistance

    XRP Price Poised for Surge Past $8, But Key Zone Remains Resistance

    Ripple (XRP) has seen its value plummet by nearly 10% over the past week, thwarting multiple attempts at recovery. The cryptocurrency is currently trading around $1.11, following a 2% dip on Tuesday.

    Potential for Significant Gains

    Despite the recent downturn, a market analysis by crypto analyst EGRAG CRYPTO suggests that XRP could surge to between $5.70 and $8 if historical price patterns surrounding a key technical level hold true.

    EGRAG CRYPTO highlighted that XRP’s “Central Line” has historically served as a dividing point between periods of accumulation and significant price expansion. The analyst noted that the token has experienced substantial gains in previous market cycles after breaking above this level, leading to the identification of two potential upside targets for the current cycle.

    According to the analyst’s chart, XRP is presently trading below the Central Line, which is positioned above the asset’s current market price and is projected to move into the approximately $2.20-$2.60 range over time. These projected targets are based on historical percentage gains above this level, rather than XRP’s current trading price.

    EGRAG CRYPTO detailed that in one past cycle, XRP surged approximately 330% above the Central Line, while another saw gains of around 200%. An average of these movements suggests a potential expansion of roughly 265% above the Central Line, which the analyst estimates could place the asset near the $8 mark.

    The analyst also presented a more conservative outlook, where XRP achieves only a portion of the gains seen in prior cycles. In this scenario, if the market delivers approximately 60% of the strength observed in the previous cycle, it would translate to an increase of about 120% above the Central Line, setting a target near $5.70.

    Based on these calculations, EGRAG CRYPTO has identified $5.70 as the conservative target and $8 as the objective based on average historical cycle performance. These projections are rooted in historical price expansions above the Central Line, independent of current market sentiment.

    The analyst cautioned that XRP remains below the Central Line, indicating it is still trading within an “uncomfortable zone.”

    Easing Selling Pressure and Shifting Exchange Activity

    Meanwhile, separate data from CryptoQuant indicates a potential easing of selling pressure on XRP, as large holders appear to be reducing transfers to Binance. Whale activity on the exchange has decreased in recent weeks, suggesting a reduction in short-term selling. However, XRP continues to trade below the McGinley Dynamic indicator, signaling weak overall momentum. A reclaim of this level is deemed necessary to support a stronger recovery, with the $1.08 area remaining a crucial support zone.

    Concurrently, XRP activity has shown a notable shift towards South Korea’s Upbit exchange. Data reveals that Upbit’s net wallet-flow dominance surged from 13% on June 8 to 37% by June 22, marking its highest level in over a year.

    During the same period, Binance’s reading dropped from 16% to zero, while Crypto.com also fell to zero, and Coinbase remained around 9%. Just two weeks prior, Binance had slightly outperformed Upbit, but the latest figures indicate a growing concentration of XRP deposits on the South Korean platform. This metric tracks whether deposits exceed withdrawals on individual exchanges, rather than total XRP holdings.

  • XRP Faces Deeper Drop as $1.07 Support Falters

    XRP Faces Deeper Drop as $1.07 Support Falters

    XRP Faces Renewed Pressure as Key Support Level Tested

    XRP’s recovery attempt last week has faltered, with sellers reasserting control near a significant resistance zone. This has pushed the cryptocurrency back towards a crucial support area, which is now shaping the short-term trend.

    Daily Chart Analysis

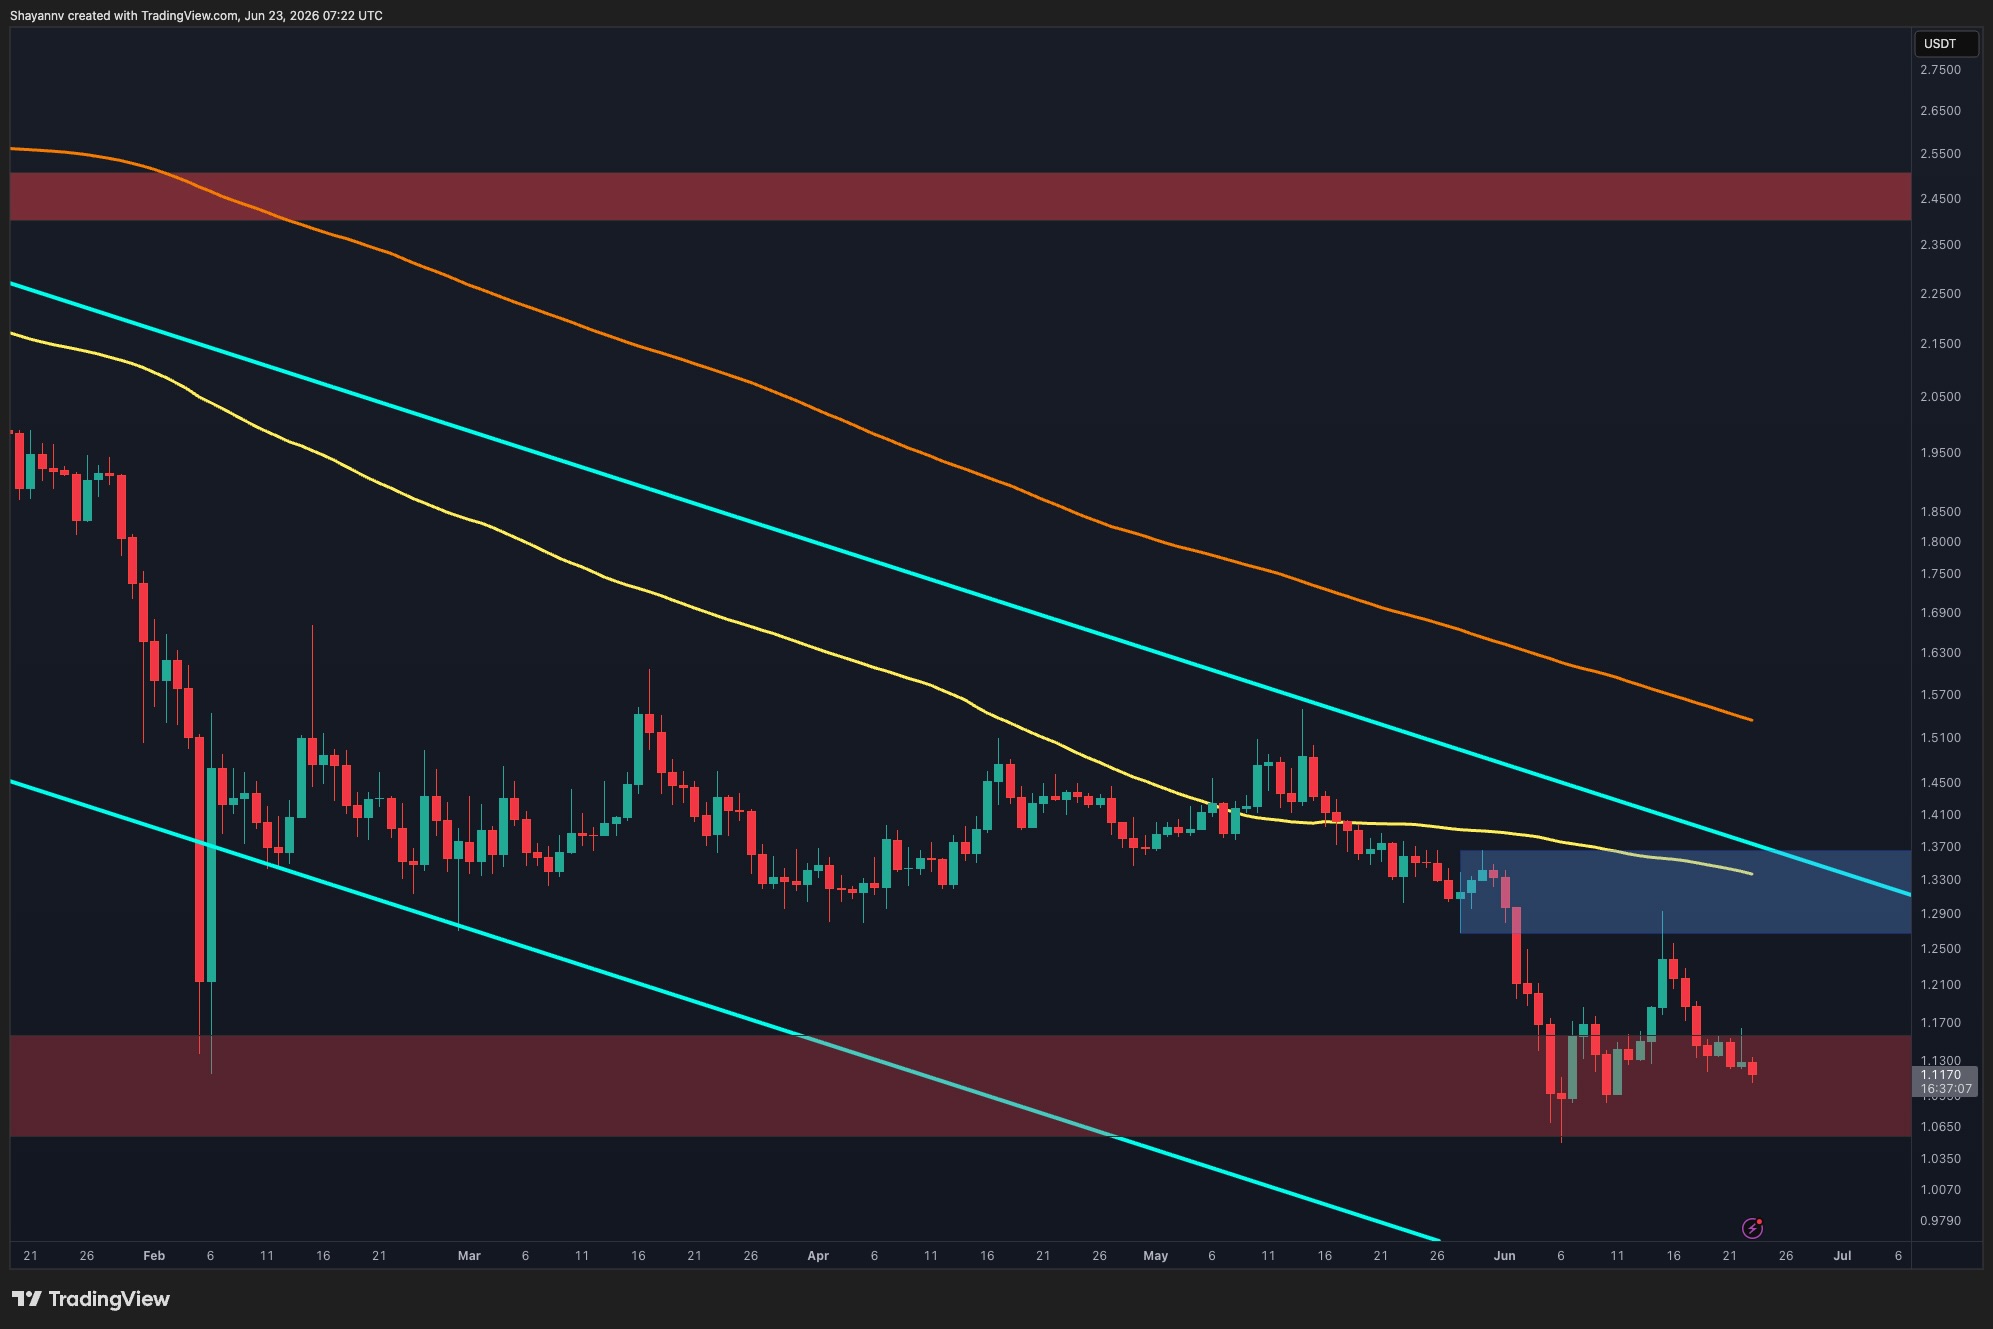
    On the daily chart, XRP continues to trade within a broad descending channel, remaining below both its 100-day and 200-day moving averages. A recent rebound stalled just below the 100-day moving average and the lower end of a key resistance zone, estimated between $1.28 and $1.35. This failure to break higher reinforces the bearish structure observed on higher timeframes.

    The most recent price action saw XRP rejected from this resistance area, leading to a subsequent decline back towards the demand zone between $1.07 and $1.15. This support region has proven attractive to buyers throughout June and remains the most critical level on the chart.

    As long as XRP can maintain its position above this zone, the market may continue to consolidate within its current trading range. However, a decisive breach below $1.07 would expose the previous swing low and significantly increase the likelihood of a further downward movement.

    For any meaningful trend reversal to be considered, buyers must first reclaim the resistance area between $1.28 and $1.35.

    Short-Term Momentum Deteriorates

    The 4-hour chart reveals a clear weakening of short-term momentum. After failing to surpass the ascending resistance trendline and the supply zone between $1.26 and $1.3, XRP reversed course, erasing most of its recent gains.

    Notably, the latest rebound from the support zone resulted in another lower high near $1.25 before sellers took charge. Since then, the price has drifted back towards the $1.1 support region and is currently trading near the lower boundary of this range.

    Current price action suggests diminishing buying pressure, with XRP struggling to generate any substantial bounce despite being positioned on support. This places increased focus on the $1.07 to $1.15 demand zone.

    Should buyers successfully defend this area, a recovery towards $1.2 and subsequently $1.26 remains a possibility. Conversely, a breakdown below support would invalidate the recent consolidation pattern and could trigger a more significant price decline.

    Outlook Remains Cautious

    Overall, the short-term outlook for XRP has become increasingly defensive. The cryptocurrency remains capped by key resistance levels while repeatedly testing support, making the $1.07 to $1.15 region the pivotal level likely to dictate the next directional move.

  • Crypto Sees $8B Institutional Outflow in 30 Days

    Crypto Sees $8B Institutional Outflow in 30 Days

    Institutional Outflows Hit Record $8 Billion as Crypto Market Cools

    New analysis reveals a significant reversal in institutional investment, with a record $8 billion exiting crypto assets in the past 30 days. The trend, encompassing spot Bitcoin ETFs, stablecoins, and major corporate holders, signals a shift towards capital preservation ahead of the summer.

    According to research published by BIT on June 22, combined institutional flows across spot Bitcoin exchange-traded funds (ETFs), stablecoins, and Strategy, the world’s largest corporate holder of Bitcoin, have swung to a record net outflow of $8 billion over the last month. This marks a substantial reversal from previous periods, moving beyond a mere slowdown to outright negative flows, prompting warnings that a significant catalyst may be needed to reignite buying interest.

    BIT noted in a June 22 post on X that institutions are actively reducing their exposure to cryptocurrencies as summer approaches. Data from SoSoValue corroborates this trend, showing that Bitcoin-tracking funds experienced net outflows of $2.43 billion in May and have already seen $2.26 billion depart in June, with over a week remaining in the month. These products have now been in the red for six consecutive weeks, though last week’s outflow of nearly $227 million represented an improvement from the preceding two weeks, which saw outflows of $1.72 billion and $316 million, respectively.

    On-chain stablecoin data from CryptoQuant further supports BIT’s findings. All-exchange stablecoin reserves currently stand at $63.3 billion, with a 24-hour net flow of -$103.7 million. A negative net flow indicates that more stablecoins are being withdrawn from exchanges than deposited, suggesting a decrease in available buying power.

    Markus Thielen, the analyst who authored the market brief, highlighted the significance of this reversal. While flows did decrease in the fourth quarter of 2025, he pointed out that at that time, they merely stalled rather than reversing. This distinction, Thielen argues, is crucial for interpreting the current price drop.

    “This suggests the move from $82,000 to $62,000 could prove more consequential than the earlier decline from $102,000 to $82,000,” he wrote.

    Thielen’s assessment concludes that without a dovish shift from the Federal Reserve or another clear catalyst, near-term buying activity is likely to remain subdued. However, he noted that selling volatility might still present opportunities, even if “upside appears limited.”

    In related developments, Strategy’s stock (STRC) experienced a significant sell-off last week, reportedly driven by leveraged traders, pushing its price as low as $82.50. Despite the company recently acquiring an additional 1,587 BTC for $100 million, popular analyst Kaleo has cautioned that Strategy could be compelled to sell as much as 50,000 BTC over the next two years.

    Over the weekend, Bitcoin saw a modest rise from around $63,000 to just above $64,000, according to CoinGecko data. By early Monday morning, the cryptocurrency had dipped back near the $63,000 level. However, at the time of writing, it had recovered these losses and surpassed $65,000, marking a modest 2% gain over two weeks despite the substantial outflows.

    If BIT’s analysis proves accurate, the market may be entering a phase where institutions prioritize capital preservation over increased exposure, suggesting that caution could define the market landscape in the second half of the year.

  • Gemini AI Forecasts Massive Solana Surge by 2026

    Gemini AI Forecasts Massive Solana Surge by 2026

    Gemini AI Forecasts Significant Solana Surge by Late 2026

    Google’s Gemini AI has generated a price target for Solana that warrants serious attention, projecting a breakout range of $250 to $320 by late 2026. Such an ascent would represent more than a threefold increase from Solana’s current trading price.

    The optimistic outlook hinges primarily on Solana’s underlying architecture. Currently trading around $74, the AI’s bullish thesis centers on the network’s monolithic design and its capacity to handle substantial high-frequency trading volumes from both retail and institutional investors.

    Solana’s renowned speed has always been its key differentiator, and Gemini AI views this as the bedrock of its potential. A crucial catalyst identified by the model is the approval of a spot ETF, which could unlock significant institutional capital inflows.

    Combined with Solana’s established presence in decentralized physical infrastructure networks, this scenario suggests a path where the network leverages and amplifies its existing strengths rather than relying on entirely new developments. If these factors align, Gemini AI sees a realistic trajectory toward the projected $250 to $320 price zone.

    The Bearish Outlook and Technical Indicators

    Conversely, the bearish case for Solana is rooted in challenges the network has previously encountered. A tightening of global liquidity could disproportionately impact higher-beta assets like Solana.

    Persistent network congestion remains another significant risk, as past slowdowns have prompted developers and users to migrate to Layer 2 competitors. If both these pressures materialize simultaneously, Gemini AI anticipates Solana could become trapped in a structural accumulation range between $45 and $60, hindering any breakout potential.

    On the technical front, Solana is currently trading around $73.99, having experienced a considerable decline from its summer highs above $250. This extended downtrend has seen limited significant rebounds.

    Recently, the price formed a double bottom near $60 before recovering above $70, signaling a potential resurgence of buyer interest. Immediate resistance is observed near $90, followed by a more substantial barrier around $100, where previous rallies faltered earlier this year. Support remains firm at $60, with the recent low serving as a critical level. The Relative Strength Index (RSI) stands at 51.53, with its signal line at 41.70, indicating that momentum has surpassed its average for the first time in a while. This divergence suggests building buying pressure that may precede a genuine breakout attempt.

    Overall, Solana’s momentum appears to have shifted from negative to cautiously positive. A sustained break above $90 could position Solana for a genuine multi-month ascent toward the $250 target, transforming it from a mere numerical projection into a tangible possibility.

    The Shifting Landscape of Crypto Investment

    The current market dynamics suggest that established large-cap cryptocurrencies are not facing fundamental trouble but rather a temporary plateau. Bitcoin, Ethereum, and XRP have been testing similar resistance levels for weeks without significant breakthroughs.

    The reliance on future macro catalysts and institutional decisions for the next phase of growth for these assets can be viewed as a passive waiting game rather than an active investment strategy. The capital that drives market cycles often moves preemptively, before the ultimate destination becomes widely apparent.

    Smaller market cap infrastructure projects, operating on different principles, possess the ability to achieve significant revaluations from capital flows that would be negligible for larger assets. The opportunity lies in the discrepancy between a project’s intrinsic value and its current market valuation, a gap that closes rapidly upon market discovery.

    Addressing DeFi’s Interoperability Challenge

    The fragmentation across multiple blockchain networks presents a persistent and costly problem in decentralized finance (DeFi). Bitcoin, Ethereum, and Solana currently operate as isolated ecosystems, lacking native interoperability. Every transfer of value between these networks incurs costs through fees, slippage, and failed transactions.

    LiquidChain aims to resolve this issue by enabling free cross-chain transfers, as predicted by Perplexity AI. It proposes a unified execution environment for these three networks, allowing for single deployments and complete ecosystem access without transaction taxes.

    The LiquidChain presale is currently priced at $0.01454, having raised over $840,000, positioning it as an early-stage, undiscovered opportunity. While its execution and adoption remain unproven, established assets offer predictability within known market ceilings. LiquidChain represents an entry point that may cease to exist once it gains broader market recognition.

  • Grok AI Forecasts Major XRP Surge by 2026

    Grok AI Forecasts Major XRP Surge by 2026

    Grok AI Forecasts Significant XRP Price Surge by 2026

    Grok AI, Elon Musk’s artificial intelligence model, has issued a prediction for XRP’s price that initially appears audacious but gains credibility upon closer examination. The model forecasts XRP reaching between $5 and $8 by the end of 2026, a substantial increase from its current trading levels.

    The bullish outlook for XRP is supported by a confluence of factors, exceeding the typical catalysts seen in a full market cycle for most cryptocurrencies. XRP is currently trading around $1.14, amidst the presence of multiple spot ETFs already active in the market.

    Furthermore, the U.S. Securities and Exchange Commission (SEC) has dropped its appeal, effectively ending a significant legal challenge. The proposed CLARITY Act is also navigating key Senate hurdles, promising to alleviate considerable regulatory uncertainty that has long hampered XRP’s progress.

    Ripple, the company behind XRP, is actively pursuing a national trust bank charter. This initiative, if successful, would position the company with a stronger institutional foundation than nearly any other crypto issuer.

    On the operational front, On-Demand Liquidity (ODL) volumes are experiencing robust growth as cross-border payment systems increasingly rely on XRP. The adoption of RLUSD is also accelerating, with the XRP Ledger recording over $1.9 billion in net real-world asset inflows.

    When these elements are considered collectively, XRP emerges as a digital asset with tangible utility, now bolstered by a clearer regulatory landscape. Standard Chartered has even developed an $8 billion valuation case for XRP, predicated on an assumption of $4 to $8 billion in ETF inflows. While this is a significant assumption, it is not entirely implausible given the rapid expansion of the ETF market this year.

    Bearish Outlook and Technical Analysis

    The bearish perspective offers a more conservative outlook. Potential delays in legislative progress or a broader market downturn could limit XRP’s ascent to a range between $2.50 and $3.50.

    There is also a possibility that XRP’s price could briefly retrace to test support levels between $0.90 and $1.00 before a substantial breakout occurs. Even with this potential downside, the risk-reward profile from current levels still heavily favors bullish sentiment.

    Technical analysis of the daily chart reveals XRP consolidating near $1.1468. This follows a prolonged decline from highs exceeding $3.60, which were established in mid-2025. The downward trend appears to have formed a textbook descending channel, characterized by a series of lower highs and lower lows over nearly a year.

    XRP recently touched the lower boundary of this channel near $1.00 and is now encountering resistance just above $1.20. A decisive break above this level could pave the way for a move towards $1.40, followed by the $1.60 zone, an area that has seen multiple rejections earlier this year.

    Immediate support is located at $1.00, with a deeper support level at $0.90 should sellers regain control. The Relative Strength Index (RSI) stands at 42.53, with a signal line at 39.95, indicating a slight positive shift in momentum after months below the midline. This narrow gap above the signal line suggests nascent buying pressure, though it does not yet confirm a sustained reversal.

    Overall momentum appears to be stabilizing rather than accelerating. If XRP can maintain its current base and reclaim the channel resistance, the dramatic price appreciation predicted by Grok AI becomes more plausible.

    The Rotation to Undiscovered Opportunities

    There comes a point in every market cycle when investor focus shifts away from established assets. Large-cap cryptocurrencies do not typically decline all at once; their growth gradually decelerates, returns compress, and they face persistent resistance at key levels. While the underlying narratives may remain intact, price action ceases to respond. Bitcoin, Ethereum, and XRP are currently in this phase, with XRP having been poised for its next significant move for an extended period.

    When this occurs, capital does not remain idle; it seeks out the next promising opportunity. These emerging opportunities rarely appear fully formed when the rotation begins. They often manifest as early-stage presales, modest fundraising rounds, or projects with unproven teams addressing acknowledged industry problems that have yet to be solved. This combination is frequently overlooked until its significance becomes undeniable.

    Cross-chain liquidity represents such a problem. Bitcoin, Ethereum, and Solana are dominant ecosystems with entirely separate liquidity systems. The absence of native interoperability forces users and developers operating across these networks to incur costs in the form of fees, slippage, failed transactions, and wasted time. This fragmentation is a fundamental limitation inherent in the original design of these networks.

    LiquidChain is developing a foundational layer designed to render this problem obsolete. It aims to create a single execution environment that connects all three major ecosystems simultaneously. This would enable developers to deploy applications once and reach users across all networks without incurring cross-chain taxes on every interaction.

    The LiquidChain presale is currently priced at $0.01454, with over $800,000 raised to date. The market has yet to fully recognize this opportunity, but that is expected to change.

    The risk profile at this stage is typical for early-stage projects. Adoption, liquidity, and execution remain unproven. This is not a disclaimer but rather the inherent nature of investing in nascent technologies. The projects that deliver 10x or 100x returns are not those that appear safe at the outset, but rather those that solve a critical problem before the broader market fully comprehends it. LiquidChain is currently within that window of opportunity.