Tag: Market Trends

  • Bitcoin’s July Outlook Hinges on Key Factors

    Bitcoin’s July Outlook Hinges on Key Factors

    Bitcoin Faces Steep June Decline, July Recovery Hinges on Key Market Shifts

    As June draws to a close, Bitcoin appears poised for a significant monthly loss, with current data indicating an 18% drop. On-chain metrics reveal several critical factors contributing to this downturn and highlight what needs to change for a stronger performance in July.

    Stalled Accumulation and Declining Demand

    Popular analyst Ali Martinez pointed out in a recent X post that Bitcoin accumulation levels have stagnated for the past seven months. “Bitcoin apparent demand has remained negative for 208 consecutive days, recently dropping to a new low of -273,000 BTC,” Martinez stated.

    This metric, which compares new Bitcoin creation to the movement of existing supply, signifies a fall in real spot market demand. The trend shifted following a substantial liquidation event in early October, which saw over $19 billion erased in a single day. From November 9, 2025, to May 31, 2026, demand “hovered quietly in negative territory between 0 and -150,000 BTC, indicating a mild but steady distribution of supply,” Martinez noted. However, the metric plummeted to -273,000 BTC after significant price drops in early and late June and has since “flatlined around this level.”

    The prolonged negative trend suggests that a considerable amount of older Bitcoin is entering the market faster than the spot market can absorb it. This divergence indicates that selling pressure is consistently outweighing new capital inflows, a crucial factor that must reverse for Bitcoin to experience a more robust July.

    Weakening US Investor Demand

    Martinez also highlighted another metric indicating a lack of broad demand for Bitcoin, with demand primarily originating from US investors. The Coinbase Premium has been deeply negative for nearly two months, entering negative territory after Bitcoin’s peak above $82,000 in mid-May and remaining there.

    US institutional demand is a significant driver of Bitcoin’s price movements and represents the second key factor that needs to improve in July.

    Spot ETF Outflows Continue

    In line with these developments, spot Bitcoin ETFs have experienced substantial outflows for weeks. The past week saw consistent daily declines, with investors pulling nearly $700 million from these funds on Thursday, the same day Bitcoin dropped to $58,000 for the first time in almost two years.

    Lacie Zhang, a Research Analyst at Bitget Wallet, told CryptoPotato that ETF outflows need to stabilize. She added that market volatility is expected to normalize following a significant $11 billion options expiry event on June 26.

    “If redemptions resume and post-expiry positioning remains defensive, the market may stay choppy around current levels,” Zhang concluded. “The key point is that Bitcoin’s July direction may be shaped less by last week’s PCE print and more by how flows, leverage, and on-chain accumulation behave in the 72 hours after expiry settles.”


  • Solana Surges Past $70, Bitcoin Battles $60K: Weekend Outlook

    Solana Surges Past $70, Bitcoin Battles $60K: Weekend Outlook

    Bitcoin’s price has been volatile around the $60,000 mark, but the cryptocurrency managed to climb above this level by Saturday morning.

    Altcoins Show Modest Gains

    Most larger-cap altcoins are trading slightly higher. XRP has surpassed $1.05, and Ethereum is hovering near $1,600. Solana (SOL) has seen the most significant gains among this group.

    Bitcoin’s Rollercoaster Week

    The trading week began positively for Bitcoin, with the cryptocurrency rebounding from a weekend slump to reach $62,500 and touching $65,500 on Monday. However, this recovery was short-lived as bearish sentiment quickly took hold, halting further progress.

    In the subsequent hours, Bitcoin fell to $62,000. It then bounced to $63,000, but a subsequent downturn proved more severe. Bitcoin dropped below $60,000 for the second time this month, reaching a low of $59,000. After another brief recovery to nearly $62,000, the asset experienced a sharper decline on Thursday, falling to $58,000 – a level not seen since late 2024.

    Market Influences and Recovery

    This latest downward trend appeared to be influenced by negative price movements in MicroStrategy’s stock (MSTR), which also hit a multi-year low below $80. Despite these pressures and ongoing geopolitical tensions in the Middle East, Bitcoin has managed to recover some ground from its recent low and is now trading just above $60,000.

    Bitcoin’s market capitalization has risen to $1.210 trillion, with its dominance over altcoins remaining below 56%.

    Ethereum and XRP Reclaim Levels

    Ethereum is gradually recovering from a recent low of $1,510 and is now trading close to $1,600 after a minor daily increase. XRP has reclaimed the $1.05 support level, marking a 2% gain since yesterday. Solana’s SOL has emerged as the top performer among larger-cap altcoins today, trading above $72.

    Other Notable Gains and Losses

    More substantial gains have been observed in AAVE, AVAX, and MORPHO. Aave’s token has seen double-digit growth, now trading above $95, while AVAX is priced above $6.6. MORPHO has approached $1.80 following a 7% increase.

    In contrast, MemeCore has continued its decline, shedding another 20% of its value and currently trading below $0.70.

    The total cryptocurrency market capitalization has recovered over $80 billion since Thursday’s low, reaching $2.170 trillion.

  • XRP’s Sub-$1.00 Drop Creates ‘Risk-Reward’ Opportunity: Analyst

    XRP’s Sub-$1.00 Drop Creates ‘Risk-Reward’ Opportunity: Analyst

    XRP is currently trading near the $1.00 mark, reflecting a decline of approximately 9% over the past seven days and a more substantial 52% drop over the last year.

    Potential for Enhanced Risk-Reward

    Despite the downturn, UK-based technical analyst ChartNerd suggests that the further the Ripple token falls from its current position, the more attractive the risk-reward setup becomes. He identifies a potential demand zone between $0.90 and $0.70 should the $1.00 level fail to hold.

    ChartNerd has been monitoring this scenario since at least June 12, when he outlined the broader market picture in a series of posts. He noted that XRP spent much of 2023 and extending into late 2024 trading below a resistance level of $0.80/$0.70, which acted as a ceiling until a breakout occurred in the fourth quarter of 2024.

    This breakout, according to ChartNerd, was instrumental in propelling XRP to its all-time high of $3.65 in July 2025. Since then, the trend has reversed, with key moving averages being lost and a weekly 20/50 Exponential Moving Average (EMA) death cross signaling a structural shift. The asset has since fallen from its January 2026 peak of $2.40 to its current trading levels.

    Revisiting Key Levels

    Earlier this year, in February, XRP reached a low of $1.12. Following this, it attempted a recovery, consolidating sideways before being rejected near $1.55. ChartNerd’s analysis indicates that this rejection initiated the current downward trend, bringing XRP to lows around $1.00 in June. This level falls within what the market observer terms his “area of interest,” a zone he has been watching for a potential cycle bottom between now and the fourth quarter of 2026.

    The significance of this zone, in his view, lies in the potential for the former resistance level from 2023 and 2024 to transform into support. If XRP can hold within the $0.90 to $0.70 range during any further market declines, the previous ceiling could indeed become a floor.

    “This is a high-interest support region, but confirmation still matters most, and we do not have it yet,” ChartNerd stated previously.

    Currently, the analyst believes XRP’s ongoing decline is pushing it deeper into this area of interest, and the more it falls, “the stronger the risk-reward setup becomes.” He also highlighted his observation of the 10-year Gaussian Channel, which XRP is now entering, noting its historical reliability as a guardrail throughout his tracking period.

    Timing and On-Chain Data

    Regarding the timing of a potential market reversal, ChartNerd indicated in a separate post that there is a “very strong likelihood” of a bounce occurring in the coming weeks as June concludes. This aligns with historical Bitcoin performance in midterm years. However, he cautioned that this might be a relief rally, potentially preceding a final downturn in the last quarter of the year.

    In parallel, analyst Ali Martinez pointed out that XRP is currently testing a significant volume block at $1.06, where on-chain data reveals over 830 million tokens have traded hands. Below this level, the next crucial clusters identified by the UTXO Realized Price Distribution are situated at $0.80, $0.62, and $0.51.

    Meanwhile, another market observer, CasiTrades, commented that XRP is at a “most critical moment” in its current cycle. He noted buy orders placed at $0.93 and a deeper Fibonacci level at $0.87, framing the prevailing fear as a natural component of bottom formation rather than a signal to sell.

  • Ethereum Plummets: $1,000 Crash Imminent?

    Ethereum Plummets: $1,000 Crash Imminent?

    Ethereum’s Price Plummets to 14-Month Low Amidst Bear Market and Internal Shake-ups

    Ethereum, the second-largest cryptocurrency by market capitalization, has experienced a significant downturn in recent months, mirroring the struggles of most major altcoins. The digital asset’s price has fallen to a 14-month low, prompting analysts to warn of a potential further slump, with some speculating a crash to a multi-year low of around $1,000.

    Internal Challenges Compound Market Pressures

    The prolonged bear market is not the sole factor contributing to Ethereum’s declining valuation. Recent internal developments have also cast a shadow. Hsiao-Wei Wang stepped down as the Ethereum Foundation’s co-executive director and board member, and shortly thereafter, the organization reduced its workforce by 20%.

    Market Cap Fluctuation and Recovery

    These negative developments contributed to a sharp decline in ETH’s price, which nosedived to just above $1,500. Its market capitalization briefly dipped below $183 billion, allowing Tether’s USDT to momentarily surpass Ethereum as the second-largest cryptocurrency. While ETH has since reclaimed its position, the lead is now marginal.

    Key Support and Resistance Levels Identified

    According to analyst Ali Martinez, Ethereum has been trading within a critical volume block between $1,584 and $1,683, where approximately 4 million coins have changed hands. Martinez suggests that establishing this “specific area” as support could pave the way for a rise to the next major supply clusters at $1,980 and $2,079.

    Conversely, the analyst cautioned that a failure to hold this baseline support, as occurred recently, could trigger a more substantial decline to $1,237 and potentially as low as $1,089.

    Divergent Analyst Outlooks

    Other market observers have offered varying predictions. X user Ryker anticipates a drop to $1,260 before a potential rally above $3,000. This forecast was highlighted by Merlijn The Trader, who noted that Ryker is the only individual on X followed by Binance CEO Changpeng Zhao (CZ).

    Earlier this month, X user Ted posited that ETH is more likely to reach its cycle bottom before Bitcoin (BTC). At that time, Ted claimed that much of the downside liquidity had been depleted, projecting a fall to the $1,300-$1,400 range. Similarly, Niels envisioned a drop to $1,200 within the current year.

    Whale Activity Signals Bearish Sentiment

    Recent activity from large investors, often referred to as “whales,” further reinforces the bearish outlook. X user Max Crypto reported that a significant investor initiated a $68 million short position on ETH with 23x leverage. Additionally, Justin Wu observed that four “OG” wallets have begun selling off their holdings.

    Whales are closely watched by retail investors due to their potential access to insider information that could influence market movements. Their actions can sometimes trigger panic selling among smaller participants.

  • Whales Move Millions to Binance Ahead of Banking News

    Whales Move Millions to Binance Ahead of Banking News

    Chainlink Tokens Flood Exchanges Ahead of Major Banking Initiative Announcement

    A significant surge in Chainlink (LINK) tokens being transferred to exchanges has been observed in the days leading up to the project’s announcement of a major banking initiative.

    On-chain data from the Ethereum network indicates that Binance saw a net inflow of over 10.2 million LINK tokens on June 19. This single-day transfer dramatically increased the exchange’s LINK reserves, pushing them from 84.1 million to 94.3 million tokens.

    CryptoQuant reported that this substantial movement caused the seven-day average netflow to spike by an astonishing 20,677% compared to its three-month average, signaling an unusual shift in exchange activity. The large-scale transfer occurred just days before Chainlink unveiled Project Pangea on June 23.

    Project Pangea is designed to facilitate T+0 foreign exchange settlement and involves more than 80 banks across Europe and South Korea, collectively managing over $10 trillion in assets. Historically, inflows of this magnitude have tended to increase the supply of tokens available for sale on exchanges, often correlating with heightened market volatility. However, LINK’s price response during this period was relatively muted, declining from approximately $8 to around $7.3.

    Further analysis revealed that these transfers were highly concentrated among a small cohort of large token holders. The “inflow_top10” metric, which tracks the top ten inflow sources, was nearly equivalent to the total inflow volume. This suggests that the majority of the tokens originated from a handful of wallets rather than widespread retail investor activity. CryptoQuant commented, “Although Project Pangea represents a potentially meaningful long-term development for the Chainlink ecosystem, the near-term on-chain picture points to increased exchange supply.”

    Despite the increased exchange supply, a growing number of users are opting to hold their LINK tokens amidst prevailing market uncertainty. Santiment data from earlier this month showed that the number of wallets holding at least 1 LINK has surpassed 535,000, reaching its highest point since December 2022. This increase in holder numbers has occurred even as LINK’s price remains significantly below its previous cycle highs.

    On the institutional front, spot LINK Exchange-Traded Funds (ETFs) experienced a return to positive net flows on June 23, following their first day of net outflows on June 22. On June 22, these funds recorded net outflows totaling $491,000. However, sentiment quickly improved, with inflows of approximately $138,000 returning on June 23. Activity then stabilized on June 24, with no net flows recorded.

    Despite these recent fluctuations, data from SoSoValue indicates that total spot LINK ETF inflows for June currently stand at $3.61 million.

  • Cardano Under Pressure, On-Chain Data Paints Different Picture

    Cardano Under Pressure, On-Chain Data Paints Different Picture

    Cardano Network Sees Surge in Activity Amidst Price Slump

    The Cardano network is experiencing a significant uptick in both user activity and online conversation, even as its native cryptocurrency, ADA, has dipped to lows not seen since December 2020.

    According to recent analysis by Santiment, daily active addresses and social dominance on the network have surged for the second time this month, positioning Cardano as one of the most talked-about assets in the cryptocurrency market.

    Data indicates that the number of active addresses on the network reached 29,025, with Cardano accounting for 0.33% of all cryptocurrency-related discussions. Santiment noted that this increase in activity is occurring concurrently with substantial price pressure and heightened volatility for ADA. The prevailing bearish sentiment appears to be influenced by recent remarks from Charles Hoskinson, who cautioned that additional Cardano projects might face failure.

    Further contributing to concerns are Hoskinson’s decision to scale back his public engagement and ongoing internal community disputes regarding treasury funding. Despite the prevailing weak sentiment, Santiment suggests that historical patterns show spikes in network activity, coupled with growing market apprehension, have often preceded modest rebounds in ADA’s price.

    Previous instances of this phenomenon include late March to early April, when active addresses rose to approximately 22,000 and social dominance exceeded 0.40%. Another similar period occurred in early June, with active addresses climbing to around 32,500 and social dominance peaking near 0.38%. In both these cases, the surge in network activity and discussion levels was followed by a moderate recovery in ADA’s price, the analysis revealed.

    As of this report, ADA is trading at $0.14, marking a decline of over 3% in the past 24 hours. The daily chart for the cryptocurrency recently generated a TD Sequential buy signal, which could potentially signal a short-term price rebound. However, crypto analyst Ali Martinez has advised traders to exercise caution, despite this bullish indicator.

    This warning follows a security incident involving a Cardano-based wallet protocol, which resulted in the theft of nearly 129 million ADA, valued at approximately $20 million.

    Martinez posited that any immediate recovery could prove to be a “bull trap,” luring buyers in before the price resumes its downward trend. Consequently, any potential relief rally is likely to encounter resistance in the $0.160 to $0.176 range. Should ADA fail to break above this resistance level, the price could descend further, potentially establishing new lows.

  • Kalshi Ignites FIFA World Cup Buzz with Record Trading Surge

    Kalshi Ignites FIFA World Cup Buzz with Record Trading Surge

    Prediction Markets Surge as World Cup Nears

    The world’s most anticipated sporting event is significantly boosting the profile of prediction markets, with a record volume of outstanding bets culminating in a high-profile deal announced Friday between Kalshi and an official partner of the World Cup 2026.

    ADI Predictstreet, a Gibraltar-licensed prediction market that unveiled a sponsorship deal with FIFA in April, announced it will collaborate with Kalshi as the competition heads into its knockout stage. Both brands are expected to be featured across stadiums, television broadcasts, and online advertisements.

    In a blog post published by Andreessen Horowitz, a Kalshi investor, the venture capital firm highlighted that weekly trading volumes across prediction markets reached $14.5 billion for the first time last week. Concurrently, the value of outstanding bets hit a record for the third consecutive week, totaling $1.6 billion.

    The data, compiled by Artemis—which includes Myriad, a prediction market owned by Decrypt’s parent company Dastan—underscores Kalshi’s leading position in sports wagers. Last week, Kalshi accounted for 62% of total trading volume, compared to Polymarket’s 28%.

    Both prediction market platforms have intensified their marketing efforts with advertisements aired during broadcasts. Polymarket features American rapper Future in its ads, while Kalshi showcases athletes such as Croatia’s Luka Modrić.

    The surge in interest has attracted numerous other companies eager to participate. DraftKings announced Friday in a press release the launch of its own prediction market, DKeX. The company indicated that its DraftKings Predictions product is anticipated to expand significantly next month, driven by heightened interest surrounding the World Cup.

    As more teams advance in the tournament, some emerging prediction markets are also experiencing substantial growth. Rothera, an exchange to which Robinhood began directing wagers in late May, has seen its weekly trading volumes skyrocket from $2.1 million to $805 million, according to Artemis.

    Analysts at asset manager Bernstein recently predicted that the World Cup could serve as a “watershed moment” for the prediction market sector, noting that platforms like Robinhood and Coinbase are leveraging the tournament to accelerate the growth of their respective offerings.

  • XRP Price Watch: Crash to $0.60 Looming as $1 Support Tested?

    XRP Price Watch: Crash to $0.60 Looming as $1 Support Tested?

    XRP Faces Persistent Selling Pressure, Testing Key Support Levels

    XRP continues to experience sustained selling pressure, with the broader market trend firmly favoring sellers. Analysis of the USDT chart indicates the cryptocurrency is on the verge of breaching a significant support area following another downward movement. Concurrently, the XRP/BTC pair has retreated towards a critical floor, underscoring the token’s ongoing weakness relative to Bitcoin.

    XRP/USDT Analysis

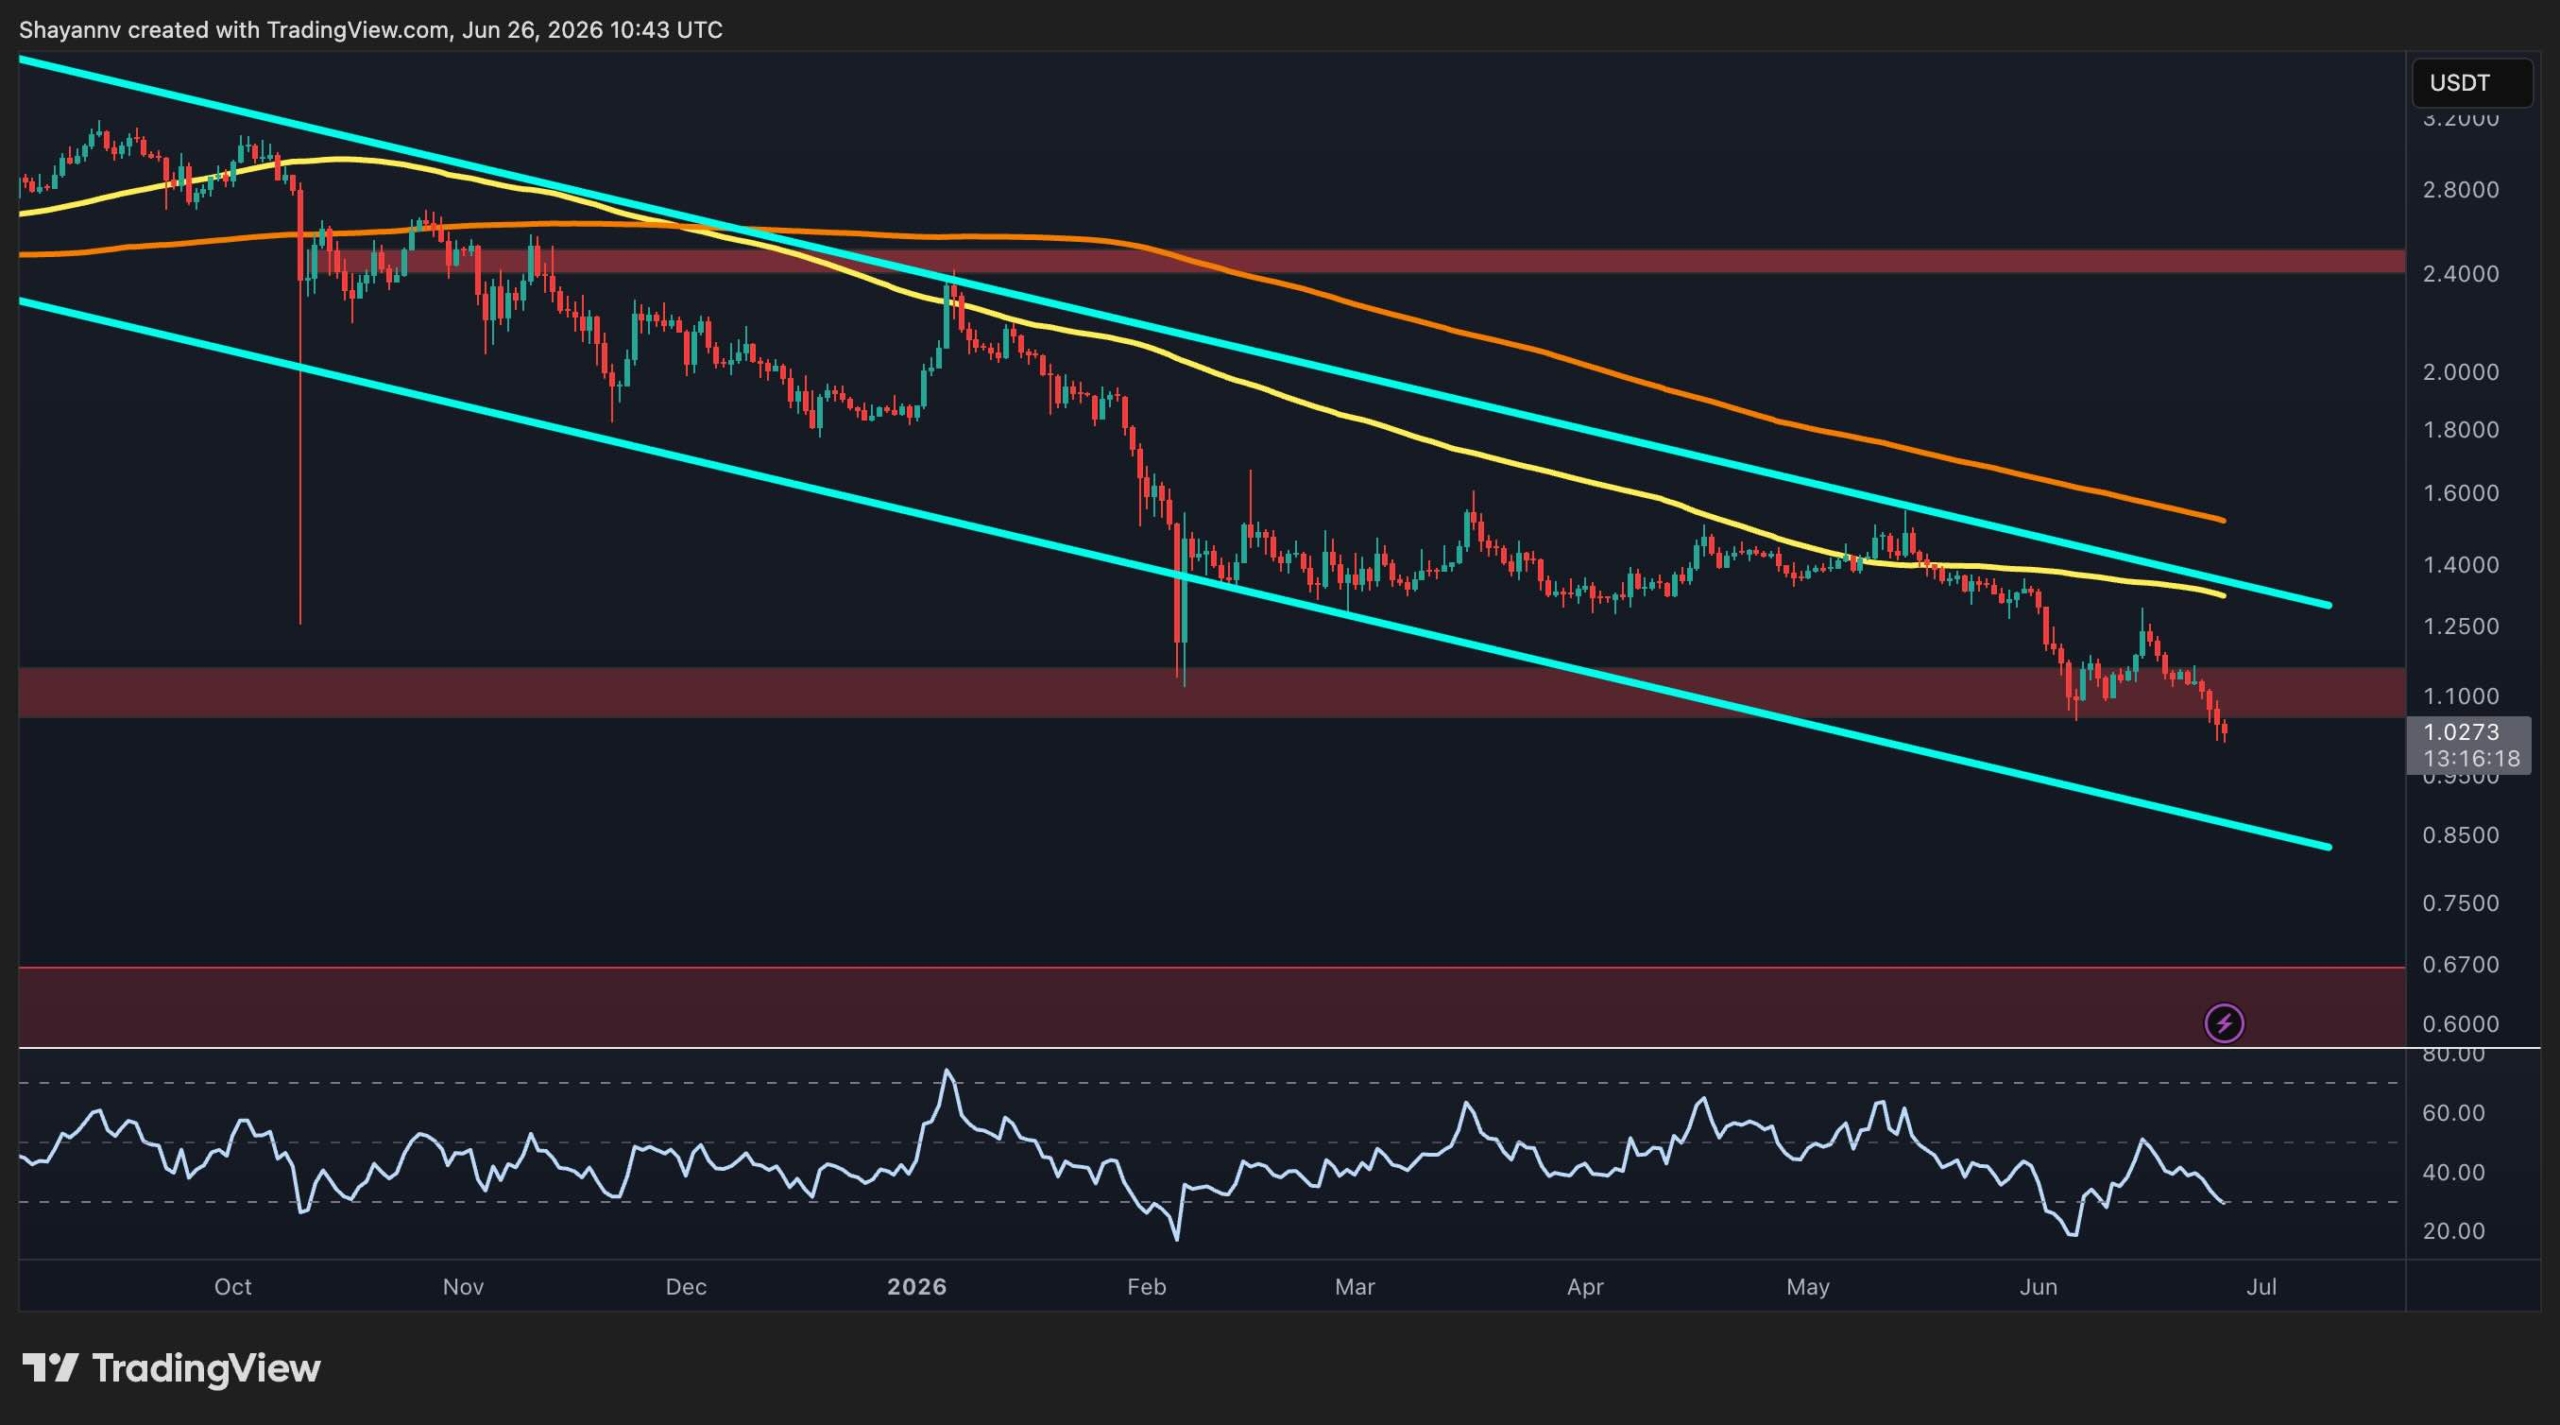
    Against the USDT pair, XRP has extended its long-term downtrend, adhering to a descending channel that has capped price action for several months. The asset is currently trading around $1.04, having narrowly avoided a break below the crucial $1.10 support zone, which has now transitioned into immediate resistance.

    XRP remains positioned below both its 100-day and 200-day moving averages, with the 100-day average situated near $1.25 and the 200-day average around $1.5. Both averages are exhibiting a downward slope, reinforcing the prevailing bearish market structure. The upper boundary of the descending channel is converging with these moving averages, forming a robust resistance cluster that buyers would need to overcome for any significant trend reversal to be considered.

    On the downside, the current support zone around $1.00 is under intense scrutiny. A confirmed breach below this level could open the path to the next major demand region, located approximately at $0.60. Momentum indicators also show continued deterioration, with the Relative Strength Index (RSI) trending towards oversold territory, suggesting that bearish pressure remains dominant, although short-term relief bounces cannot be entirely discounted.

    As long as XRP remains below the descending channel resistance and the key moving averages, the broader market structure will continue to favor sellers, irrespective of any recent stabilization.

    XRP/BTC Analysis

    Against Bitcoin, XRP is also trading within a clearly defined descending channel, reflecting persistent relative weakness over the past several months. The pair is currently trading around 1,720 satoshis, resting directly on a horizontal support level that has historically attracted buyers since May.

    However, the broader technical outlook remains bearish. The price is trading below both the 100-day and 200-day moving averages, which are positioned around 1,850 satoshis and 2,000 satoshis, respectively, with both averages continuing their downward trajectory. Consequently, any recovery attempt is likely to encounter substantial resistance in the 1,850 to 2,000 satoshi range, followed by the upper boundary of the descending channel.

    Should the current support at approximately 1,700 satoshis fail to hold, sellers could target the lower boundary of the channel, near the 1,500 satoshi area. Conversely, defending this level might facilitate another short-term rebound towards the channel resistance. Nevertheless, the overall structure would remain bearish unless XRP manages to reclaim the major moving averages and establish higher highs.

  • XRP Faces Steep Selling Pressure as Profit-to-Loss Ratio Hits Multi-Year Low

    XRP Faces Steep Selling Pressure as Profit-to-Loss Ratio Hits Multi-Year Low

    XRP Selling Pressure Intensifies as Profit-to-Loss Ratio Reaches Multi-Year Low

    On-chain analytics firm Glassnode reported that XRP holders are continuing to realize more losses than profits, with a key indicator reaching its lowest point since August 2022. This decline suggests increasing selling pressure as more holders divest their assets at a loss.

    According to the firm’s update on June 25, the 90-day simple moving average of XRP’s Realized Profit-to-Loss Ratio has fallen to 0.33, down from 0.38 on June 9. This metric, which compares realized profits against realized losses from on-chain transactions, serves as a gauge of overall market profitability.

    A ratio above 1 signifies that realized profits are greater than realized losses, while a value below 1 indicates that losses are more prevalent. The current reading implies that for every dollar of realized losses, only 33 cents in profit is being realized.

    Glassnode noted that this ratio peaked at approximately 50 during XRP’s market surge in 2025, a period characterized by profit-taking significantly outweighing sales at a loss. The subsequent sharp decline signals a substantial shift in market dynamics, with an increasing number of holders exiting their positions at a deficit.

    Based on these observations, the analytics firm indicated that the market is exhibiting signs of intense capitulation among participants moving XRP on-chain. The sustained weakness in the ratio, Glassnode added, suggests that capitulation pressure has become more pronounced in recent weeks.

    Separate data released by Glassnode on June 9 also highlighted a significant reduction in activity on the XRP Ledger. The 90-day average of total transaction fees has dropped from 5,900 XRP in February 2025 to approximately 500 XRP, marking a decrease of roughly 91.5%.

    Collectively, Glassnode’s data suggests that a weakening of network activity has coincided with the deterioration in holder profitability. The realized profit-to-loss ratio experienced a sharp increase during the 2025 rally before steadily declining through late 2025 and into 2026. Total transaction fees followed a similar downward trend after the speculative peak.

    The subdued on-chain metrics have led to varied interpretations among market participants. Some users on X have suggested that such low readings could signal seller exhaustion. Others have pointed to XRP’s ability to remain above the $1 mark despite the weak profitability data.

  • BitGo Cuts 15% of Staff Amid Crypto AI Layoffs

    BitGo Cuts 15% of Staff Amid Crypto AI Layoffs

    BitGo Cuts Workforce Amid Pivot to AI

    BitGo, a prominent crypto custody and infrastructure company, has announced significant workforce reductions, joining a growing trend among technology firms to streamline operations and pivot towards artificial intelligence. The company is cutting nearly 15% of its staff, according to a statement from co-founder and CEO Mike Belshe.

    In a tweet shared on Thursday, Belshe explained the decision, stating, “The ecosystem has evolved, and the way we build financial services has changed dramatically.” He elaborated that to maintain a competitive edge for its clients, BitGo must become “sharper” and more focused. The company’s strategic direction will now emphasize “security, trading, stablecoins, settlement, and AI-powered infrastructure.”

    While BitGo did not disclose the exact number of employees affected, its 2025 annual report indicated a workforce of 603 full-time employees, suggesting approximately 90 roles may have been eliminated. Belshe characterized the layoffs as a “one-time action” and expressed confidence that further cuts are not anticipated, noting that the company’s job board still features numerous open positions.

    These reductions come several months after BitGo’s initial public offering in January, where it priced its shares at $18, raising approximately $213 million and valuing the firm at over $2 billion. Despite a substantial 112.6% surge in first-quarter revenue compared to the previous year, reaching $3.8 billion, the company also experienced an widening of net losses.

    The market reaction to the news was largely negative. BitGo shares, trading under the ticker BTGO, saw a nearly 5% decline on Thursday, closing at $4.80. This represents a significant drop of approximately 73% from its IPO price.

    BitGo’s move aligns with a broader pattern of staff reductions across the cryptocurrency and technology sectors in 2026. Earlier this year, Jack Dorsey’s Block eliminated around 4,000 jobs, roughly 40% of its workforce, citing increased reliance on automation and AI tools. In May, Coinbase reduced its staff by 14%, while crypto data firm Dune let go of a quarter of its employees. Robinhood also trimmed its workforce by 10% in June amid a downturn in crypto revenue.

    The wider tech industry has seen over 120,000 job cuts since the beginning of the year, with major companies like Microsoft and PayPal identifying AI as a key factor driving these downsizing efforts. However, the extent to which AI is the sole or primary driver of these layoffs remains a subject of ongoing debate, with some analysts suggesting it may serve as a convenient justification amidst a challenging market environment.