Tag: Market Trends

  • ETH RSI Divergence Signals Potential Bottom

    ETH RSI Divergence Signals Potential Bottom

    Ethereum Faces Selling Pressure, But Signs of Weakening Bearish Momentum Emerge

    Ethereum continues to grapple with downward pressure on higher timeframes, though recent price action suggests that bearish momentum may be losing steam. While the overarching trend remains decidedly negative, current movements indicate that sellers could be nearing exhaustion after weeks of consistent declines.

    Demand Zone Holds Firm

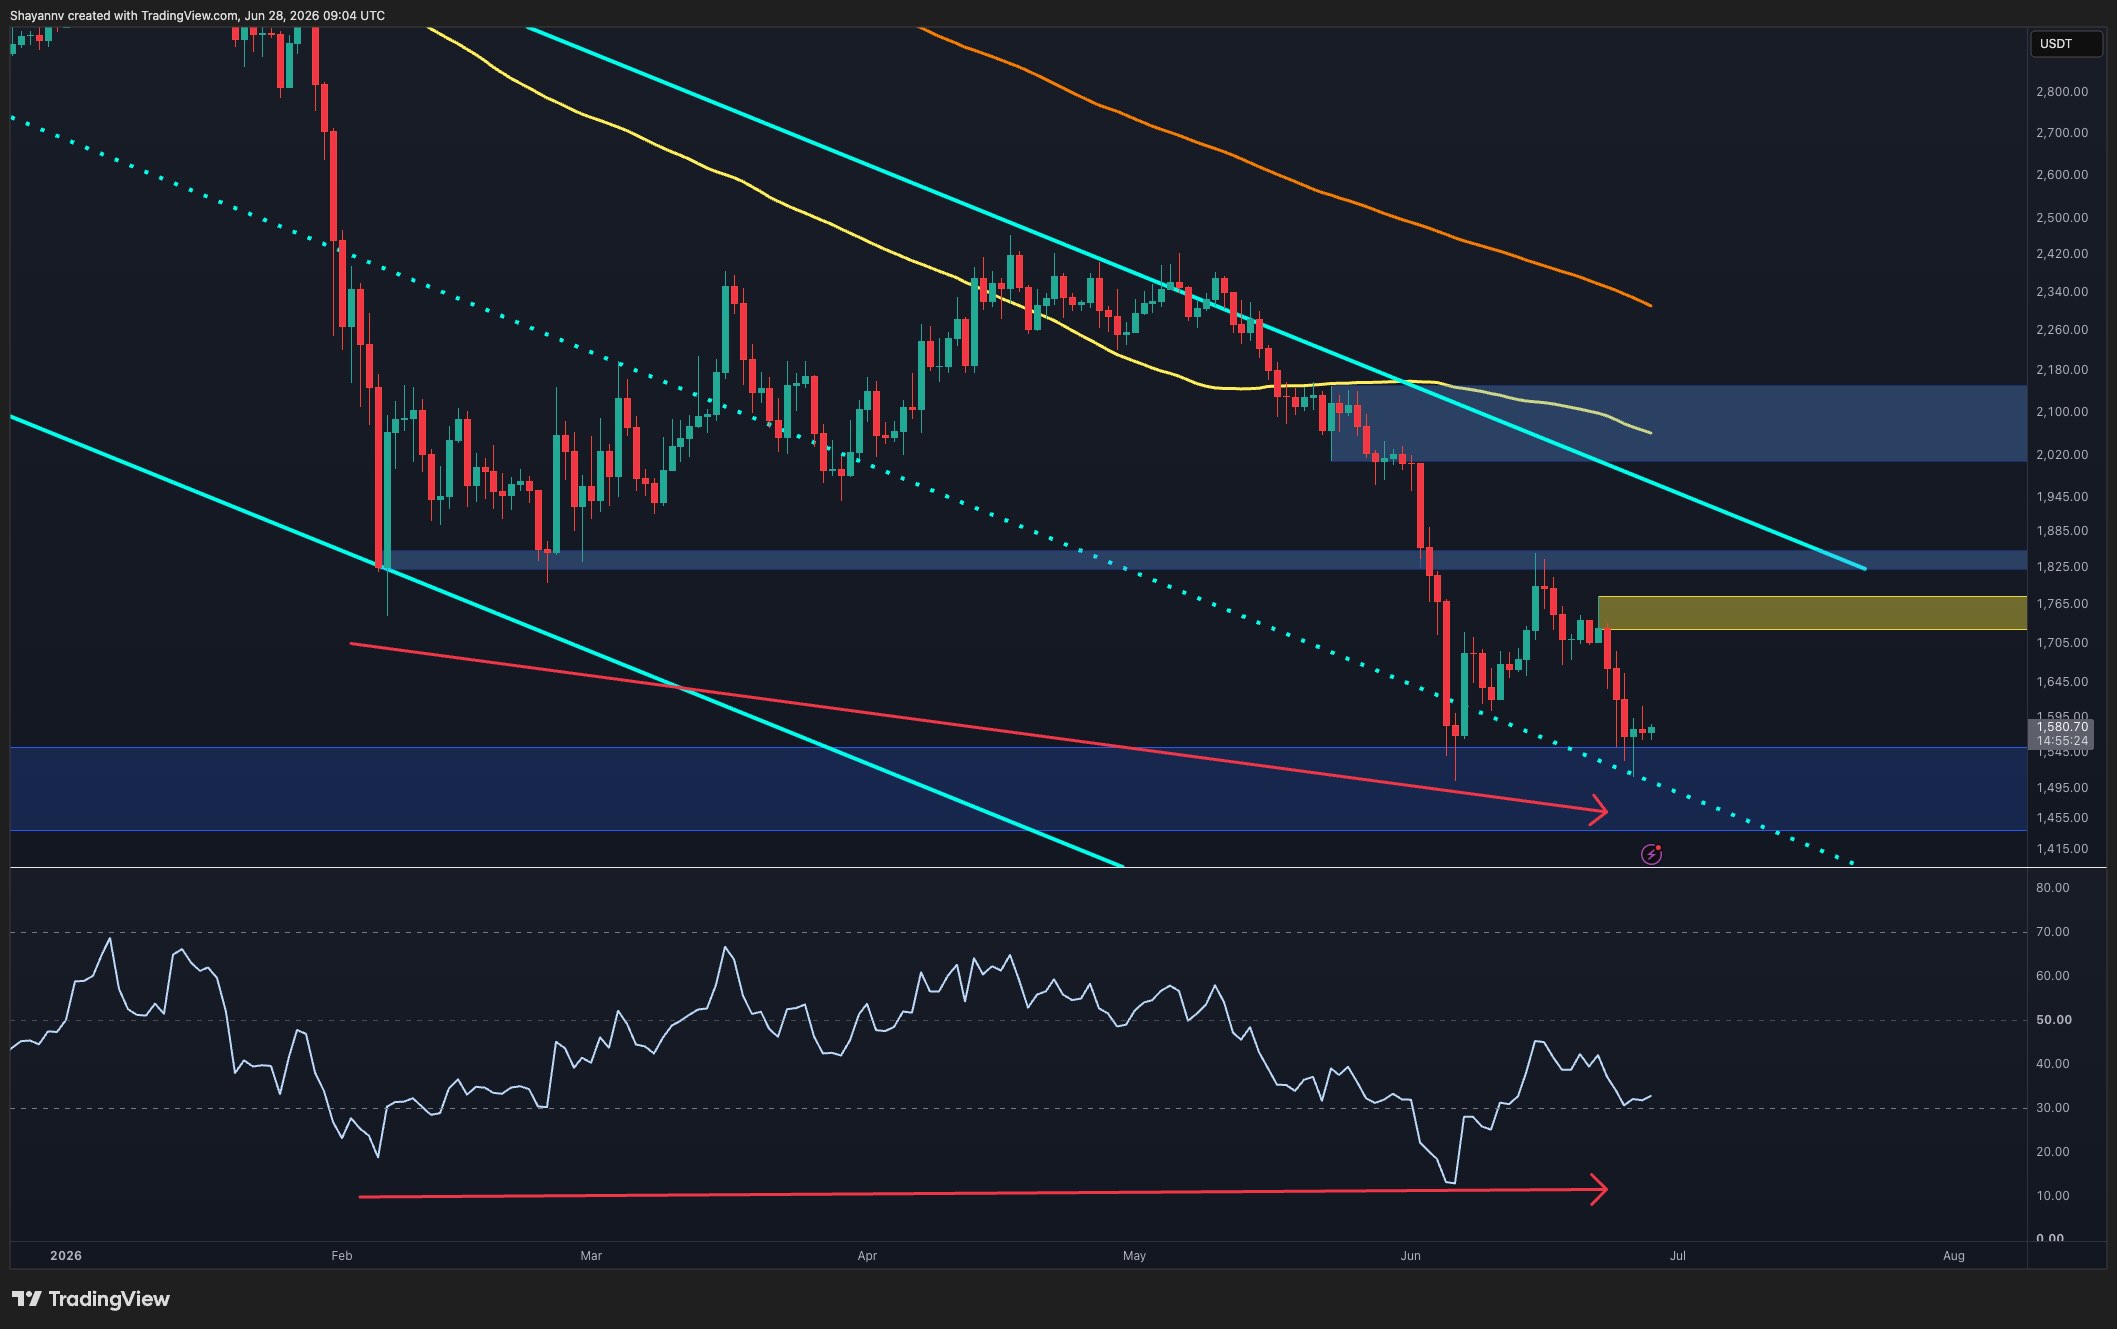
    Ethereum’s recent retreat from the $1.72K-$1.78K supply zone initiated another downward move, pushing the cryptocurrency back into the critical $1.46K-$1.53K demand region. This area has repeatedly served as support throughout June and continues to attract buyers whenever the price approaches it.

    Bullish Divergence on Daily Chart

    A significant development on the daily timeframe is the emergence of bullish divergence on the Relative Strength Index (RSI). While Ethereum has consistently made lower lows during June, the RSI has been forming higher lows near oversold territory. This divergence signals a weakening of downside momentum, even as ETH hovers near cycle lows.

    Although a bullish divergence alone does not guarantee a reversal, it often appears in the later stages of bearish trends and can serve as an early indicator that sellers are losing control. As long as ETH maintains its position above the $1.46K-$1.53K support area, the divergence remains valid, increasing the likelihood of a relief rally.

    Confirmation of a potential reversal would necessitate a break above key resistance zones, particularly the $1.72K-$1.78K supply area. Until then, the broader trend remains bearish, despite the improving momentum indicators.

    Consolidation and Trendline Resistance

    On the 4-hour timeframe, Ethereum has spent recent sessions consolidating above the lower demand zone following a sharp sell-off from resistance. A descending trendline has capped every recovery attempt since the rejection on June 22. However, the asset is now compressing directly beneath this trendline, with contracting volatility. This setup presents the possibility of a short-term breakout if buyers can overcome the trendline resistance.

    A successful breakout could target the $1.72K-$1.78K supply zone, which was the origin of the latest decline. Such a move would align with the bullish RSI divergence observed on the daily chart and could signal the first meaningful recovery rally in several weeks.

    On the downside, the $1.52K area remains a critical level to monitor. A loss of this support would invalidate the short-term bullish outlook and shift focus back toward further downside continuation within the broader downtrend. For now, Ethereum appears caught between support and descending resistance, with the next directional move likely determined by which side breaks first.

    Liquidity Heatmap Reveals Potential Upside Sweep

    The liquidation heatmap indicates an interesting shift in liquidity positioning. While liquidity remains concentrated above the current price, particularly between approximately $1.68K and $1.80K, Ethereum is currently trading below these significant clusters. Markets often gravitate toward areas with substantial leveraged positions, making these overhead liquidity pools attractive short-term targets.

    This scenario suggests that ETH could stage an upside liquidity sweep before any larger directional move develops. A breakout above the 4-hour descending trendline would increase the probability of price moving into these overhead liquidity pockets, triggering short liquidations and fueling a squeeze toward the $1.7K-$1.8K region.

    Simultaneously, the heatmap also shows notable liquidity beneath the market around the lower support region, indicating that both sides of the current range remain vulnerable to liquidation-driven volatility.

    Combined with the bullish daily RSI divergence and the compression beneath the 4-hour trendline resistance, the current setup suggests Ethereum may first attempt an upside liquidity grab before the market determines whether a more sustainable recovery can materialize. The reaction around the $1.72K-$1.80K liquidity cluster will likely offer crucial insights into Ethereum’s next major trend.


  • XRP Plunge Expected: Will Ripple Shock the Market?

    XRP Plunge Expected: Will Ripple Shock the Market?

    XRP Faces Steep Declines, But History Suggests a Potential Rebound

    The cryptocurrency XRP has endured a challenging period in recent months. Following a peak in mid-July 2025, the asset has seen a significant downturn, shedding over 70% of its value and falling towards the $1.00 mark. It has also been overtaken by BNB and USDC in market capitalization and experienced a six-month losing streak.

    Bearish Outlook Amidst Declines

    This adverse performance has led some analysts to adopt a bearish stance on XRP. While many believe the asset is at a critical juncture in the current cycle, figures like Ali Martinez have warned of potential drops to support levels at $0.80, $0.62, or even $0.51 if the $1.00 threshold fails to hold.

    Data from Glassnode indicates that XRP holders are realizing more losses than profits, suggesting sustained selling pressure even from investors currently at a deficit. Artificial intelligence platform ChatGPT has also issued cautionary predictions should XRP lose the $1.00 level, flipping it from support to resistance. However, such widespread pessimism could paradoxically set the stage for a recovery.

    Historical Precedents for Market Turns

    Market history often shows that extreme consensus, particularly widespread pessimism, can precede significant reversals. As investor Warren Buffett famously advised, “Be fearful when others are greedy, and be greedy when others are fearful.”

    Periods of extreme pessimism have frequently coincided with crucial turning points in the cryptocurrency market. Bitcoin (BTC), Ethereum (ETH), and XRP have all experienced phases where sentiment plummeted before major recoveries began. This pattern often occurs as less committed investors exit the market, allowing long-term holders to accumulate assets at lower prices.

    Signs of Accumulation and Oversold Conditions

    For XRP, evidence of such accumulation appears to be emerging from exchange-traded fund (ETF) investors. Funds tracking XRP’s performance have recorded eight consecutive weeks of inflows, a stark contrast to the significant outflows experienced by BTC and ETH ETFs.

    The recent sell-off has also pushed several on-chain and technical indicators into historically oversold territory. Some analysts suggest that XRP may be approaching a zone where the risk-reward profile becomes more favorable, despite the potential for continued short-term volatility.

    History offers a compelling parallel for XRP. In mid-June, the asset’s sentiment had similarly plunged, only to surge by double digits within 24 hours. Analytics firm Santiment attributed that rally to deteriorating investor behavior.

    June’s Weakness and July’s Potential

    Current data indicates XRP is on track to finish June with a decline exceeding 20%, marking its worst monthly performance since February 2025. CryptoRank data suggests this aligns with historical trends, as June has historically been a predominantly bearish month for XRP.

    In contrast, July has historically been a strong month for XRP. The asset has closed each of the past six Julys in positive territory, often with significant gains. Five of those six months saw double-digit price increases, including substantial rallies of over 45% in 2020 and 2023. The median gain for July stands at nearly 11%.

  • Bitcoin Holds Steady at $60K Amid US-Iran Tensions

    Bitcoin Holds Steady at $60K Amid US-Iran Tensions

    Bitcoin Holds Steady Around $60,000 Amid Geopolitical Tensions

    Bitcoin’s price maintained a relatively stable position around the $60,000 mark over the weekend, weathering new escalations in the Middle East and a broken ceasefire.

    Most altcoins experienced minor losses on a 24-hour basis, with ZEC seeing the steepest decline among larger-cap cryptocurrencies. AAVE also slipped below $90 following a significant correction.

    The primary cryptocurrency began the business week with a strong surge to $65,500, having reclaimed the $64,000 support level over the weekend. However, this upward momentum proved short-lived, leading to a challenging few days. Initially, sellers pushed the price below $62,400, followed by two further declines that brought Bitcoin to multi-year lows.

    On Wednesday, the cryptocurrency plummeted to $59,000 as concerns surrounding Strategy intensified. After a brief rebound to $62,000 on Thursday, often referred to as a “dead-cat bounce,” Bitcoin experienced another substantial drop, plunging to $58,000 – its lowest point since late 2024.

    At this juncture, bulls finally intervened, preventing a further breakdown. Bitcoin subsequently rebounded by a couple of thousand dollars and has largely hovered around $60,000 for the past 36 hours.

    This period of calm is particularly noteworthy given the recent developments in the Middle East, where the United States and Iran have engaged in retaliatory actions and accused each other of violating the ceasefire.

    Bitcoin’s market capitalization currently exceeds $1.2 trillion, according to CoinGecko, with its dominance over altcoins nearing 56% once again.

    While most altcoins are trading in negative territory today, their declines are relatively minor compared to the volatility seen throughout the week. Ethereum remains just below $1,600, XRP is trading at $1.05, SOL is above $70, and HYPE is at $63. BNB has seen a slightly larger drop, while DOGE is down by over 2.3%.

    ZEC has suffered the most significant losses among larger-cap altcoins today, struggling at $385. AAVE has lost much of its recent gains, falling back below $90. M continues to set new lows, with an additional 13% decline pushing it to $0.68. In contrast, VELVET has surged by 30%, entering the top 100 altcoins by market capitalization, and PUMP has followed suit with a 15% increase.

    The total cryptocurrency market capitalization has decreased by approximately $20 billion daily, now standing below $2.160 trillion, according to CoinGecko.

  • XRP’s July Plunge Risk: ChatGPT Warns of Sub-$1 Drop

    XRP’s July Plunge Risk: ChatGPT Warns of Sub-$1 Drop

    Bears Tighten Grip as XRP Nears Psychological $1.00 Mark

    The cryptocurrency market, once a beacon of optimism, now appears firmly in the grip of bearish sentiment, with the psychological $1.00 level for XRP coming into sharp focus. What seemed improbable just months ago, or even weeks, has become a distinct possibility in the current landscape.

    Just eleven months ago, XRP commanded a price of $3.65. Even subsequent corrections that pushed it below $3.00 and then $2.00 felt significant at the time. However, a sustained breakdown below the $1.00 threshold was largely considered unthinkable. Now, with Bitcoin struggling to maintain its $60,000 support, such a scenario for XRP is highly anticipated.

    On Thursday, as the broader market experienced a significant downturn, XRP plummeted to $1.01. This raises a critical question: how low could the token fall if this crucial support level falters? To explore this, we turned to ChatGPT for its insights.

    The popular AI model cautioned that a clean break below $1.00, particularly by the end of June or in July, might not see the price stabilize at $0.99. Instead, a decisive daily close beneath this round-numbered support could transform it into a resistance level. In such a scenario, the initial downside target is projected to be between $0.96 and $0.94. While this could signal the “first wave of damage,” it may not necessarily mark the ultimate bottom.

    The true danger, according to ChatGPT’s analysis, emerges if XRP loses the $0.94 level. This would reportedly open a clear path for the asset to descend towards $0.90. Should panic accelerate, further downside targets are identified at $0.87, $0.82, and $0.78, levels that align with projections from several prominent analysts regarding XRP’s potential floor.

    In a worst-case scenario for XRP in July, ChatGPT predicted a potential crash to $0.65. The AI explained that this level is significant because it lies sufficiently below immediate support to shake out late buyers, liquidate leveraged long positions, and fundamentally reset market sentiment. Such a drop would represent a 35% decline from $1.00 and a nearly 40% fall from the current approximate price of $1.05.

    However, OpenAI’s solution also outlined an alternative scenario. If XRP bulls manage to defend the $1.00 support and the overall market environment improves or at least ceases to deteriorate, Ripple’s token could see a recovery. To achieve this, XRP would need to reclaim key resistance levels at $1.08 and $1.10. A sustained move beyond $1.10 would invalidate the bearish thesis of a plunge below $1.00.

    Nevertheless, until XRP decisively breaks above $1.10 and maintains that position, any upward movements are likely to be viewed with skepticism. Instead of signaling a genuine recovery, these bounces may be perceived as opportunities for sellers to re-enter the market and push the price back below the critical $1.00 territory.

  • Assets Plummet: Where’s the Capital Flowing?

    Assets Plummet: Where’s the Capital Flowing?

    Bitcoin’s Downturn Continues, Investors Shift Billions from Crypto and Gold to Semiconductors

    Bitcoin has experienced a significant decline since the beginning of the year, falling below the $60,000 mark for the first time since late 2024. The largest funds tracking its performance have collectively shed over $8 billion in recent weeks.

    Gold, which started the year with a positive surge to a new all-time high, has also seen its trajectory reverse and is now trading in negative territory. This raises the question of where investors are reallocating their capital.

    ETF Outflows and Inflows

    The exodus from Bitcoin Exchange Traded Funds (ETFs) began in November, following a substantial market correction in October. Investors withdrew $3.5 billion in November, with billions more pulled out in December and January. The trend showed a brief recovery in March and April, with net inflows of $1.32 billion and $1.97 billion, respectively.

    However, May marked a renewed downturn, with $2.43 billion withdrawn. June is currently on pace to set a record for the highest net outflows, with over $4 billion already withdrawn. The cumulative net inflows for Bitcoin ETFs have decreased from a peak of $61.19 billion in October to $51.61 billion as of last week, representing a reduction of nearly $10 billion. In the past seven weeks alone, these funds have seen approximately $8 billion in outflows.

    The performance of gold ETFs mirrors this trend. While these funds initially attracted significant capital at the start of the year, coinciding with gold’s record high, recent data indicates a shift. According to The Kobeissi Letter, ETFs tracking both Bitcoin and gold have experienced a combined $12 billion in cumulative outflows since April.

    “The largest US gold-backed ETF, $GLD, is down -13% since the start of April, while the largest Bitcoin ETF, $IBIT, is down -12%,” the analysis noted.

    A Broader Market Perspective

    This pattern of withdrawals is not universal across all investment assets. Data from the same analysts reveals that US-listed ETFs, in general, have attracted over $1 trillion in net inflows in 2026, positioning them to set a new annual record.

    The significant capital leaving Bitcoin and gold appears to be flowing into US semiconductor ETFs. The Kobeissi Letter reported that these semiconductor-focused ETFs have attracted $20 billion in cumulative inflows within the same timeframe that gold and Bitcoin funds lost $12 billion. This trend reportedly accelerated in mid-May and has continued into June.

    Analysts concluded that semiconductor ETFs, such as $SOXX and $SMH, have seen substantial gains of 81% and 60%, respectively, over the period during which $GLD and $IBIT have declined by 13% and 12%. This suggests a rotation by retail investors out of gold and Bitcoin and into semiconductor stocks.

    The data highlights a clear divergence:

    • Since April, US gold and Bitcoin ETFs have recorded cumulative outflows totaling -$12 billion.
    • Concurrently, US semiconductor ETFs have attracted cumulative inflows of +$20 billion.
  • XRP, HYPE Lead ETF Race as SOL Joins BTC, ETH

    XRP, HYPE Lead ETF Race as SOL Joins BTC, ETH

    ETF Investors Favor Smaller Cryptocurrencies Over Bitcoin and Ethereum

    Investor sentiment towards cryptocurrency exchange-traded funds (ETFs) continues to show a stark divergence, with funds tracking smaller digital assets outperforming those focused on the market leaders. Last week saw record outflows from Bitcoin ETFs, while funds dedicated to HYPE and XRP maintained their positive momentum. Solana (SOL) ETFs, however, reversed their previous week’s gains, turning negative.

    CryptoPotato previously reported that spot ETFs tracking HYPE, XRP, and SOL had bucked the trend set by Bitcoin and Ethereum, attracting significant capital. This trend persisted for two of those assets over the past week, with HYPE funds experiencing a particularly strong Thursday.

    Data from SoSoValue indicates that Thursday was a standout day for HYPE ETFs, with net inflows exceeding $108 million, marking the funds’ best single-day performance by a considerable margin. Modest inflows of $1.46 million on Tuesday and $1.82 million on Friday brought the weekly total to $111.36 million in net inflows. This figure also set a new record for the largest weekly inflows, surpassing the previous high of $72.38 million recorded during the funds’ second week of operation.

    Spot XRP ETFs also concluded the week on a strong note, though not reaching the scale of HYPE’s Thursday surge. These funds attracted $15.63 million on Friday, building on $5.31 million on Monday and $2.05 million on Wednesday. With zero net inflows on Tuesday and Thursday, the week closed with $23 million in net inflows for XRP ETFs, their strongest performance in six weeks.

    The cumulative net flows for these ETFs have now reached an all-time high of $1.47 billion. Furthermore, both XRP and HYPE ETFs have maintained an unbroken streak of positive weekly inflows for eight and seven consecutive weeks, respectively.

    While HYPE and XRP products have sustained their impressive performance, SOL ETFs have seen a reversal, experiencing a net outflow of $3.8 million. This places Solana ETFs in the same category as Bitcoin and Ethereum, which have also seen outflows.

    Spot Bitcoin ETFs experienced another substantial withdrawal last week, with nearly $1.8 billion exiting the funds. This marks their second-worst weekly performance in their 2.5-year history. Ethereum ETFs also ended the week in negative territory, with more than $273 million withdrawn.

  • Crypto Venture Funding Dries Up Amidst Investor Exodus

    Crypto Venture Funding Dries Up Amidst Investor Exodus

    Crypto Venture Activity Contracts as Investor Participation Reaches Six-Year Low

    Venture capital activity in the cryptocurrency sector continued its contraction through 2026, with the number of participating investors plummeting from previous cycle peaks.

    CryptoRank’s latest analysis reveals a significant decline in unique investors engaging in crypto funding rounds. In the second quarter of 2026, this figure dropped to 651, a stark contrast to the record high of 2,564 investors observed in 2022.

    The only period exhibiting lower investor participation was in 2020, when the quarterly count of active investors fluctuated between 250 and 450. The analytics firm suggests this downturn indicates a venture market increasingly consolidating among a select group of specialized investors.

    Monthly data further underscores a pattern of weak and inconsistent investor engagement over the past year. In September 2025, the number of unique investors stood at 436, rising to 451 in October before falling to 316 in November.

    While the figure saw a modest recovery to 354 in December, it declined again to 273 in January and further to 224 in February. March offered a brief respite with a rebound to 389 investors, but this upward trend proved short-lived, with the number dropping to 229 in April.

    Investor participation edged up to 314 in May, only to fall to 222 in June, marking the lowest monthly level recorded during this period.

    These findings align with previous reports from Galaxy Research, which also noted a slowdown in crypto venture activity. Galaxy Research had previously reported that crypto venture firms deployed approximately $4 billion across 355 blockchain and crypto deals in the first quarter of 2026. This represented a 50% decrease in invested capital compared to the preceding quarter and a 16% reduction in the number of deals.

    Galaxy attributed this slowdown primarily to the absence of substantial late-stage financings that had bolstered activity in late 2025. However, early-stage and seed funding rounds remained relatively stable. The report also indicated that later-stage startups secured 57% of the invested capital during the quarter, with larger, more established companies continuing to attract a greater share of funding.

    Concurrently, fundraising conditions remained challenging. Venture firms grappled with macroeconomic pressures, the lingering effects of the crypto downturn, heightened investor interest in artificial intelligence, and increased competition from spot crypto exchange-traded funds and digital asset treasury companies.

  • XRP Flashes Bullish Signs After $1 Plunge: Ripple’s Next Move?

    XRP Flashes Bullish Signs After $1 Plunge: Ripple’s Next Move?

    XRP Shows Bullish Signals After Price Plunge

    June has proven to be a challenging month for the cryptocurrency market, and Ripple’s cross-border token, XRP, has been no exception. The asset recently lost its market capitalization standing to USDC, plummeting to $1.01 on most exchanges during last week’s market crash.

    However, a prominent analyst has identified the first signs of potential recovery for XRP, suggesting a possible short-term rebound.

    One key indicator highlighted is the Tom DeMark (TD) Sequential, a widely used metric for identifying trend exhaustion. This indicator has now flashed a buy signal following XRP’s recent decline to a multi-year low. According to analyst Crypto_Chase, this pattern, which has historically shown a good success rate for XRP, could signal a “one-to-four daily candlestick relief rebound.”

    Additionally, the analyst pointed to the formation of a Morning Star Doji candlestick pattern over the past three daily sessions. This classic indicator is typically used to signal local price bottoms.

    Crypto_Chase predicts that if buying volume increases in conjunction with these signals, XRP could potentially rise to its first significant resistance level at $1.30. This was the level XRP challenged during a brief market-wide recovery last week before being rejected and subsequently falling back to $1.01.

    In a separate analysis, Crypto_Chase also outlined potential support levels should the market structure deteriorate further. If XRP decisively breaks below the $1.06 support, the next key levels to watch would be $0.80, $0.62, and $0.51, based on the UTXO Realized Price Distribution (URPD) model.

    Like many cryptocurrencies, XRP would need a significant market shift to reverse its current trajectory in June. The month has been particularly brutal, with Ripple’s token shedding over 20% of its value. This marks its worst monthly performance since February 2025, when it experienced a decline of more than 29%.

    On a more positive note, July has historically been a favorable month for XRP. In the past six instances, July has seen gains, with all but July 2021 delivering double-digit increases. Notable surges occurred in 2020 and 2023, with most of these positive July performances following difficult June periods.

  • Altman Predicts Explosive XRP Surge by 2026

    Altman Predicts Explosive XRP Surge by 2026

    ChatGPT, the artificial intelligence model, has suggested that XRP’s most challenging price period may be drawing to a close, even if its chart performance has yet to reflect this optimism. The AI predicts a potential surge to between $3.50 and $5.00 by the end of 2026, with an extreme scenario reaching as high as $6.50.

    The Bull Case for XRP

    This optimistic outlook treats XRP as a digital asset whose underlying value has been steadily increasing for months, outpacing its market price. With XRP currently trading at $1.05, the AI’s projection is bolstered by the belief that the protracted legal battle with the U.S. Securities and Exchange Commission (SEC) is largely behind the asset. This resolution is seen as a significant factor that had previously deterred institutional investment.

    Further supporting this bullish sentiment is the expanding adoption of the XRP Ledger for institutional purposes. This, coupled with a growing trend of tokenizing real-world assets, is providing the network with tangible utility beyond mere speculation.

    The broader Ripple ecosystem is also being strengthened by RLUSD, and increased institutional access through spot XRP Exchange-Traded Funds (ETFs) offers a new avenue for capital that previously lacked a clear entry point into the asset.

    The timing of these developments is also considered crucial. The AI anticipates a resurgence in the broader cryptocurrency bull market around November, driven by improving liquidity conditions and continued progress in U.S. crypto legislation. If this market momentum aligns with these fundamental improvements, XRP could finally begin to bridge the gap between its strengthening fundamentals and its lagging price. An extreme upside scenario could materialize if ETF inflows significantly exceed expectations and network usage accelerates more rapidly than anticipated.

    The Bear Case for XRP

    Conversely, the bearish perspective highlights a subtle yet significant risk: Ripple’s enterprise success may continue to benefit RLUSD and its payment network more directly than XRP itself, potentially causing the token to lag even as the broader ecosystem flourishes.

    Furthermore, macroeconomic weakness or a slower pace of adoption could lead to capital remaining on the sidelines rather than flowing specifically into XRP.

    Despite these risks, the AI still views the risk-reward profile as favorable for investors comfortable with volatility. Much of the historical regulatory discount appears to have already been factored into the price, while several tangible catalysts for growth are still on the horizon.

    Chart Analysis

    The daily chart shows XRP trading at $1.05422, following a severe and sustained decline from highs above $3.65 reached in July of last year. This downturn represents one of the longest grinding downtrends in the current market cycle, with only a brief interruption by a rally towards $2.40 in November before sellers regained firm control. The most recent downward movement in June pushed the price to a new cycle low near $1.04, its current level. Such an extended slide, with minimal significant rallies, suggests that sellers have maintained dominance for the better part of the past year.

    Immediate resistance is observed near $1.20, a level XRP has struggled to hold above during recent attempts to bounce. A more substantial ceiling is present around $1.60, where multiple rejections occurred earlier this year. Support is currently being tested at approximately $1.04, with no clear floor visible below this on the chart.

    The overall chart pattern resembles a textbook descending staircase, similar to XRP’s own chart from a few weeks prior, with each rally attempt failing to reach the heights of the previous one. Momentum indicators on the daily candles appear weak and are still trending downwards, showing little sign of the stabilization typically preceding a genuine reversal.

    Given the significant distance the price would need to cover to reach even the lower end of the AI’s prediction, XRP would likely need to reclaim and sustain a price above $1.60 before the fundamental narrative described by ChatGPT begins to manifest on the chart, rather than solely in headlines.

    Beyond XRP: Emerging Opportunities

    The current market dynamic, where major cryptocurrencies like Bitcoin, Ethereum, and XRP are pressing against similar resistance levels for weeks, highlights a perpetual wait for a catalyst. Institutional inflows are consistently projected for the “next quarter,” and traders anticipating a breakout are dependent on decisions made by others.

    Early-stage infrastructure projects, however, operate under different principles. Capital that would be negligible at the scale of Bitcoin can significantly impact smaller, undiscovered projects. The potential for asymmetric returns lies in the discrepancy between a project’s intrinsic value and its current market perception, a gap that exists until the project gains broader market recognition.

    Cross-chain fragmentation has been a persistent issue in decentralized finance (DeFi) since the advent of the first bridges. Bitcoin, Ethereum, and Solana were designed as independent systems with no inherent interoperability, leading to increased fees, slippage, and execution failures for transactions crossing these boundaries. Bridges, intended as a solution, have instead become a mechanism for extracting value.

    LiquidChain aims to eliminate these fees entirely by operating three networks within a single execution layer, allowing a single deployment to reach all of them without any cross-chain transaction costs. ChatGPT has identified LiquidChain as a project worth monitoring. Its presale is priced at $0.01454, with over $860,000 raised.

    While its execution remains unproven and adoption is uncertain, established assets offer a predictable path to a known ceiling. LiquidChain, conversely, represents an entry point that may disappear once it gains market traction.

  • Stablecoin Founder Map Mismatches Volume Map

    Stablecoin Founder Map Mismatches Volume Map

    The perceived epicenter of the stablecoin opportunity, where capital flows and venture capital firms convene, is often assumed to be in global financial hubs like New York, San Francisco, and London. However, the largest stablecoin markets globally are emerging in regions where many venture capitalists have never conducted a meeting.

    A Global Shift in Stablecoin Activity

    In 2025, global stablecoin transaction volume surged past $28 trillion, eclipsing the combined figures of Visa and Mastercard. Despite the concentration of founders and capital in the U.S. and Europe, where stablecoins are largely viewed as an institutional product, this segment is already highly competitive. Major players like BlackRock, JPMorgan, and Fidelity are actively entering the tokenized money market and enterprise settlement space, leaving limited room for venture-backed startups.

    The true demand for stablecoins is manifesting elsewhere. Nigeria alone boasts over 26 million cryptocurrency users, representing more than one in eight adults, with 59% holding USDT. In Latin America, stablecoin flows constitute 7.7% of the regional GDP, according to IMF data. The critical question is no longer whether emerging markets are significant, but why so many venture capital portfolios seem to disregard this data.

    Stablescape, a tracker of over 3,000 stablecoin and crypto-fintech companies worldwide, reports that 1,300 are based in the United States. In contrast, emerging markets across Latin America, sub-Saharan Africa, Southeast Asia, and the Middle East account for only 32% of these tracked companies, despite generating the majority of real-world stablecoin volume.

    Stablecoins as a Financial Lifeline

    In Argentina, stablecoin purchases now represent over half of all exchange transactions, a trend fueled by triple-digit inflation and currency controls that make accessing dollars a complex bureaucratic challenge. Brazil recorded $318.8 billion in crypto inflows by mid-2025, with over 90% channeled through stablecoins. Sub-Saharan Africa experienced a 52% year-over-year growth, receiving more than $205 billion in on-chain value. Yet, the founders building the infrastructure to meet this demand remain concentrated in cities where these problems are not prevalent.

    The prevailing Western narrative frames stablecoins as infrastructure for sophisticated use cases, such as programmable settlement, DeFi yields, and enterprise treasury management. In these markets, stablecoins enhance existing systems. However, in cities like Lagos, Buenos Aires, and Istanbul, the context is fundamentally different. For millions, stablecoins offer the first reliable method to hold dollar value outside of banks prone to failure, currencies susceptible to collapse, or intermediaries with the power to revoke access abruptly.

    The Rise of B2B Stablecoin Payments

    Business-to-business stablecoin payments across Latin America have seen a dramatic surge, growing from under $100 million per month in early 2023 to over $6 billion per month by mid-2025. This 60-fold increase over 30 months is primarily driven by cross-border commerce rather than retail speculation. Consumer-facing stablecoin products often face significant overheads, including compliance costs that scale with user numbers, precarious local banking relationships, and unit economics that struggle with small retail transfers. Yellow Card, operating in 34 countries, has pivoted entirely from its consumer business to focus on B2B. Similarly, Bitso established its strong position in the Mexico-U.S. corridor through business payment flows, not retail wallets. In both instances, proximity and founders’ deep understanding of their respective corridors proved advantageous.

    A Misplaced Geographic Focus

    In 2024, 30 venture capital firms secured 75% of all capital raised by U.S. funds. While these firms may grasp the macro thesis for stablecoins, their geographic focus appears to be misaligned. The pattern recognition of a Sand Hill Road fund regarding San Francisco founders offers little insight into the potential of a founder in Lagos, Buenos Aires, or Manila.

    A common counterargument is the perceived lack of viable exit opportunities in emerging markets. However, the data contradicts this. OPay is reportedly seeking a $4 billion valuation ahead of a potential IPO, built on African payment infrastructure, and Modern Treasury acquired Beam, a stablecoin cross-border liquidity startup, for $40 million. The exit market is actively forming around the same corridors that Western funds have been slow to support.

    Regulatory Clarity and Emerging Markets

    Regulatory developments, such as the GENIUS Act and MiCA, are significant, and institutional capital naturally gravitates towards regulatory clarity. However, this framing often overlooks that U.S. regulatory clarity is primarily aimed at ensuring stablecoin safety for compliance departments. The substantial volume in Nigeria and Argentina, which outpaces the U.S. market on nearly every metric, does not require additional regulatory clarity. These markets are served by companies funded by regional networks with which Western funds have no existing relationships.

    The Philippines received $39.6 billion in personal remittances in 2025, with transfer costs averaging 5% to 7%, compared to stablecoin transfer costs measured in fractions of a percent. Nigeria’s 2025 Investment and Securities Act brought virtual assets under formal oversight, with licensing regimes established across South Africa, Botswana, Mauritius, and Namibia, and regulatory sandboxes now operational across East and West Africa.

    The Next Generation of Stablecoin Companies

    These corridors are poised to produce the stablecoin companies of the next decade, much like Brazil produced Nubank. These companies succeed by serving customers overlooked by incumbent systems, leveraging local knowledge that external entrants have struggled to replicate. El Dorado, a Latin American stablecoin super-app, surpassed 600,000 users and 3 million transactions in 2025, achieving $2.7 million in annual recurring revenue through 12x annual growth, and became Venezuela’s most downloaded crypto app. Multicoin Capital and Coinbase Ventures invested after the market had already validated the model. This sequence—volume first, local validation second, and global capital third—is expected to repeat across major emerging market corridors over the next five years.

    The stablecoin market has effectively bifurcated. One segment focuses on building enterprise infrastructure for regulated Western institutions, encompassing treasury orchestration, compliance tools, and settlement rails. The other segment is dedicated to providing dollar access for billions of individuals within unstable monetary systems, where stablecoins serve as a financial lifeline rather than merely a crypto product. While one side commands the majority of venture capital, the other already holds the bulk of the demand.

    The on/off-ramp layer, where 57% of companies are locally founded in emerging markets, along with regional remittance networks and local currency issuers across MENA, Latin America, and Southeast Asia, remains significantly underfunded relative to the demand it serves. Companies like Kulipa, developing stablecoin payment infrastructure for African markets, and Mural Pay, focused on cross-border B2B payments in Latin America, represent a category that appears small by Western VC standards until the corridors they serve become impossible to ignore.

    The next generation of stablecoin companies will emerge from founders in Lagos, São Paulo, and Manila. Funds that cultivate relationships in these regions today are likely to achieve the best returns in stablecoins over the coming decade. Those that wait for these companies to appear on platforms like Crunchbase will face the same premium investors have paid in every prior emerging market cycle.

    The landscape is already defined, and the volume is demonstrably present. The only missing element is where venture capital is directing its attention.